
The most expensive cities in the U.S. are usually costly for a good reason — several, really. Residents are willing to pay extra for everything from housing to food to gas if it allows them to live someplace with a wealth of employment opportunities or great weather. Others are looking for cosmopolitan living, with a host of restaurants, museums and other cultural options on tap.
However, in some cases, simple isolation plays a leading role in high prices. When pretty much everything has to be imported over long supply lines, prices are bound to be higher.
We should also note that the country is still reeling from the worst bout of inflation to hit the U.S. economy in 40 years. This macro environment has made the nation’s most expensive cities to live in even pricier than in recent years.
Sign up for Kiplinger’s Free E-Newsletters
Profit and prosper with the best of expert advice on investing, taxes, retirement, personal finance and more – straight to your e-mail.
Profit and prosper with the best of expert advice – straight to your e-mail.
And yet, surprisingly, there’s actually something of a silver lining to these metro areas’ fast-rising prices. As counterintuitive as it may seem, recent research by esteemed New York University economist Edward Wolff shows that “inflation has been a great boon to middle-class U.S. households’ balance sheets, and has therefore helped to mitigate the increase in overall wealth inequality.”
Something tells us that city dwellers coping with the daily reality of relentlessly rising costs probably take little solace in such long-term, macro-level developments. But, hey, at least something good might come out of their increasingly stretched budgets.
But back to the data. To determine just how much the most expensive cities to live in the U.S. really cost, we turned to the latest data from the Council for Community and Economic Research. Its cost of living index collects scores upon scores of prices across 265 urban areas, covering housing, groceries, utilities, transportation, healthcare, and miscellaneous goods and services (such as getting your hair done or going to a movie). We also gathered data on household incomes, home prices and unemployment rates for each city to provide context for local living costs.
Take a closer look at the 10 most expensive cities to live in the U.S.
Source: C2ER’s Cost of Living Index, 2023 Annual Average Data, published October 2023. Index data is based on average prices of goods and services collected during the first three quarters of 2023, with index values based on the new weights for 2023. Population data, household incomes, home values, poverty rates and other demographic information are from the U.S. Census Bureau. Local unemployment rates, courtesy of the U.S. Bureau of Labor Statistics, are not seasonally adjusted, and are as of February 1, 2024 for the month of November 2023, which is the latest available final data. Local unemployment rates for New York City, courtesy of New York State Department of Labor Labor Statistics for the New York City Region and local unemployment rate for San Francisco, courtesy of State of California Employment Development Department.
Most expensive cities to live in the U.S.
10. Washington, District of Columbia

(Image credit: Getty Images)
| Cost of living: | 45.3% above U.S. average |
| City population: | 671,803 |
| Median household income: | $101,027 (U.S.:$74,580) |
| Median home value: | $711,100 (U.S.:$550,548) |
| Unemployment rate: | 5.0% (U.S.:3.7%) |
The nation’s capital is a tale of two cities when it comes to living costs. Housing-related expenses, including rents and mortgages, are by far the most burdensome at 2.3 times the national average, according to C2ER, but other expenses aren’t too bad. In fact, D.C. healthcare costs are a bit below the national average.
Groceries run about 8% above the national average, while utilities are about 10% more expensive. Miscellaneous goods and services are pricier by 15%. Happily, transportation expenses aren’t overly onerous, at less than 8% above the U.S. average. A wide-ranging bus and metro system makes getting to and around the District of Columbia affordable. The DC Circulator bus, for example, costs just $1 and its routes reach popular spots including Georgetown, Union Station and the National Mall.
And, of course, numerous museums and historical sites are free to visit, too.
Be that as it may, the average price of a home in D.C. stands at $1.13 million. Meanwhile, the average apartment rents for $3,490 a month — or $1,943 a month more than the U.S. average.
9. Seattle, Washington

(Image credit: Getty Images)
| Cost of living: | 45.7% above U.S. average |
| City population: | 749,267 |
| Median household income: | $115,409 |
| Median home value: | $924,200 |
| Unemployment rate: | 2.9% |
Just a few years ago, Seattle’s economy was as hot and strong as its coffee, which put relentless upward pressure on prices. COVID-19 offered some respite from the persistent cost increases, but the Emerald City still remains one of the priciest cities in the nation.
It’s not hard to divine why. As a major hub for the technology industry, Seattle is awash in high-paid jobs. Microsoft (MSFT) and Amazon.com (AMZN) are both based in the area, as are many smaller high-tech companies.
As with every city on this list, housing costs are the main driver of Seattle’s sticker shock. Housing-related costs, including insurance, for renters and homeowners are more than three times the U.S. average, according to C2ER.
But the high prices hardly end there. Groceries, transportation, healthcare and miscellaneous goods and services run anywhere from 16% to 39% higher than what the typical American pays. Utilities, however, run only about 2% above the national average.
Although the state of Washington presents a mixed picture when it comes to taxes on retirees, it does happen to be one of the most tax-friendly states for middle-class families.
8. Los Angeles, California
(Image credit: Getty Images)
| Cost of living: | 47.3% above U.S. average |
| City population: | 3,822,224 |
| Median household income: | $76,135 |
| Median home value: | $903,700 |
| Unemployment rate: | 5.0% |
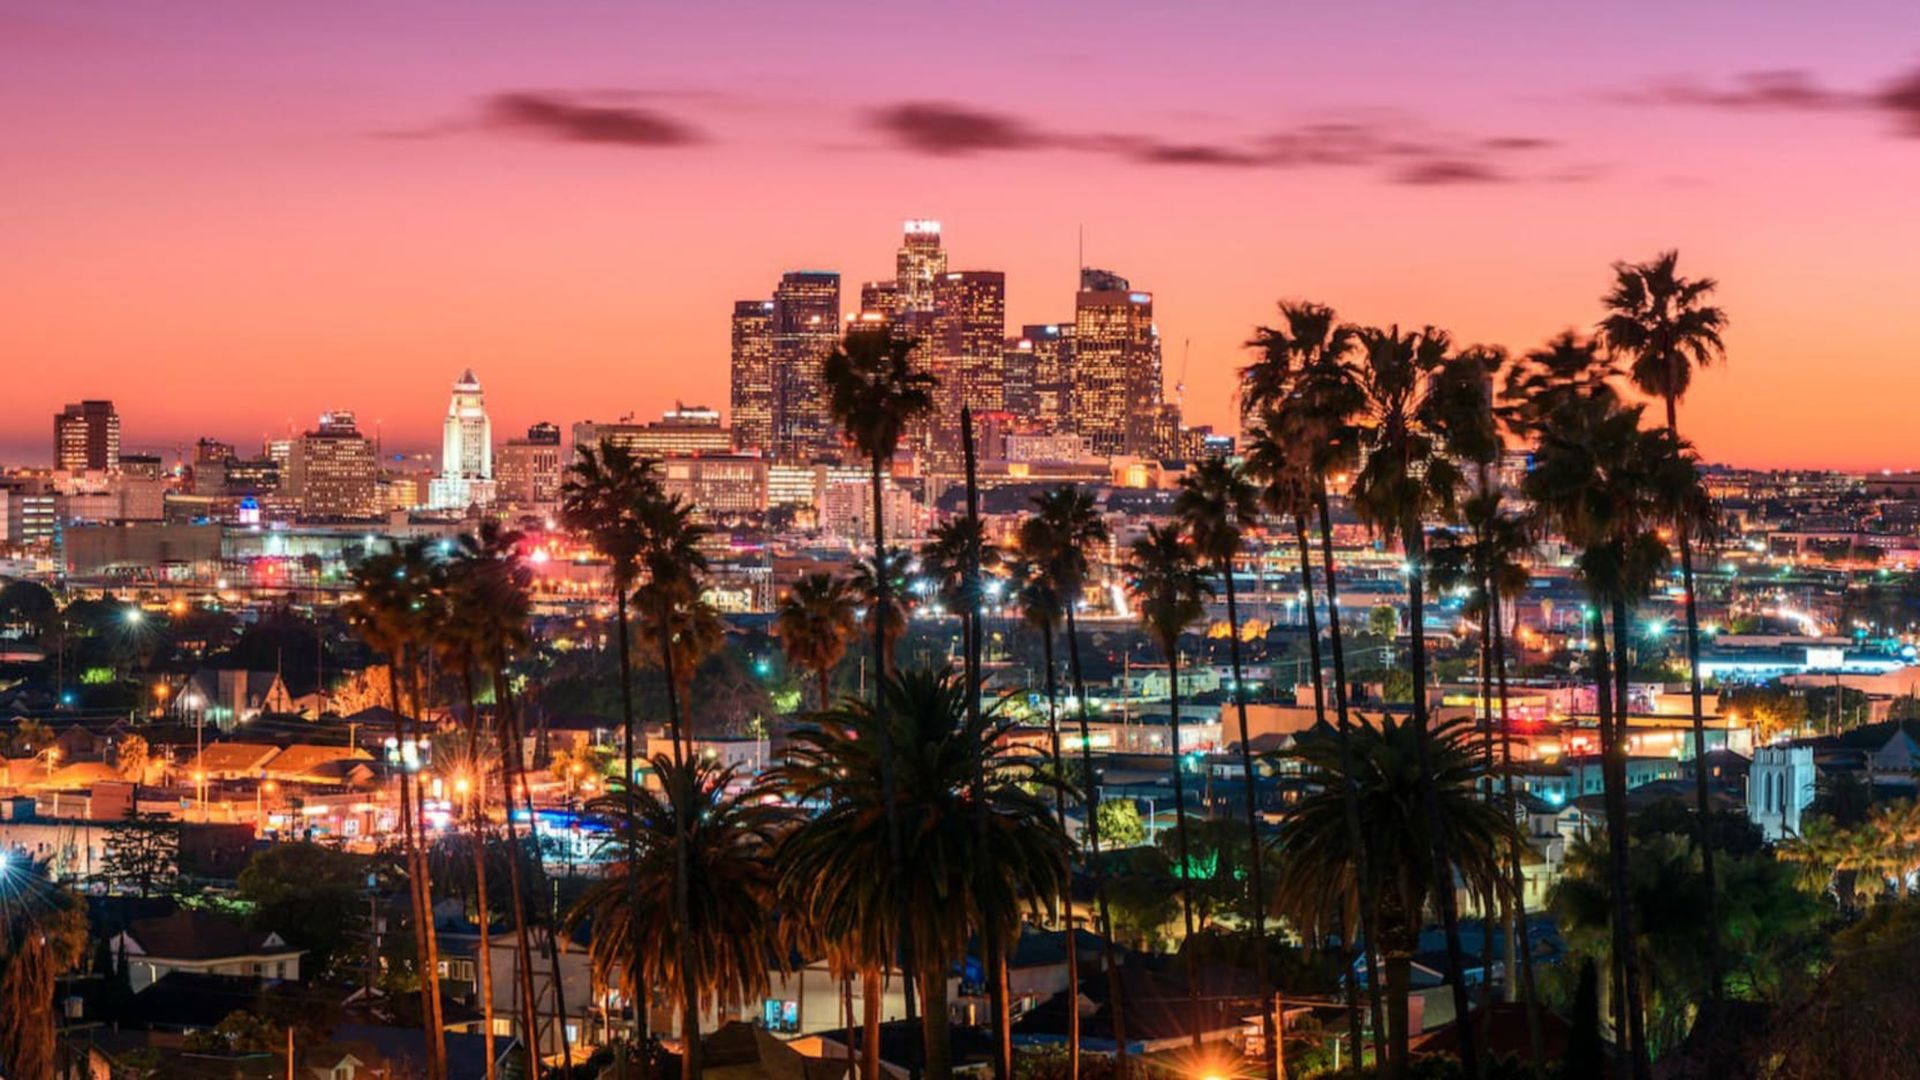
Few cities can top Los Angeles for excess and glamor, but most of its residents don’t work in Hollywood or shop on Rodeo Drive. While high living expenses make L.A. one of the most expensive cities to live in the U.S., median annual incomes are a paltry $1,555 above the national level.
And yet the allure of the nation’s second-largest city remains strong. From Hollywood to Beverly Hills to Venice Beach, few cities can claim as many famous locales. For those who seek culture beyond the Kardashians, L.A. boasts a number of important museums and the world-class Los Angeles Philharmonic.
Just be forewarned that L.A.’s notorious traffic helps push transportation costs 28% above the national average. And although groceries, utilities, healthcare and miscellaneous goods and services are only about 5% to 17% costlier than the U.S. average, housing bleeds residents dry.
Indeed, housing-related expenses, including rents and mortgages, run almost 130% above the national average in Los Angeles. For example, the average price of a home in L.A. comes to $1.25 million, vs the national average of $500,548. Average rent, meanwhile, is twice as high than the U.S. average.
Lastly, there’s another thing that’s unhelpfully elevated in the City of Angels. While the U.S. unemployment rate sits at 3.7%, Los Angeles’ rate stands at 5%.
7. Boston, Massachusetts

(Image credit: Getty Images)
| Cost of living: | 48% above U.S. average |
| County population: | 649,768 |
| Median household income: | $86,331 |
| Median home value: | $701,400 |
| Unemployment rate: | 3.5% |
With its unparalleled collection of universities, hospitals, historical sites, and tech and biotech employers, it’s easy to see why Boston is such an appealing place to live. And while there’s no question the city’s popularity comes at a high cost, it’s not nearly as high as some East Coast cities that are often mentioned in the same breath as Boston.
After all, the high concentrations of students, recent grads and young professionals require some level of affordability to get by while they’re starting out. Transportation, for example, is “only” 17% more expensive than the national average. Healthcare runs 15% more than what the typical American pays, and miscellaneous goods and services are 17% more pricey.
Housing-related costs, however, are a killer, or 127% higher than the national average. Renters and homeowners pay more than twice the national average for their domiciles. For example, the average apartment rents for $4,216 a month in Boston. That compares with a national average of $1,547 a month, according to C2ER. The average price of a Boston home comes to $1,001,917 vs $500,548 nationally.
In another blow to residents’ wallets, Massachusetts isn’t particularly tax-friendly to middle-class families or retirees.
6. Orange County, California
(Image credit: Getty Images)
| Cost of living: | 51.2% above U.S. average |
| County population: | 3,186,989 |
| Median household income: | $106,209 |
| Median home value: | $940,900 |
| Unemployment rate: | 3.8% |
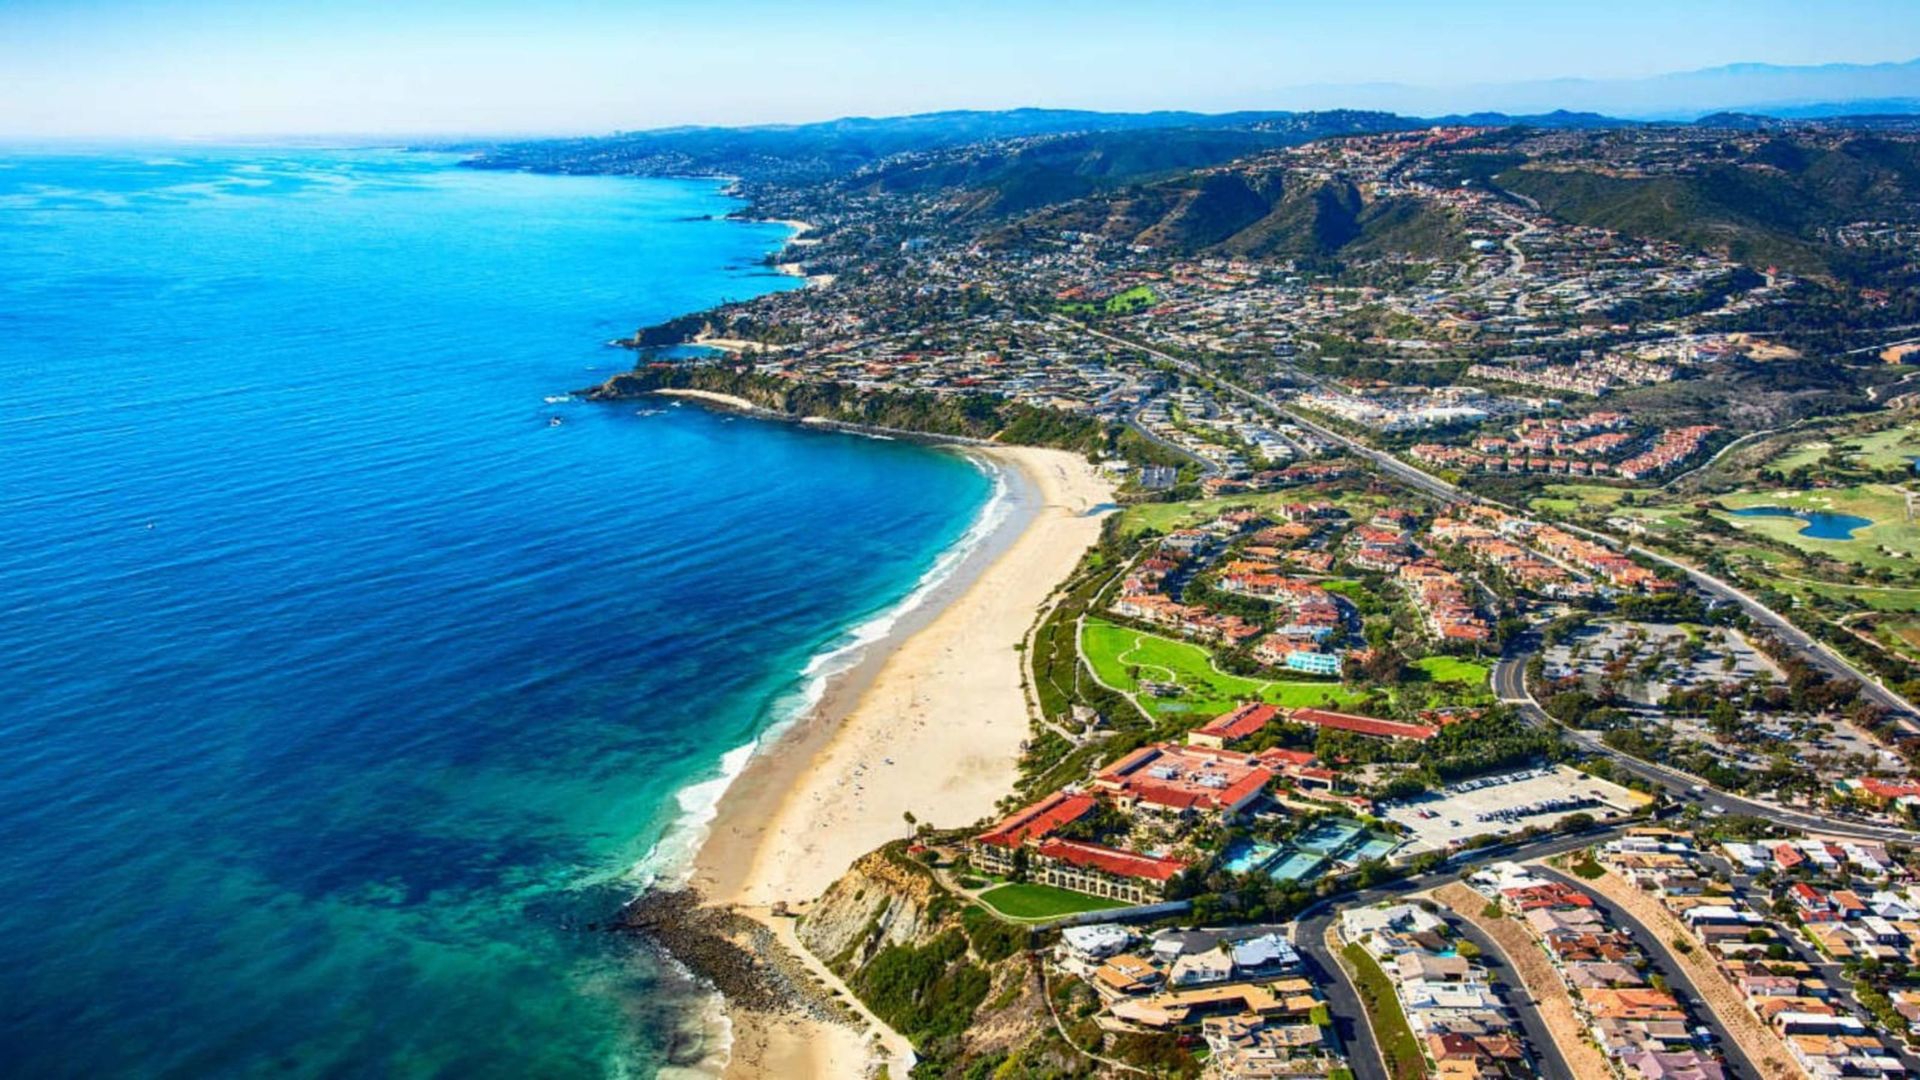
Orange County, known as The O.C. for short, is synonymous with wealth — so much so there was an entire TV series made about it in the 2000s.
Several large municipalities make up the county, which abuts Los Angeles to the southeast, including Anaheim, Santa Ana and Irvine. But it’s the smaller, tonier enclaves such as Newport Beach (median home value: $2 million) that cement Orange County’s reputation for sheltering some of Southern California’s richest and most famous.
In fact, the average home price for all of Orange County sits at $1.38 million according to C2ER. That makes it the sixth priciest market in the country. However, at $3,110 a month, apartment rents are only a bit more than twice the national average.
All in all, housing in the O.C. costs 154% more than what the typical American pays. Other budget-stressors include groceries, which cost about 15% more than the U.S. average, and transportation, which is 26% pricier. On the other side of the ledger, healthcare costs are slightly lower than the national average, and utilities are about 5% cheaper.
5. Brooklyn, New York

(Image credit: Getty Images)
| Cost of living: | 59.7% above U.S. average |
| Borough population: | 2,590,516 |
| Median household income: | $73,951 |
| Median home value: | $849,900 |
| Unemployment rate: | 5.1% |
Technically, Brooklyn is one of the five boroughs that make up New York City, but in the past couple of decades it has emerged as something of a metropolis unto itself. Indeed, if Brooklyn were an independent city, its population would be on par with Chicago, the third-largest city in the nation.
Once upon a time, Brooklyn was considered a viable alternative for those who couldn’t afford to live in Manhattan. Not anymore. Housing-related expenses, including rents and mortgages, are almost four times higher than the national average.
And yet, the median household income in Brooklyn is actually lower than the U.S. median. It’s also almost $22,000 lower than the median household income in Manhattan.
Happily, not everything in Brooklyn is eye-wateringly expensive. Utilities costs are only about 6% higher than their respective national averages. And transportation expenses run just 22% above what the typical American pays. Health care, however, is about 25% more expensive than the U.S. average.
Adding to Brooklynites’ pocketbook pain is the fact that New York is one of the least tax-friendly states for both retirees and middle-class families.
4. San Francisco, California
(Image credit: Getty Images)
| Cost of living: | 69.5% above U.S. average |
| City population: | 808,437 |
| Median household income: | $136,692 |
| Median home value: | $1,343,700 |
| Unemployment rate: | 3.4% |
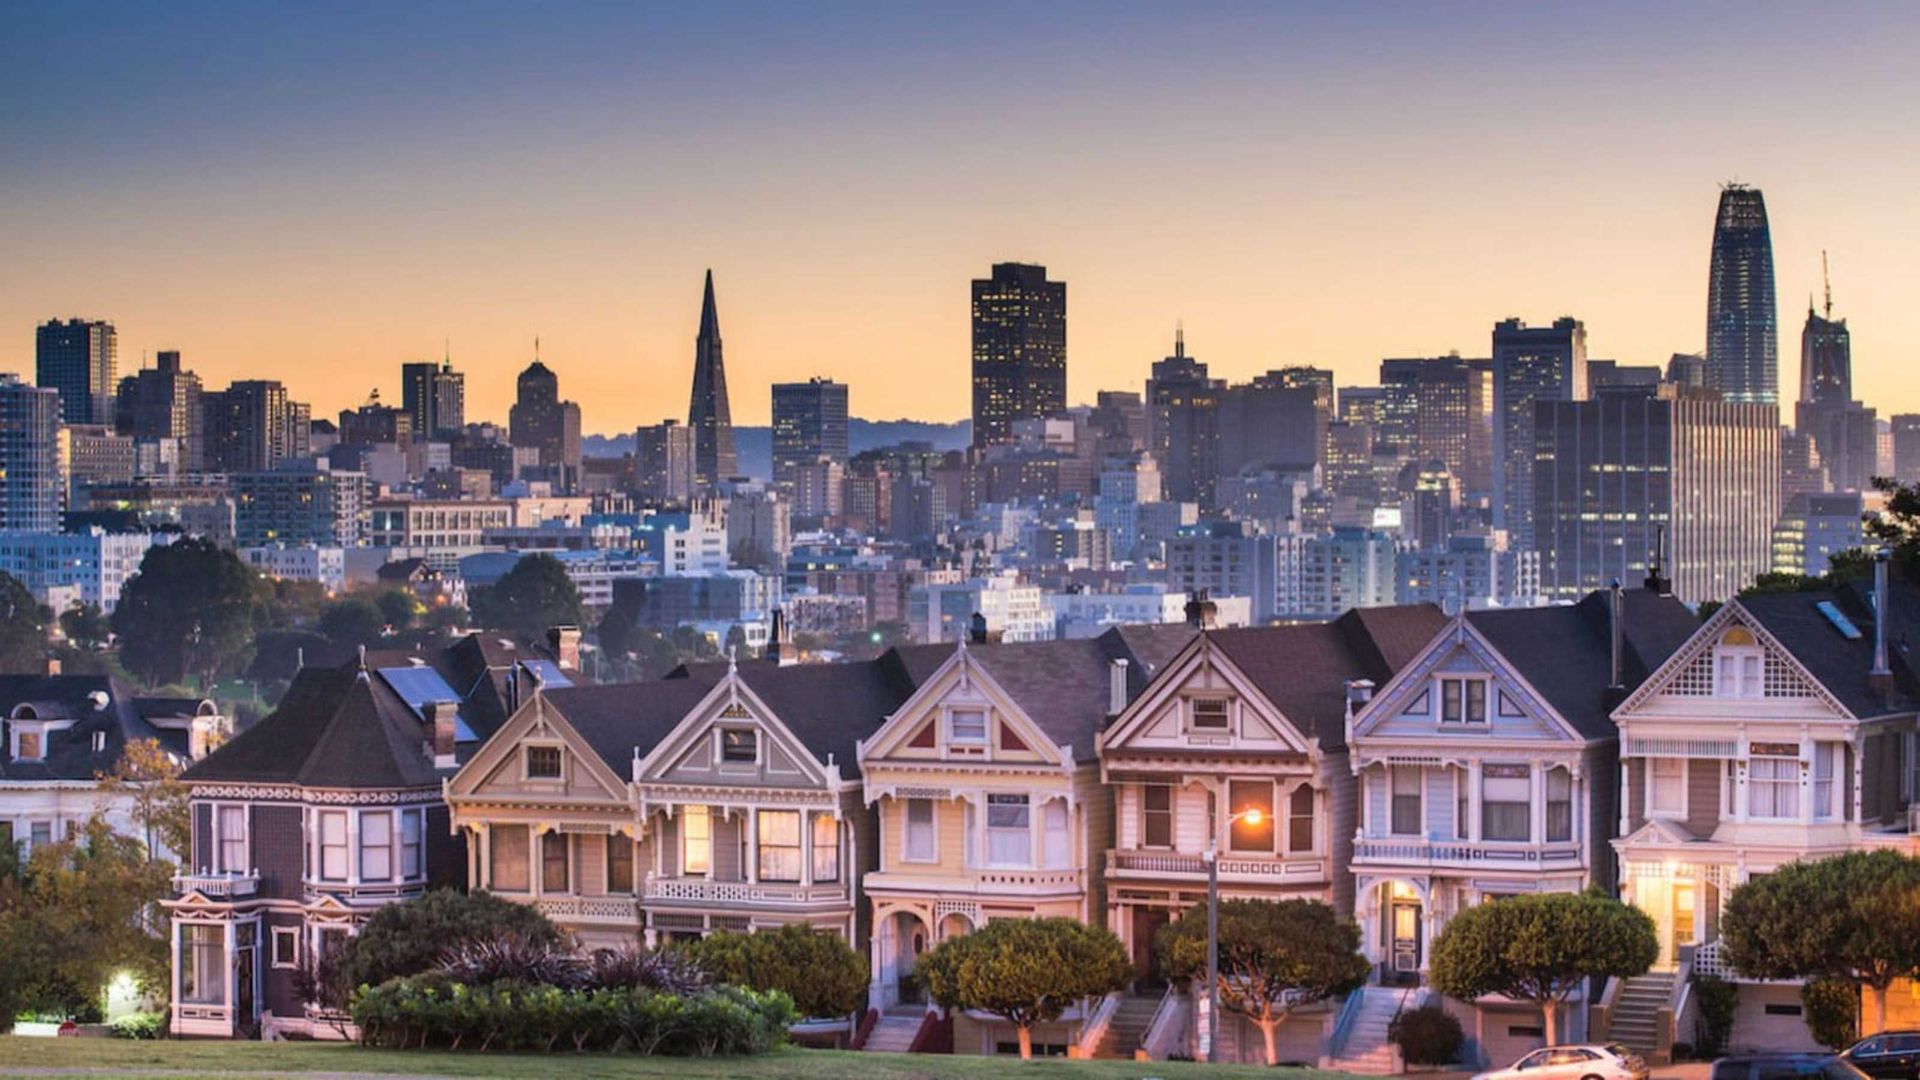
Years of relentless growth driven by high-paid tech workers have given San Francisco some of the highest living costs in the country, meaning even those with fat paychecks, people can struggle to make ends meet.
Houses are famously expensive — a seemingly insurmountable obstacle for aspiring homeowners. The average home price is a staggering $1.4 million in San Francisco, according to C2ER’s cost of living index, and the median home value is the second highest among the 10 most expensive cities to live in the U.S.
Renters don’t fare much better. The average rent for an apartment in San Francisco is $3,862 a month. That’s 2.5 times the national average. Indeed, overall, housing-related costs in San Francisco are almost three times greater than the national average.
And the nosebleed prices don’t stop there. Groceries, utilities, healthcare and transportation expenses all run anywhere from 22% to almost 41% more than what the typical American pays. Even miscellaneous goods and services are nearly a quarter more expensive than the national average
3. San Jose, California

(Image credit: Getty Images)
| Cost of living: | 71.3% above U.S. average |
| City population: | 1,938,524 |
| Median household income: | $148,900 |
| Median home value: | $1,422,600 |
| Unemployment rate: | 3.9% |
San Jose possesses all of the grand natural beauty you might associate with California. The downtown has streets lined with palm trees and you can watch a majestic sunset over silicon valley. This all comes at a high price and that is why it earned the third spot on this list.
The tech roots of this area run deep. IBM established its first West Coast operations in San Jose in 1943 and opened an IBM Research lab in 1952. The hard disk drive was invented there. Today, San Jose is at the epicenter of tech development in America and hosts major facilities for many companies including Ericsson, Hewlett Packard Enterprise, Hitachi, IBM, Lockheed Martin, Qualcomm and the North American headquarters of Samsung Semiconductor.
The abundance of high-paying jobs is necessary if you want to live and work in the area. The typical household income in San Jose is $148,900 and that is almost twice the average of $74,580. If you need to wake up with a cup of coffee before you start your work day it will cost 35% more than most other cities.
Housing costs are 210% higher than the national average and the mean price of a home is $1,670,320. That is 3.3 times what most people pay nationwide at $550,548. The cost of heating and cooling your home, as well as charging your EV, is in line with housing prices and is 38.5% higher than average. Although it is cheaper than neighboring San Francisco where the costs are 41.3% above the norm.
The tax picture is bleak. California has among the highest taxes in the nation. Sales and income taxes are generally high, but effective property tax rates are below the national average. Retirees don’t fare much better. Most types of retirement income are taxable in California and retirees might pay an income tax rate as high as 14.4% if you continue to work and your income tops $1,000,000.
2. Honolulu, Hawaii

(Image credit: Getty Images)
| Cost of living: | 79.2% above U.S. average |
| City population: | 343,437 |
| Median household income: | $82,006 |
| Median home value: | $818,700 |
| Unemployment rate: | 2.5% |
To enjoy the perks of living in such a remote Pacific paradise, Honolulu residents pay more than they would on the mainland for pretty much everything — and it’s not hard to understand why. Most goods sold in Hawaii must arrive either by boat or by plane, which jacks up the price considerably.
Honolulu has by far the most expensive utilities of all 265 urban areas surveyed by C2ER. Utilities cost a whopping 63% more than what folks pay on the U.S. mainland.
Groceries didn’t trail far behind. For example, eggs and bananas cost almost three quarters of the national average. Getting to the store costs more too. Filling up your gas tank will cost 29% more than other cities in the survey. Overall transportation costs are 26% more expensive, and locals shell out upwards of 26% more for healthcare.
But, as always, housing is the biggest income-eater. Housing-related costs are more than three times the national average in Honolulu. Heck, the average home carries a price of almost $1.7 million.
Residents do catch at least one break when it comes to their finances. Hawaii is among the more tax-friendly states for middle-class families on this list, and is one of the most tax-friendly states for retirees.
1. Manhattan, New York
(Image credit: Getty Images)
| Cost of living: | 127.8% above U.S. average |
| Borough population: | 1,596,273 |
| Median household income: | $95,866 |
| Median home value: | $1,006,100 |
| Unemployment rate: | 4.3% |
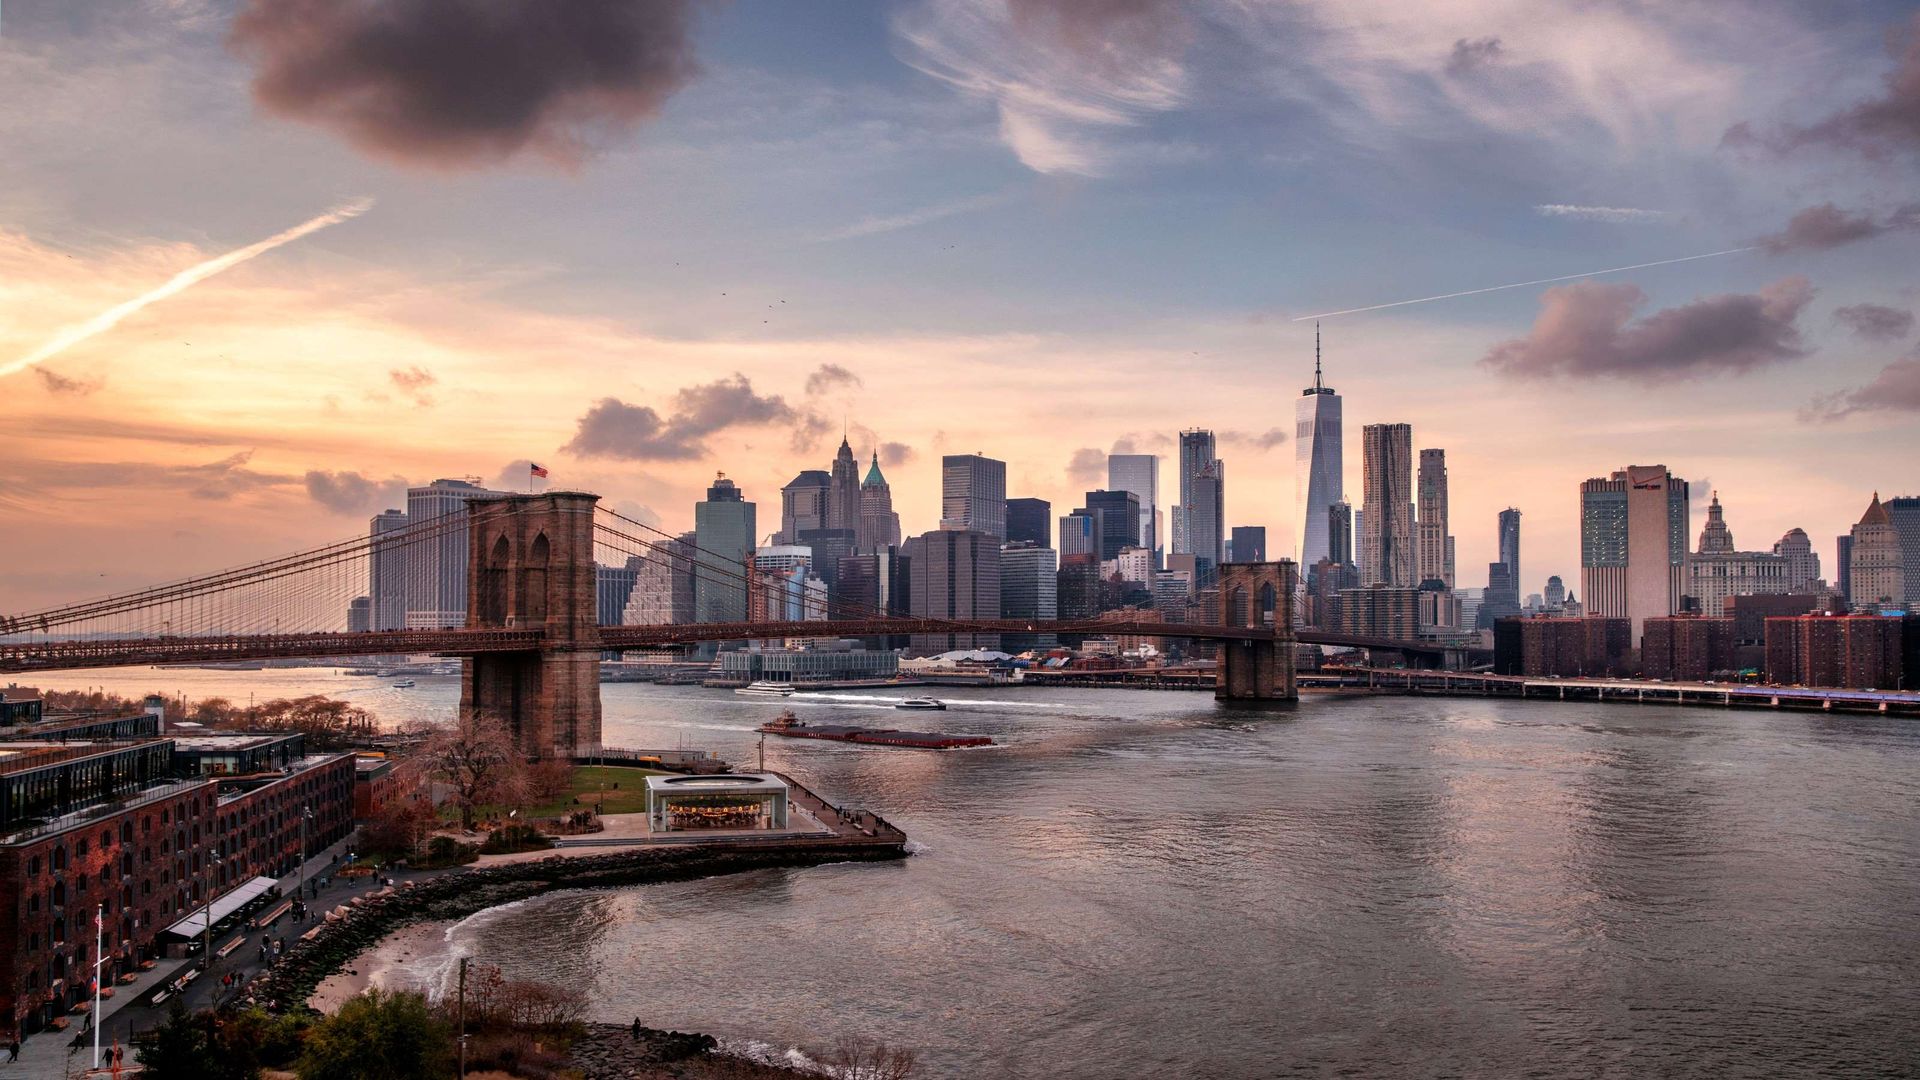
If you’ve ever been to Manhattan, you don’t need us to tell you that it’s an expensive place to visit.
But it’s even more expensive to live there.
With space at a premium and location paramount, the median home value in Manhattan is second only to Honolulu on our list of most expensive cities to live in the U.S. The average apartment rent stands at a stunning $5,743 a month, blowing away every other city tracked by C2ER. Meanwhile, the average home price is $2.74 million.
The budget-busting doesn’t stop there. Residents pay a premium of 30% at the doctor’s office, while transportation runs 15% above average. Meanwhile, miscellaneous goods and services are 26% more expensive. For example, if you want to go to the movies, you’ll pay 63% more for a ticket. Yoga classes cost almost double the national average. All of this and more conspire to make Manhattan the most expensive city in the nation — by a lot.
By the way, you’ll need to like crowds if you hope to make it in the Big Apple: Manhattan packs in almost 70,500 residents per square mile, according to the U.S. Census Bureau. For context, San Francisco, which has one of the highest population densities in the U.S., hosts a mere 17,298 residents per square mile.


