
The Stock Market Is Doing Something Observed Just 3 Times Since 1871 — and History Is Crystal Clear What Happens Next
This recent feat could be a warning sign for investors.
Despite a rough patch in the earlier part of the year in response to the Trump administration’s tariff plan, it has been a good year so far for the stock market’s three main indexes: the S&P 500 (SNPINDEX: ^GSPC), the Nasdaq Composite, and the Dow Jones. Through Oct. 21, they’re up 14.7%, 19%, and 10.8% year to date, respectively.
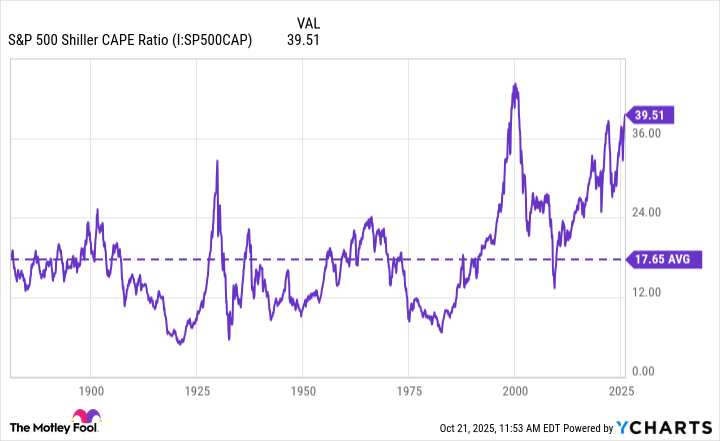
These gains should undoubtedly be celebrated, considering they seemed to be on a much worse path at some point, but with them have come historical feats that could be a warning sign — especially when looking at the S&P 500. There are several metrics used to determine the costliness or cheapness of stocks and indexes, but one of the most relied-upon for the S&P 500 is the Shiller price-to-earnings (P/E) ratio, also known as the CAPE ratio.
While the standard P/E ratio tells you how much you’re paying per $1 of a company’s earnings, the Shiller P/E ratio is based on inflation-adjusted earnings per share (EPS) over the previous 10 years. It’s meant to give a more balanced view, accounting for temporary slumps or booms that could be misleading.
Image source: Getty Images.
What happened the last time the market was this expensive?
At the time of this writing, the Shiller P/E ratio is around 40, which, to put it lightly, is extremely high. This is only the third time in history the ratio has crossed over 40, and the previous two times didn’t end too well for the market, at least in the short term.
The first time the Shiller P/E ratio topped 40 was in late 1999, in the thick of the dot-com bubble. The market peaked in March 2000, before falling by nearly half and finally bottoming out. The Nasdaq Composite declined by around 78% in that span. At the time, it was the worst stock market crash since the Great Depression.
The second time the Shiller P/E ratio topped 40 was in January 2022, during the COVID-19-fueled bull run. The S&P 500 went on to finish 2022 down by over 19%, its worst year since 2008 during the Great Recession.
At its current levels, the S&P 500 is trading at a 124% premium to its historical average.
Should investors be panicking right now?
The most important thing to understand is that past performance doesn’t guarantee future returns, and nobody can predict how the stock market will perform in the short term. Not me, not Wall Street experts, not economists, nobody.
That said, this situation suggests that the chances for a correction or pullback are as high as they have been for a while. It doesn’t mean it will happen; it just means the likelihood increases as the market becomes more expensive.
This isn’t the time to panic, though. Even with short-term slumps — regardless of severity — the market has proven that it tends to bounce back over the long term. The inevitable bear markets and down periods are a natural part of the stock market cycle, though some are more severe than others. And luckily, they typically last much shorter than bull markets.
If time isn’t on your side (i.e., you’re nearing retirement) and you have too much exposure to the S&P 500 or other indexes, now could be a good time to begin diversifying your holdings to avoid a situation where a correction happens right before you need to access your funds for retirement.
For investors still interested in investing in the S&P 500, now could be a good time to consider investing in an equal-weight S&P 500 exchange-traded fund (ETF). Whereas the standard S&P 500 gives more weight to larger companies (causing tech stocks to dominate the top holdings), an equal-weight S&P 500 ETF will divide your investment roughly equally among all stocks in the index. This reduces some of the concentration risk the current S&P 500 has.


