

The last 10 years have been an excellent run for the stock market. Despite two bear markets (2020 and 2022) and two nearly bear markets (2018 and 2025), the S&P 500 (^GSPC 0.11%) has produced a total return of 282% over the last decade, a compound annual return of 14.4%. That’s well above the historical average return for the index. The Nasdaq Composite (^IXIC +0.35%) has fared even better, up 394% (17.3% annually), thanks to the strong performance of tech stocks.
But investors always need to be looking forward. The next 10 years will certainly unfold differently from the last 10 years. And the stock market will likely produce significantly different returns. Nobel Prize-winning economist Robert Shiller thinks that investors should be prepared for what comes after years of exceptionally strong market performance.

Image source: Getty Images.
Shiller’s preferred valuation metric is flashing a major warning sign
The cyclically adjusted price-to-earnings (CAPE) ratio, developed by Shiller as part of his Nobel Prize-winning research, measures the price of an equity (or a group of equities) relative to its average earnings over the last 10 years, adjusted for inflation. The metric smooths out economic cycles and helps produce better long-term return estimates.
The S&P 500 CAPE ratio topped 40 before the end of last year. That’s a level the index hasn’t seen since the height of the dot-com bubble. The index ended the year at a CAPE ratio of 39.9. After the sell-off in the stock market so far this year, the CAPE ratio now sits around 38. That’s still one of the highest levels it’s reached throughout history.
There’s an inverse relationship between the CAPE ratio and future long-term returns. The higher the CAPE ratio, the lower the expected future returns. When the S&P 500 CAPE ratio peaked at the end of 1999, the next decade delivered total returns of negative 9% for the S&P 500. That’s what’s known as the lost decade.
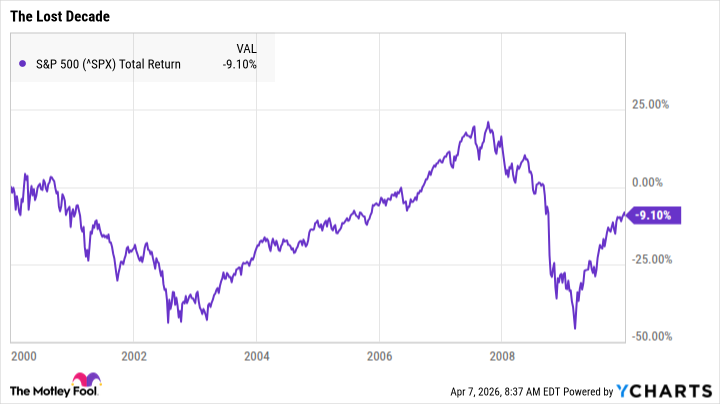
Data by YCharts.
Shiller sees a similar story playing out over the next decade. With index returns driven by a handful of stocks tied to the artificial intelligence (AI) story, he expects only a few survivors out of the group over the long run. The rest, as in the dot-com bubble, may see a significant reduction in their market value as the winners emerge. That’s going to weigh significantly on market returns, just as it did in the early 2000s.
As a result, Shiller’s model expects the S&P 500 to produce total returns averaging just 1.3% over the next decade. Note that this includes dividends. If you look only at nominal returns, Shiller’s model forecasts an annualized return of negative 0.7% over the next 10 years. Based on the S&P 500’s level at the end of 2025, Shiller puts the index level at 6,381 by the end of 2035 — another lost decade.
How to invest in today’s market
Shiller still sees opportunities in today’s market. While AI enthusiasm has pushed the valuations of many tech companies to extremes, there are still stocks trading at attractive values. A company that trades at a good value relative to its earnings and reasonable growth expectations is likely to outperform over the long run.
Investors may consider buying a value stock ETF. Alternatively, they can research individual stocks to determine their fair value and ensure that they buy them with a wide margin of safety, just in case their expectations don’t pan out as well as expected.
Shiller also sees opportunities in international stocks. He points out that the major European and Japanese stock indexes are trading at much more attractive CAPE ratios. The MSCI Europe index has a CAPE ratio of just 22.3, which led Shiller to forecast average annual total returns of 7.8% for European stocks over the next decade. The MSCI Japan index trades at a higher CAPE, 26.4 as of the end of the year, but it still trades below its 20-year average. As such, Shiller’s model expects it to return 6.2% per year over the next 10 years.
Investors should also be wary of over-reliance on the CAPE ratio at extreme valuations. As mentioned, the S&P 500 has only traded above a CAPE ratio of 40 once before. That’s a pretty small sample size. The next 10 years are likely to be different from the last 10 years, but they’ll also look different from the “lost decade.” That said, seeking stocks trading below their fair value and avoiding overhyped stocks is a winning strategy in any market.


