

 In the first part of this week’s UK Property Market Stats Show, Iain White and I look at the UK market for the week ending Sunday 12 April 2026.
In the second part, we examine estate and letting agent performance in Slough, identifying which firms are delivering the strongest results.
The discussion also highlights how agents can use performance data to demonstrate value, helping them compete on more than just price and avoid losing instructions to overvaluing or low-fee competitors.
UK Property Market Headlines for Week 14 2026
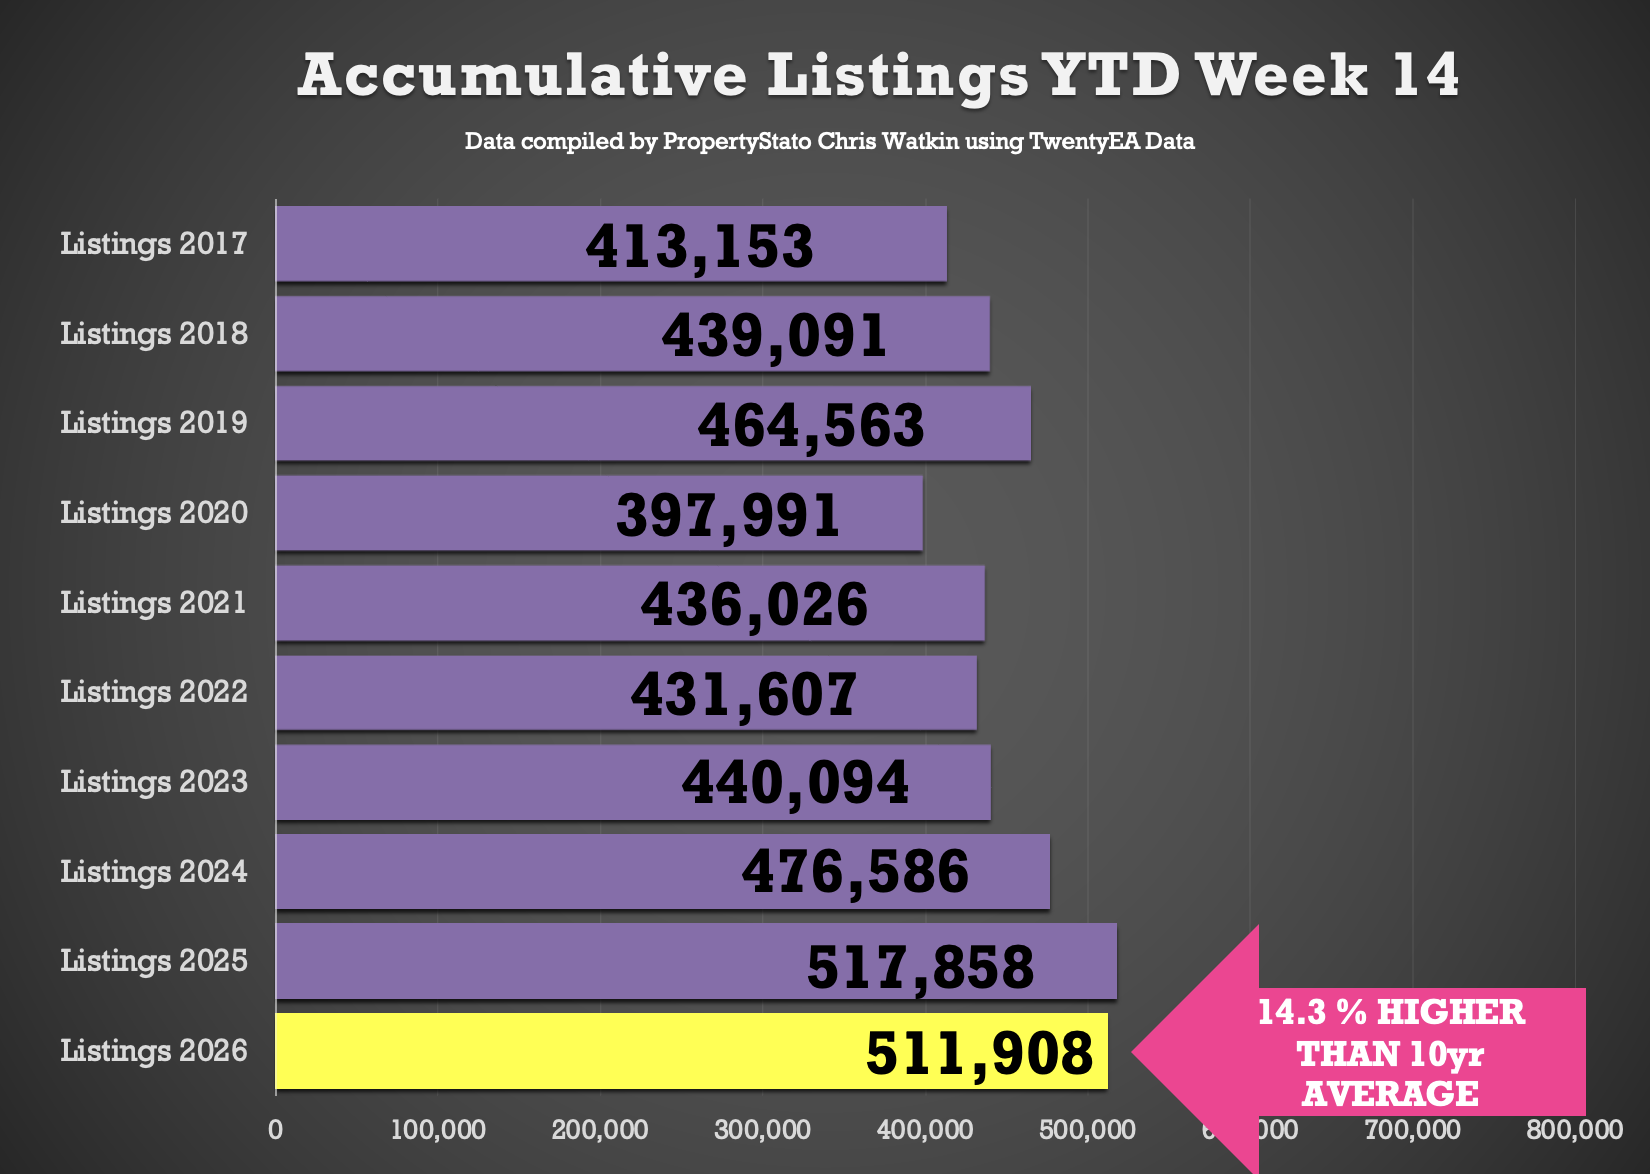
Listings YTD
512k new properties have come onto the market YTD.
1.1% below 2025 YTD, 7.4% above 2024 YTD, and 16.6% higher than the 2017–19 average YTD.
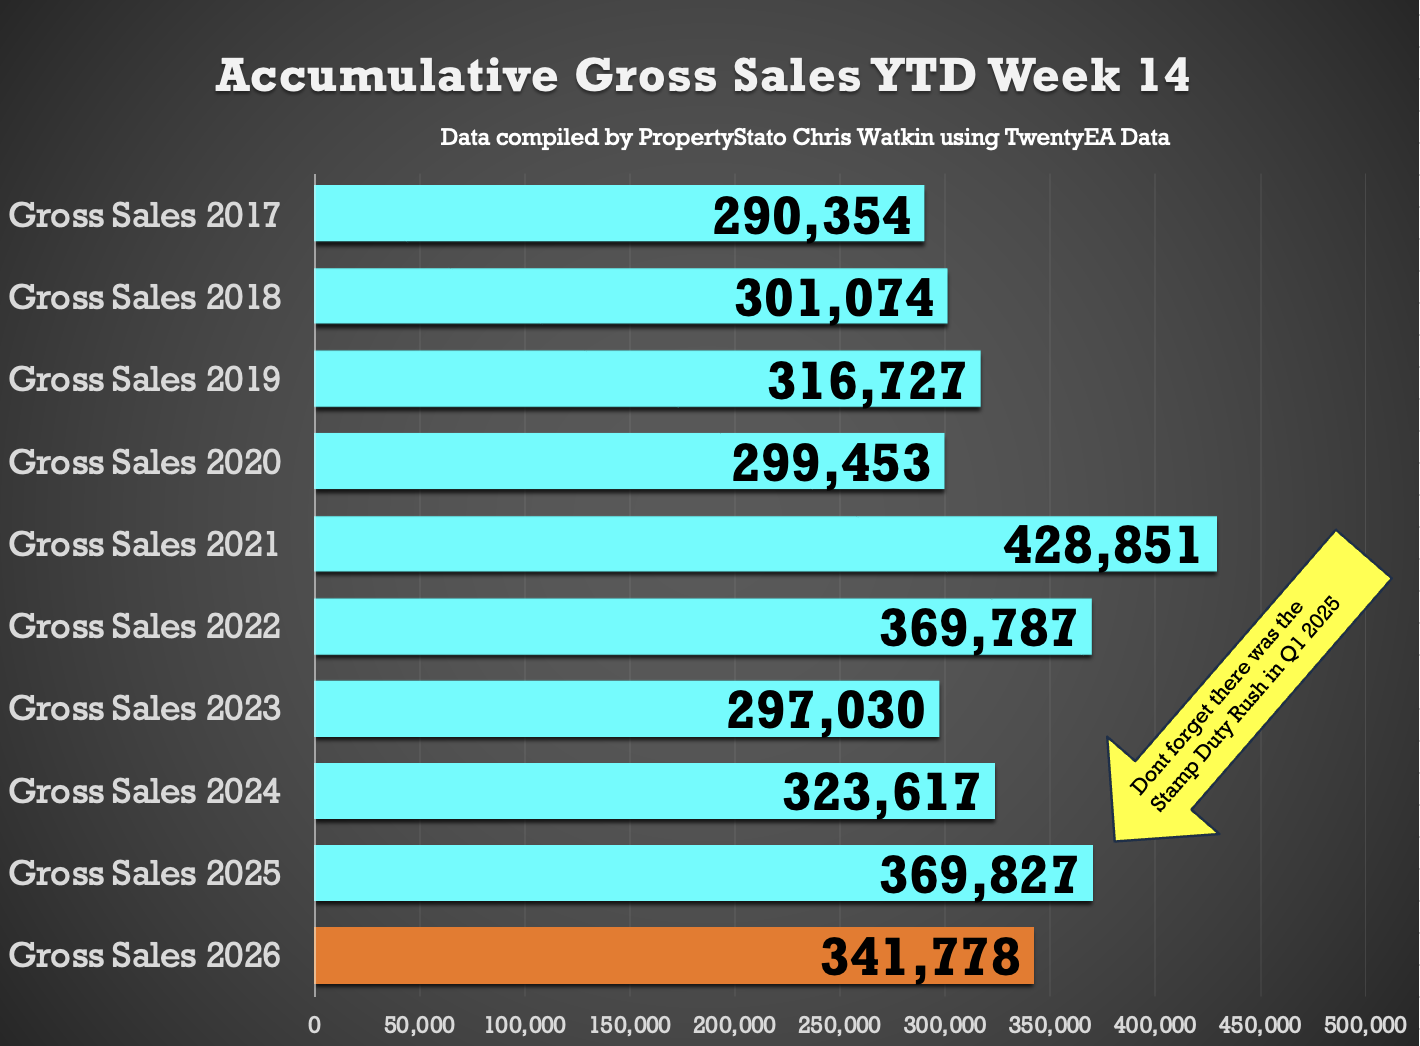
Gross Residential Sales YTD
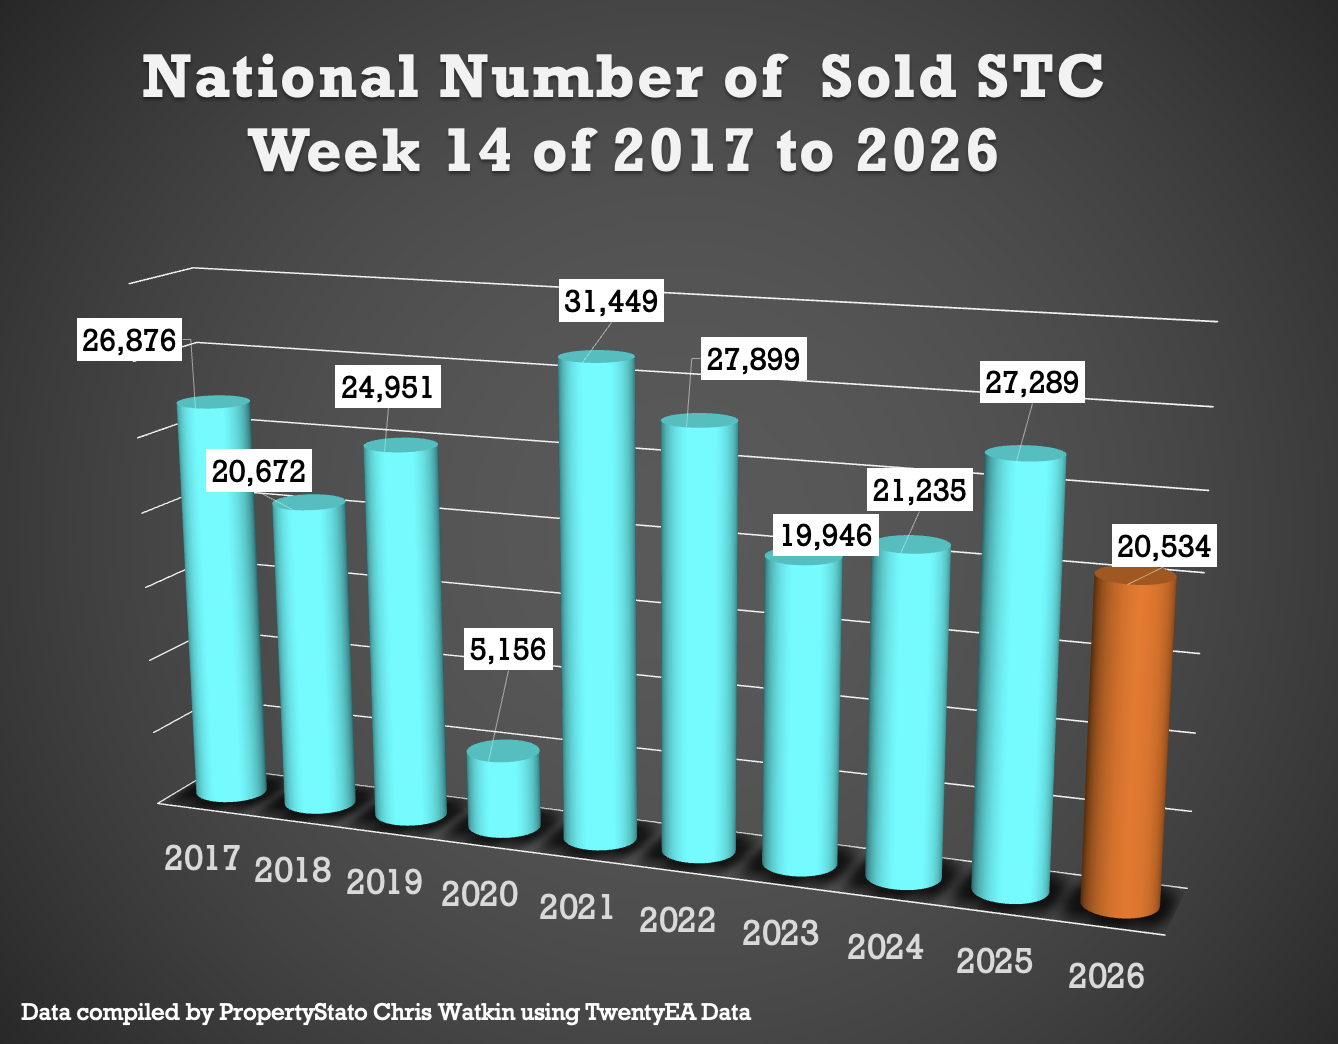
342k UK homes sold STC YTD.
7.6% lower than 2025 YTD (370k), 5.6% higher than 2024 YTD (324k), 15.1% higher than 2023 YTD (297k) and 12.9% higher above pre-Covid norms (303k).
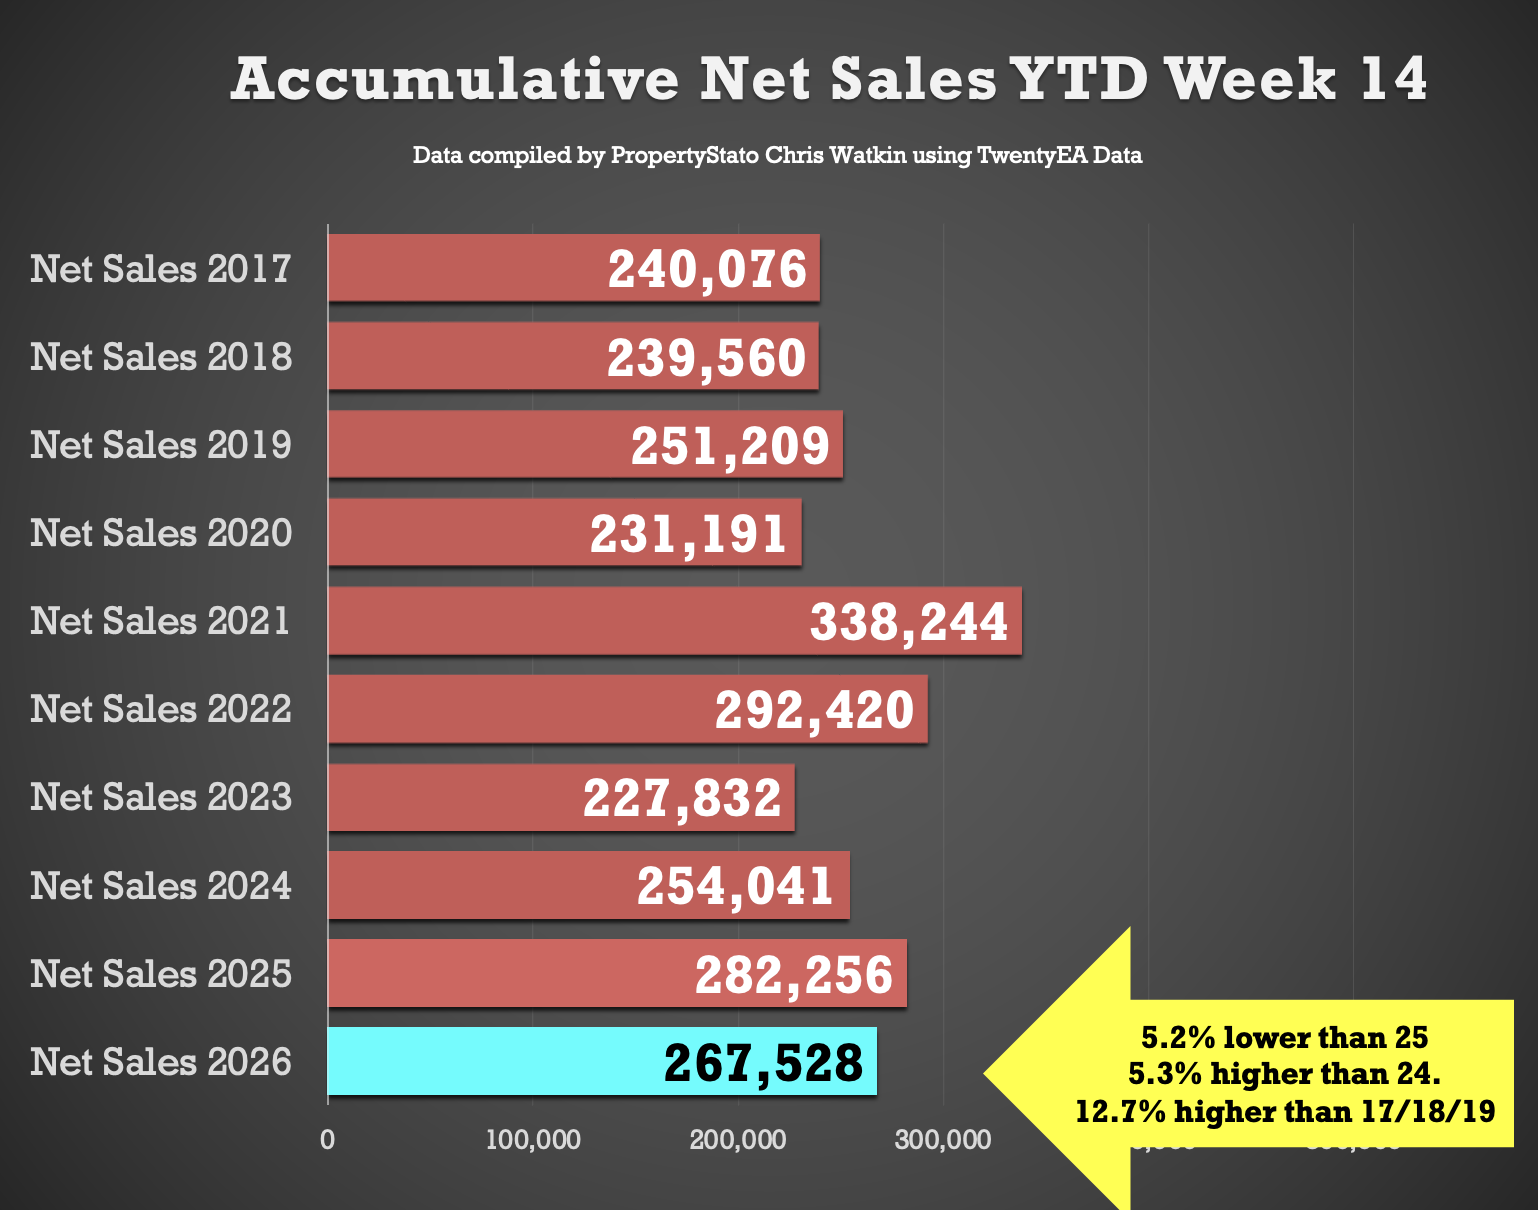
Net Resi Sales YTD
268k UK net home sales YTD (Net Sales being gross sales less fall-throughs).
5.2% lower than 2025 (282k), 5.3% ahead of 2024 (254k), 17.4% ahead of 2023 (228k) and 9.8% above the 2017–19 average (244k).
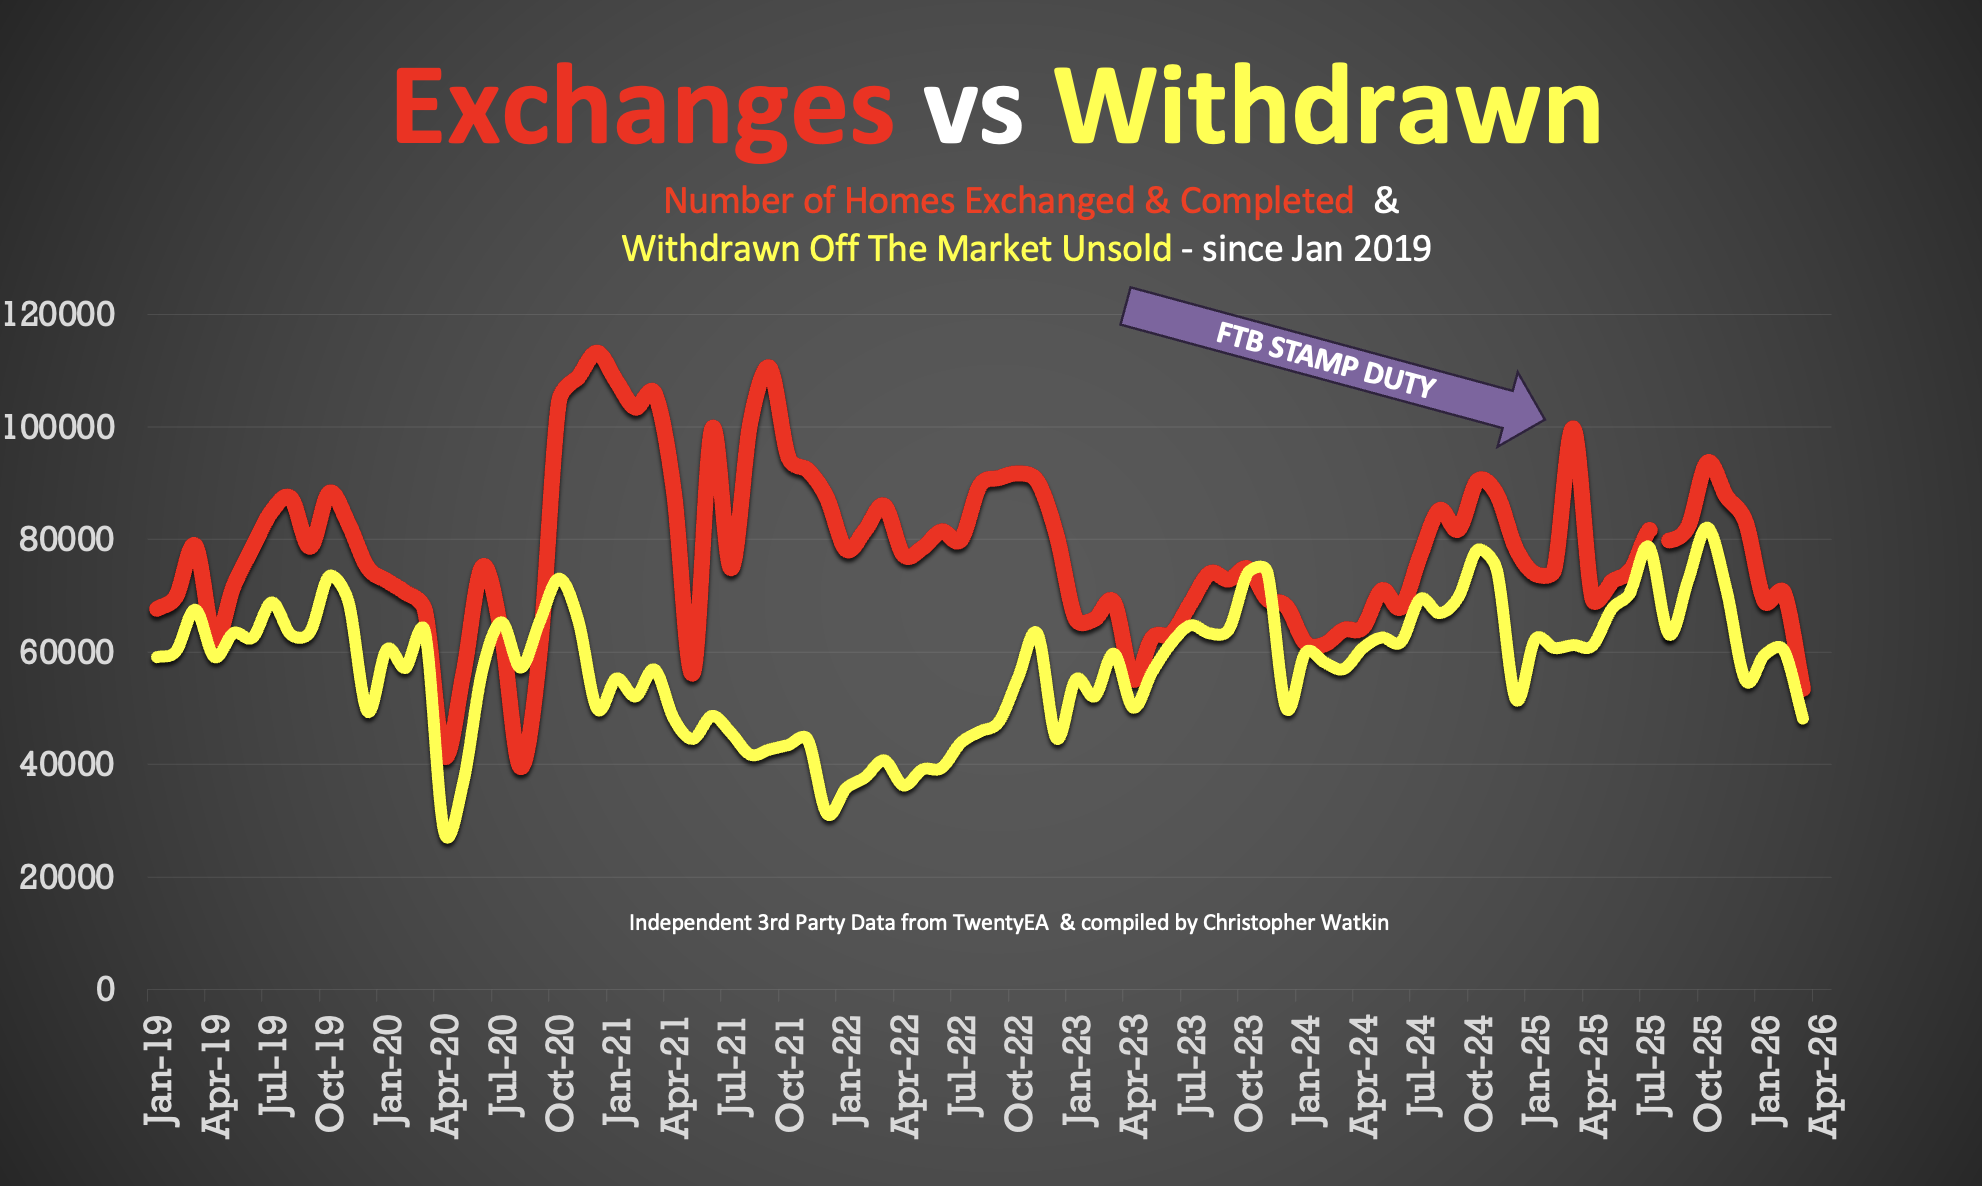
Exchanges YTD
190k UK exchanges to the 3rd week of March 2026.
9.5% lower than middle of March 2025, when it was 210k.
Note – there were more exchanges in Q1 2025 because of the stamp duty holiday finishing in April 2025.
Overvaluing
47.4% of the homes that left UK estate agents’ books in March were withdrawn unsold. Main cause – blatant overvaluing supported by long sole agency agreements of 20+ weeks.
Detailed Breakdown …
IMPORTANT NOTE – this was Easter week and historically most metrics drop around 10% to 15% compared to the month before.
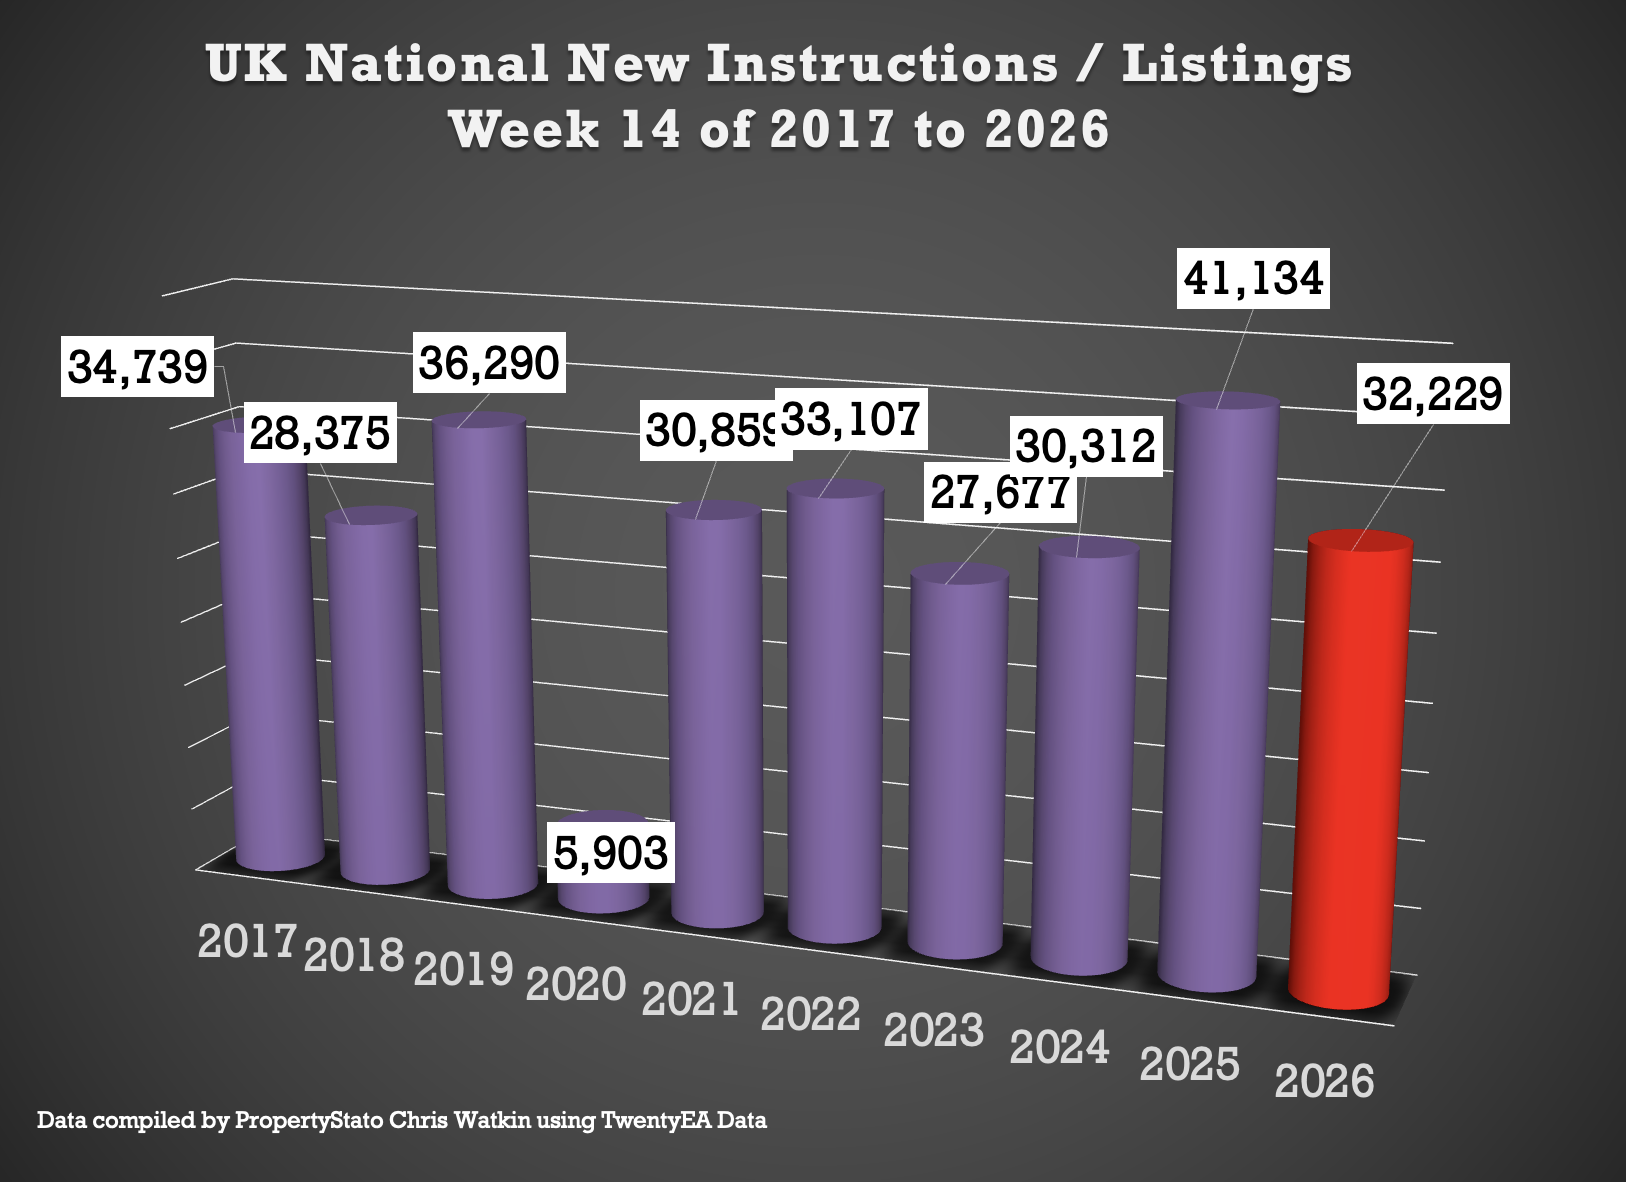
New Listings
- 32.2k new properties came onto market this week (week 14), down from 38.4k last week.
- 2025 weekly average: 30.6k.
- 10-year week 13 average: 30k.
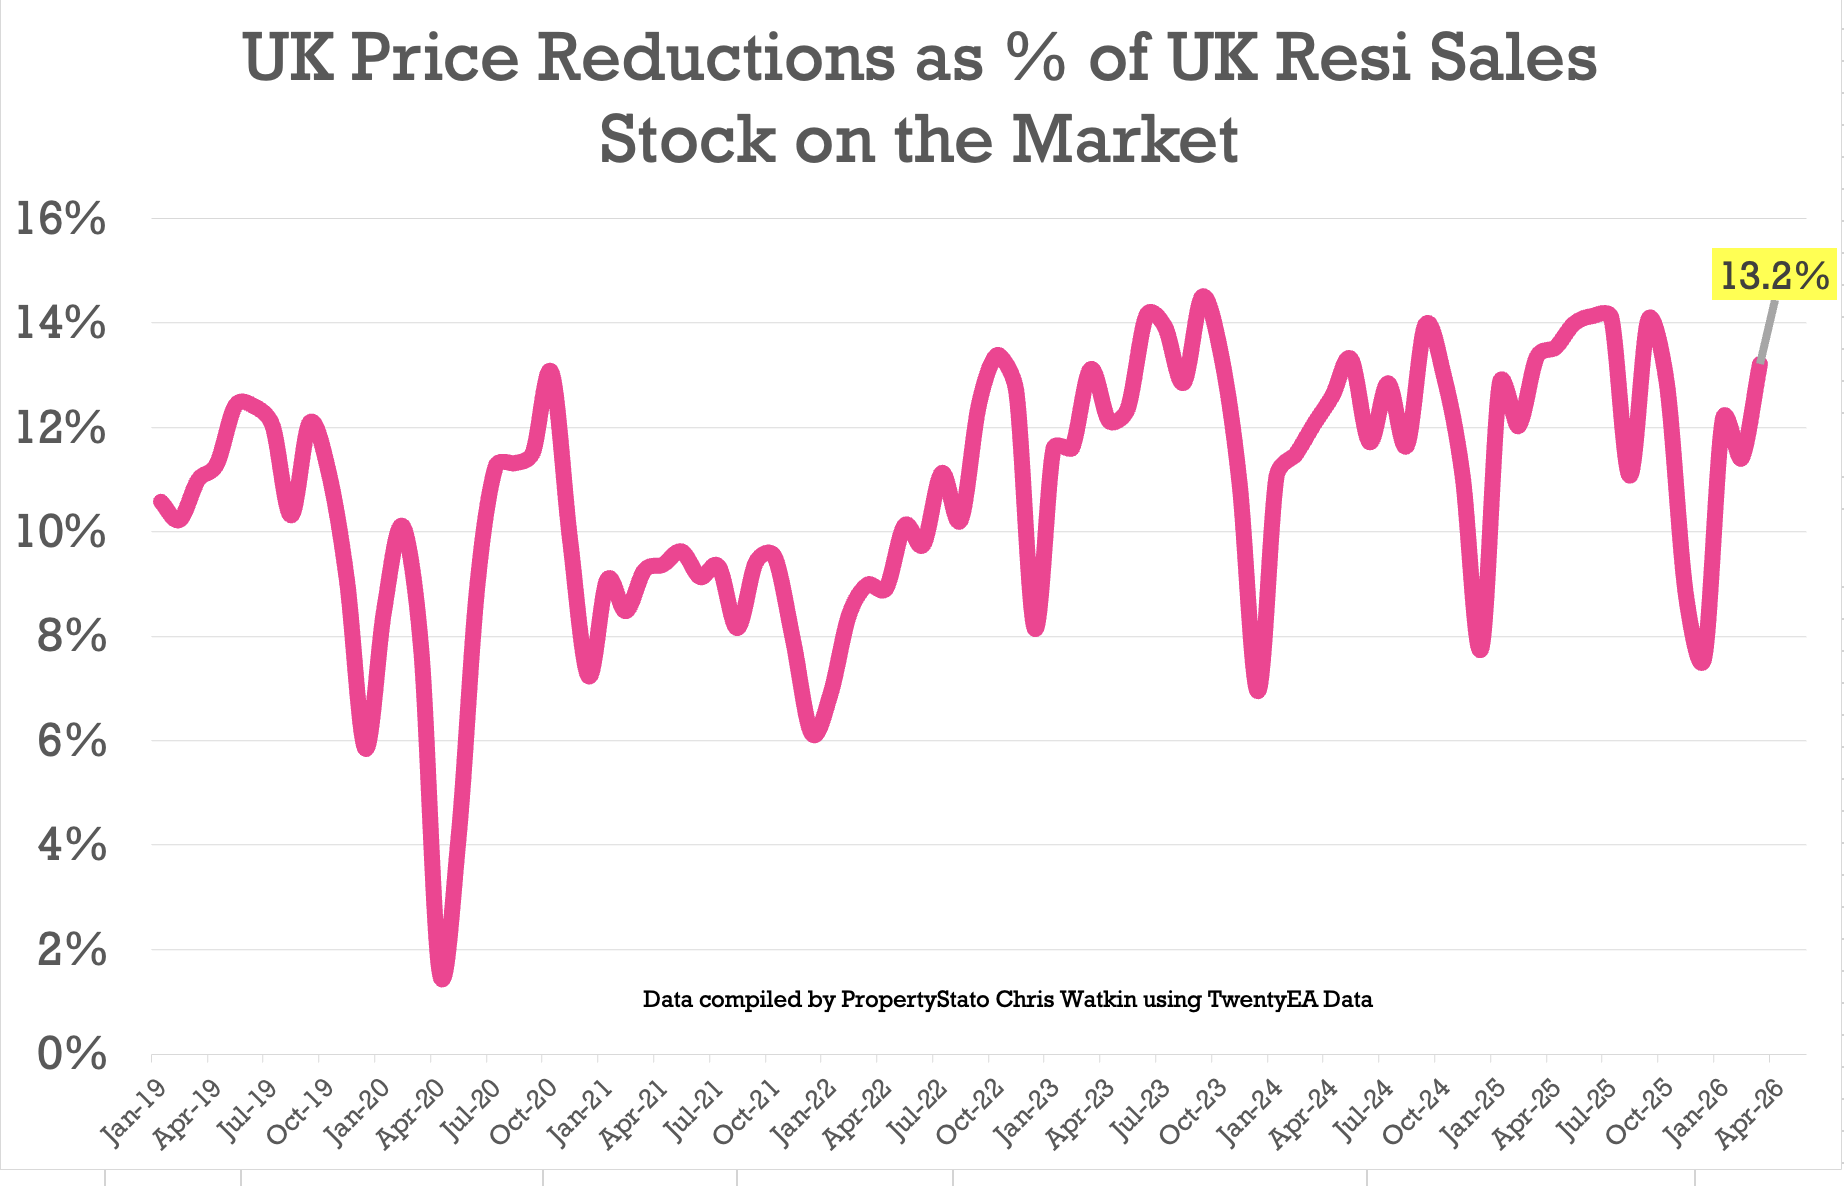
Price Reductions
- 20.5k reductions this week, down from 20k last week.
- 13.2% of resi homes for sale were reduced in March. Mar 25 – 13.4%. Mar 24 – 12.2%.
- 2025 average was 12.8%, versus the six-year long-term average of 10.7%.
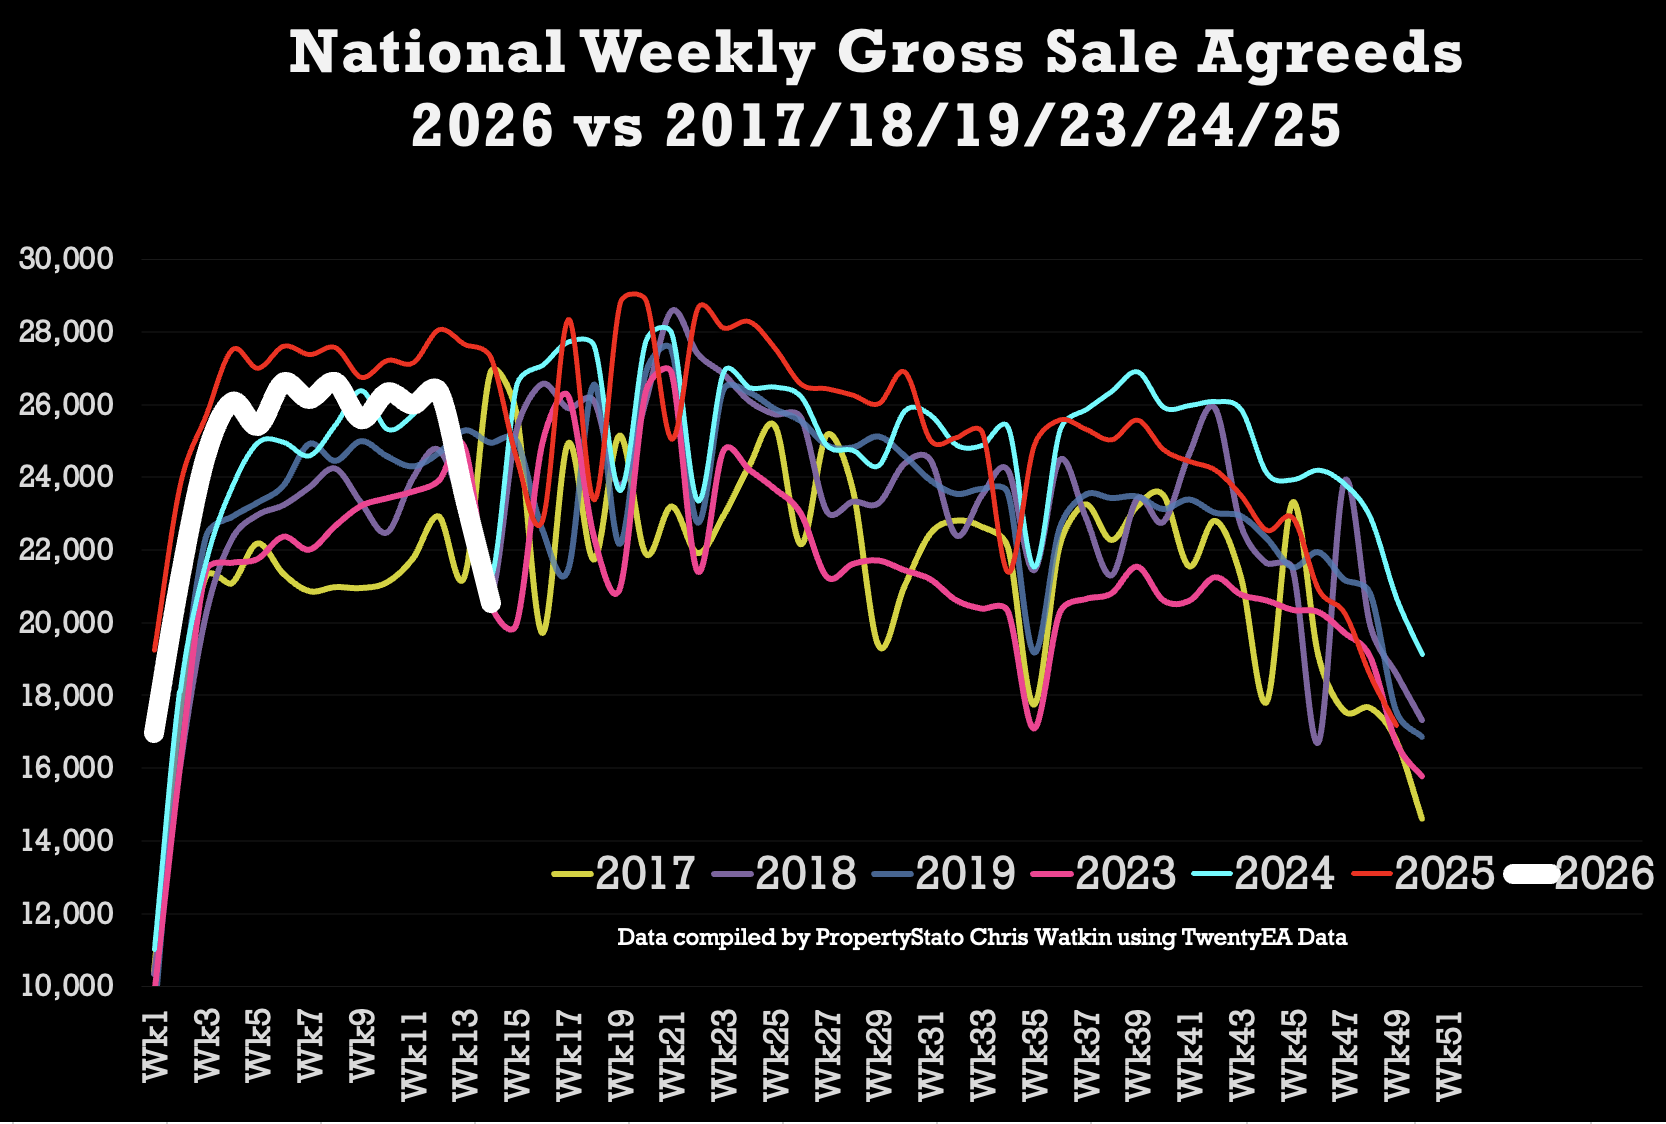
Sales Agreed
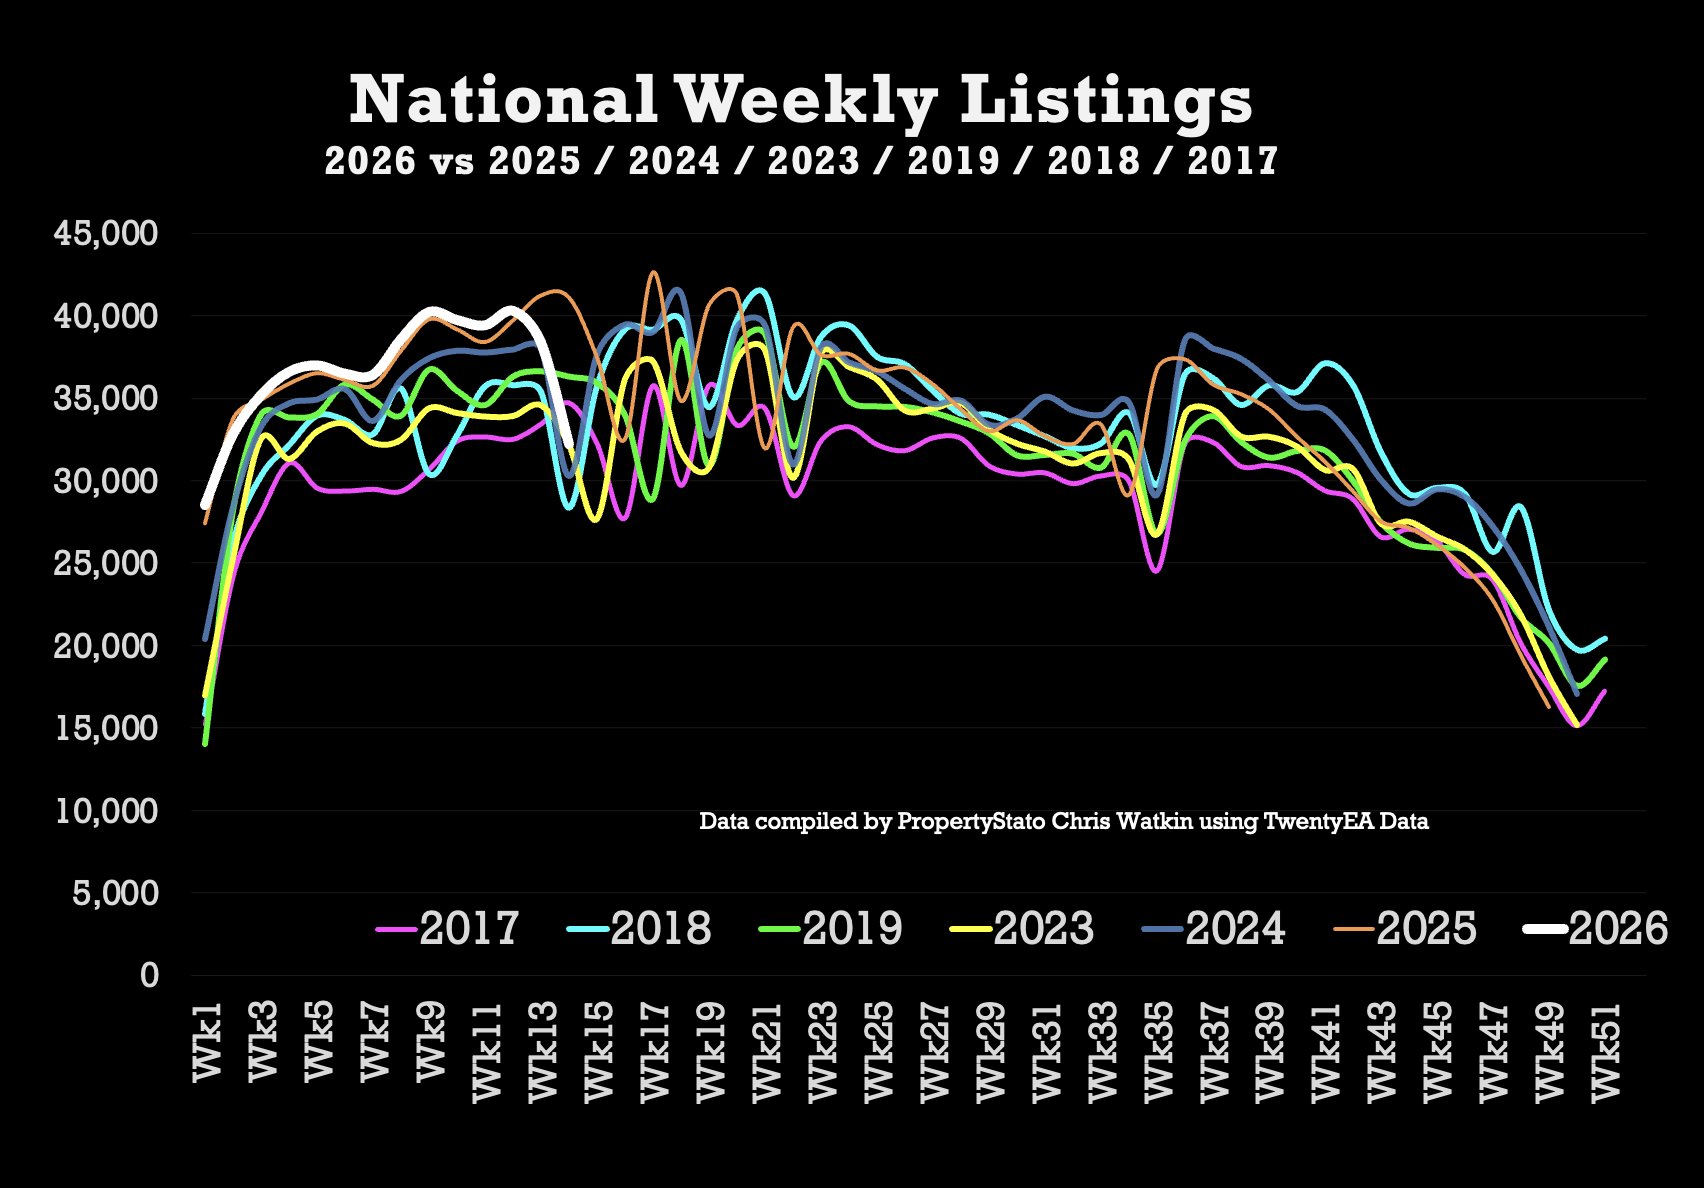
- 20.5k homes sold stc this week 14, down from 24k last week (remember its Easter – look at the graph – this always happens Easter week).
- Week 14 average (for the last ten years which includes the post pandemic boom): 22.6k.
- 2026 weekly average: 24.4k.
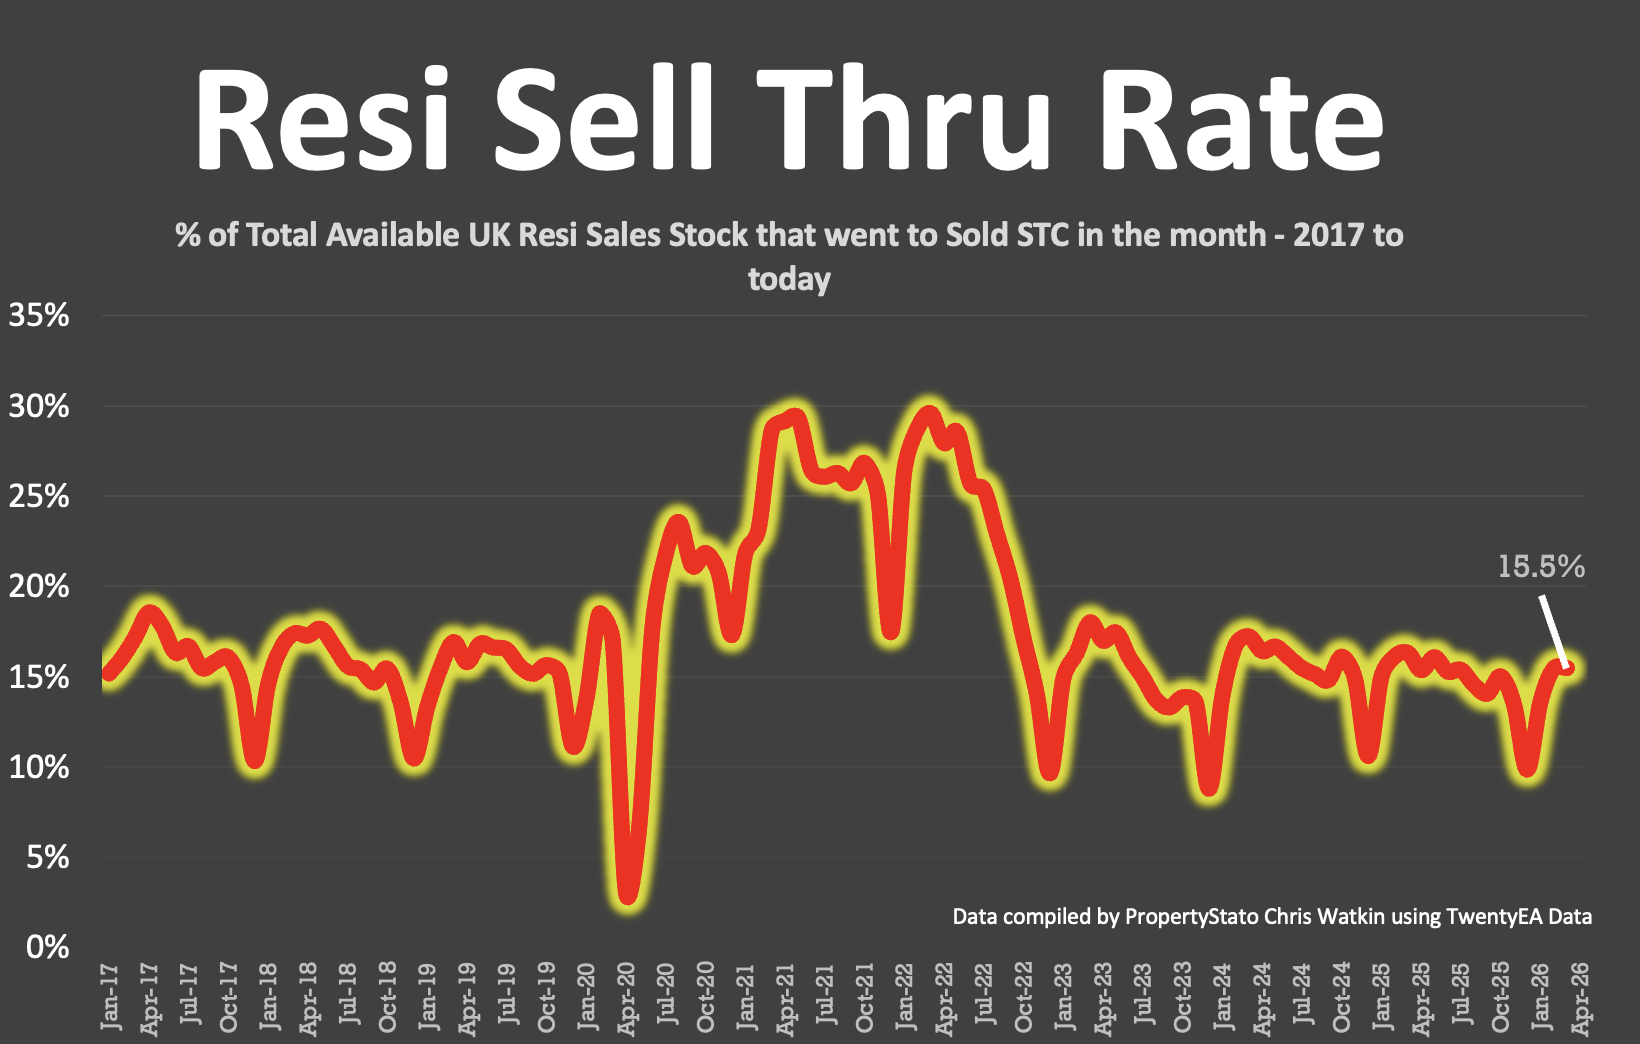
Sell-Through Rate
- 15.4% of homes on agents’ books went SSTC in February ’26. (Feb ’25 – 16.1% / Feb ’24 – 16.7%) – March figures to follow next month.
- Pre-Covid average: 15.5%.
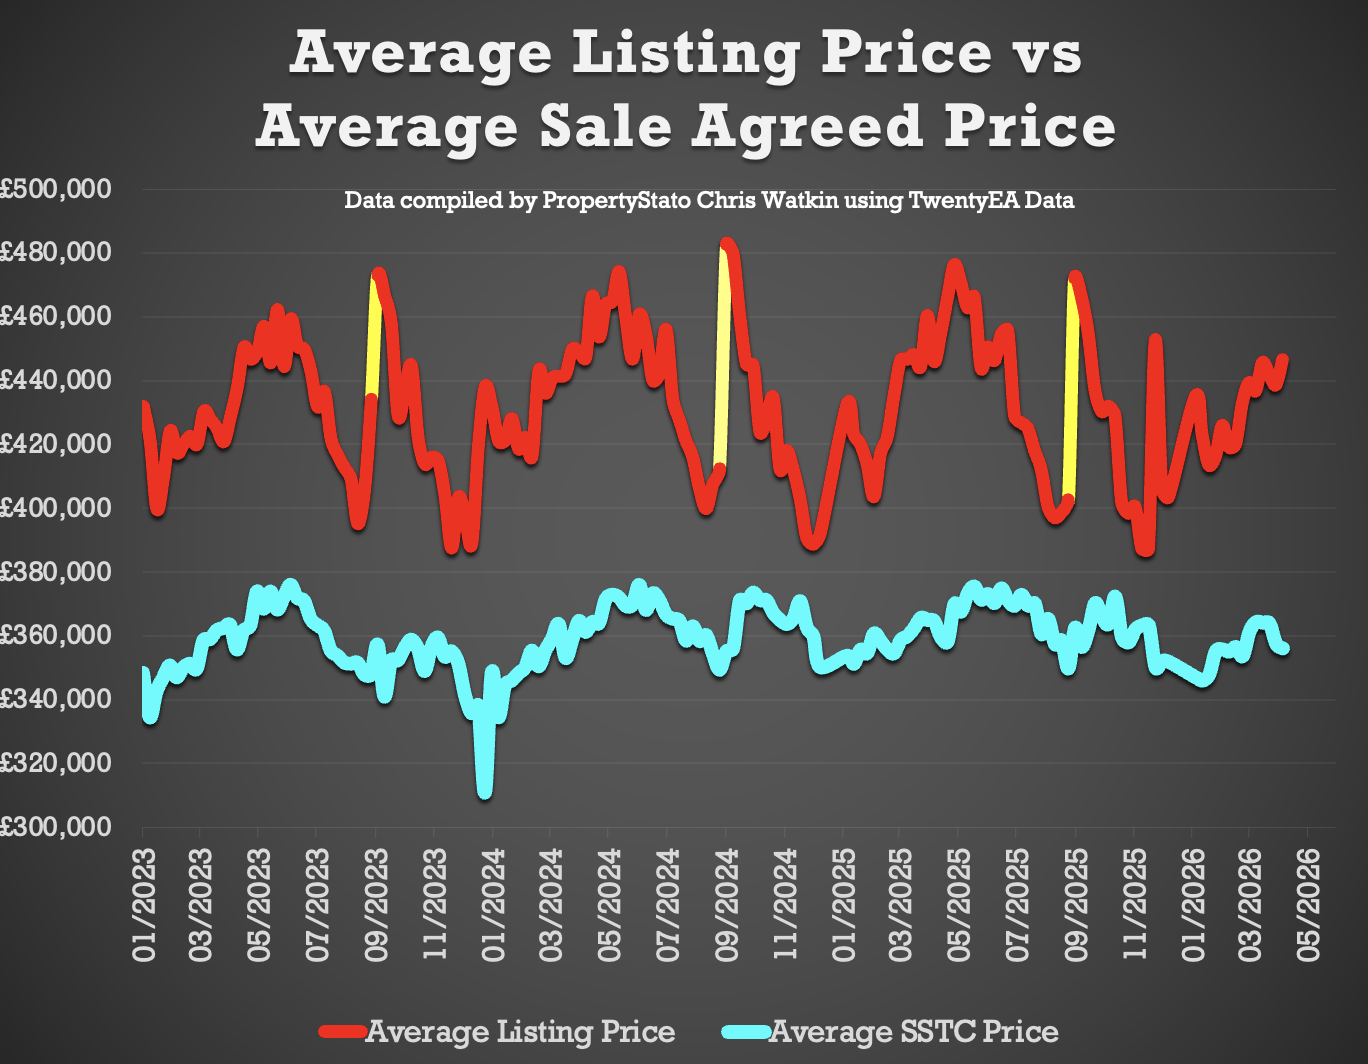
Price Difference between Listings & Sales
- 25.4% difference (long-term ten-year average is 16% to 17%). (£446k ave listing ave asking price vs £356k sale agreed ave asking price).
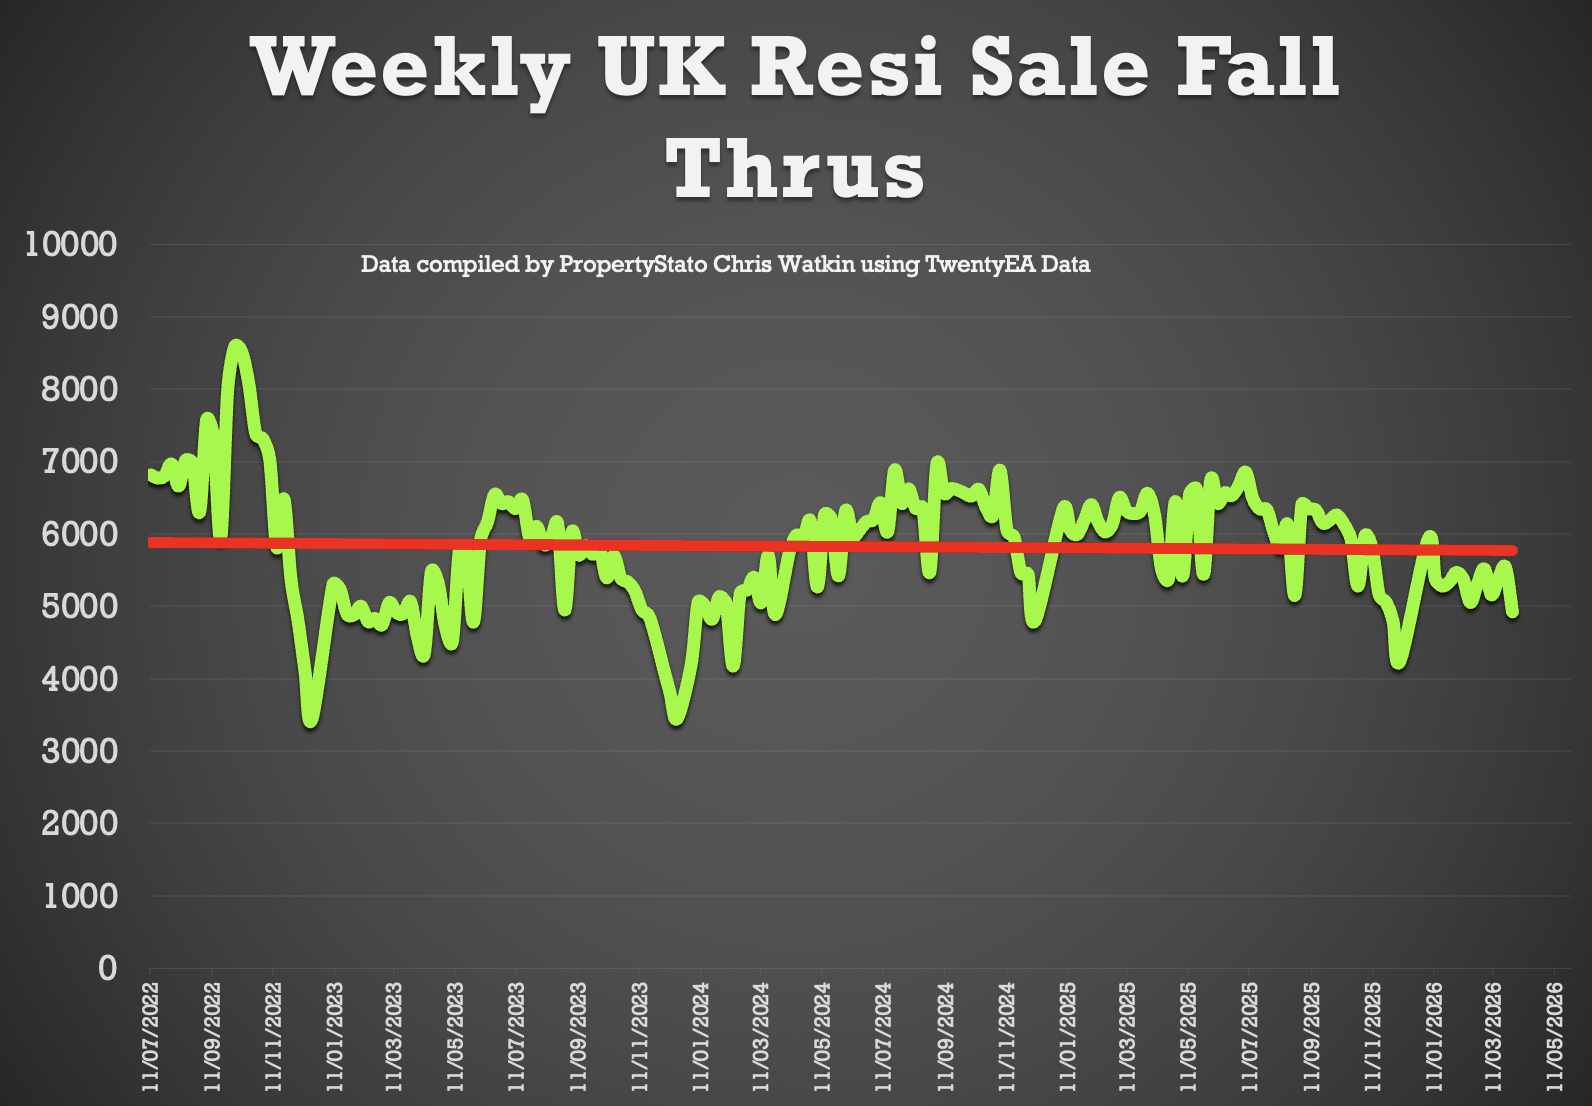
Fall-Throughs
- 4,613 fall-throughs last week (pipeline of 453k home sold STC).
- Weekly average of fall-throughs for 2025: 6.1k and 5.3k in 2026 YTD.
- Fall-through rate (fall-through expressed as a % of the gross sales that week): 22.5%, up from last week’s 21%.
- Long-term average: 24.2% (post-Truss chaos saw levels exceed 40%).
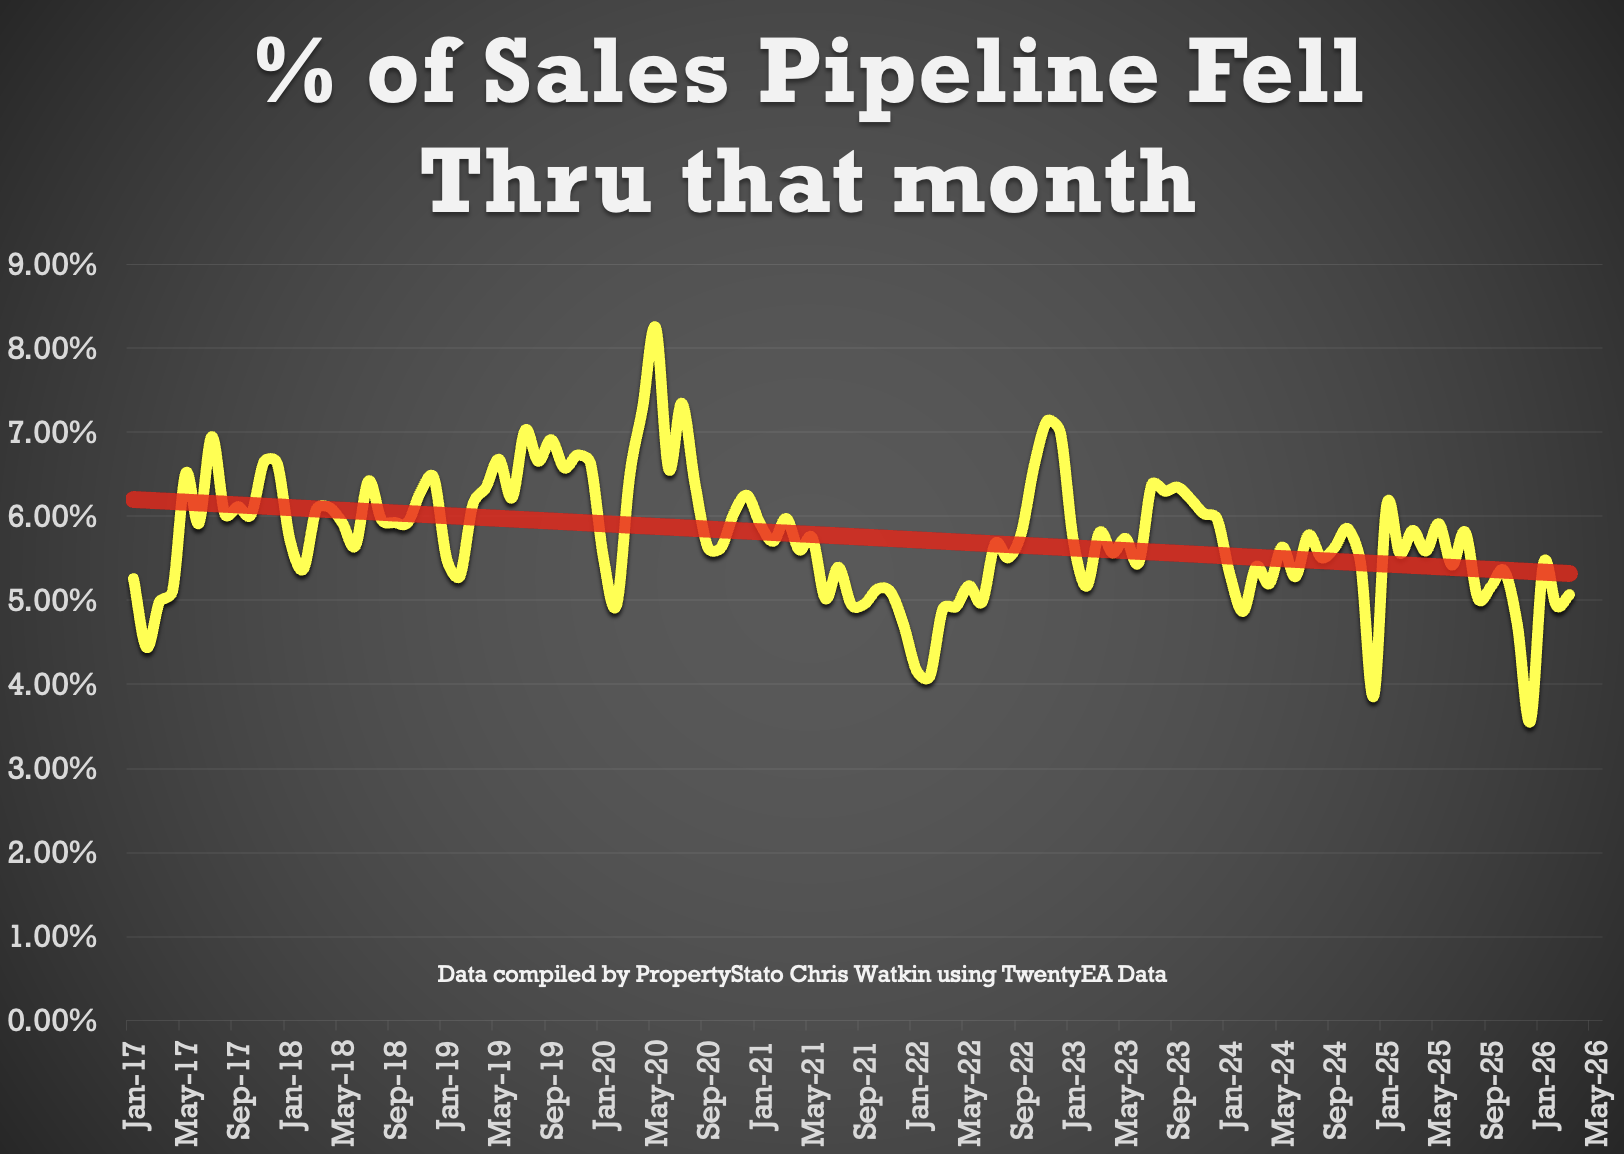
- 5.1% of all the sales agreed in estate agents’ sales pipelines fell through in March 2026. 2025 average – 5.3% & 10 year average – 5.8%).
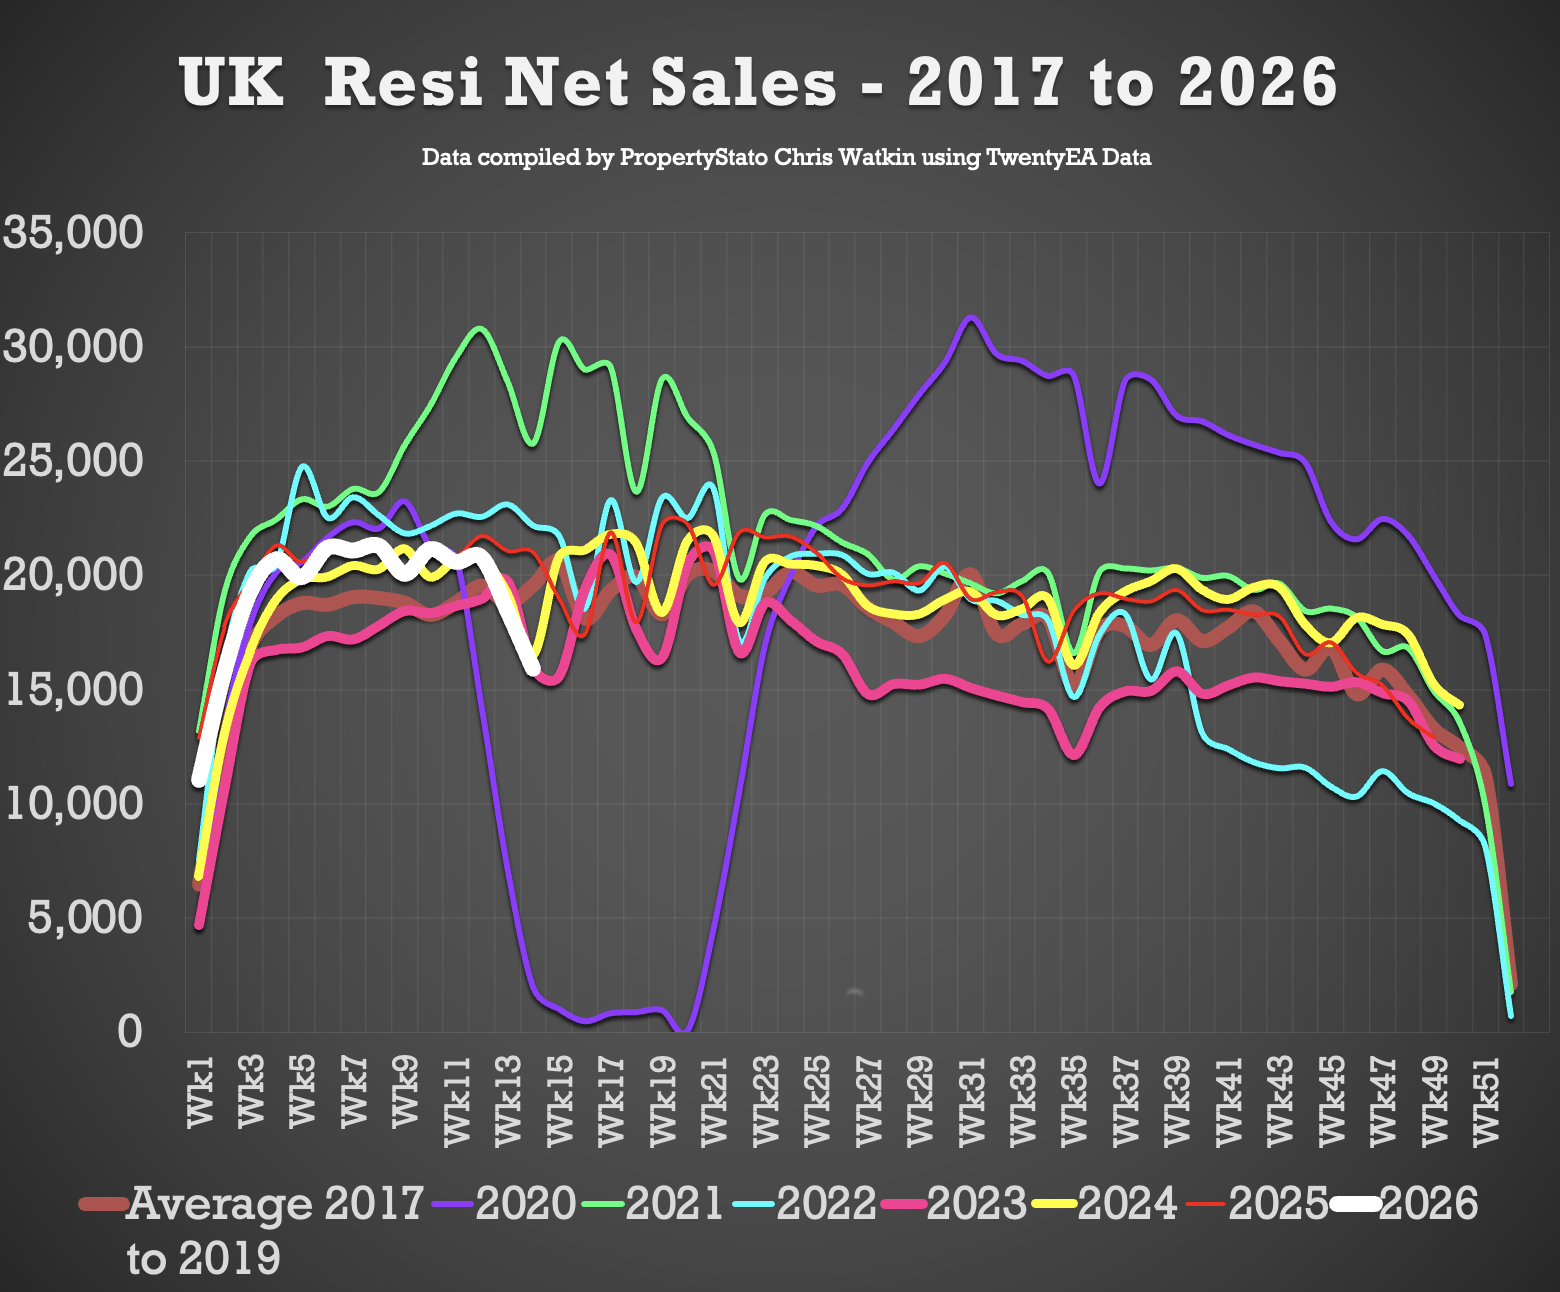
Net Sales
- 16k net sales, down from 18.5k last week.
- Ten-year week 14 average: 17.8k.
- Weekly average for 2026: 19.1k.
- Weekly average for the whole of 2025: 18.8k.
Probability of Selling (% that Exchange vs withdrawal)
- March ’26 Stats: 52.6% of homes that left agents’ books exchanged & completed in March. (Note this figure will change throughout the month as more March stats come in.)
- 57.6% is the seven-year average (which includes the crazy years post lockdown 18 months).

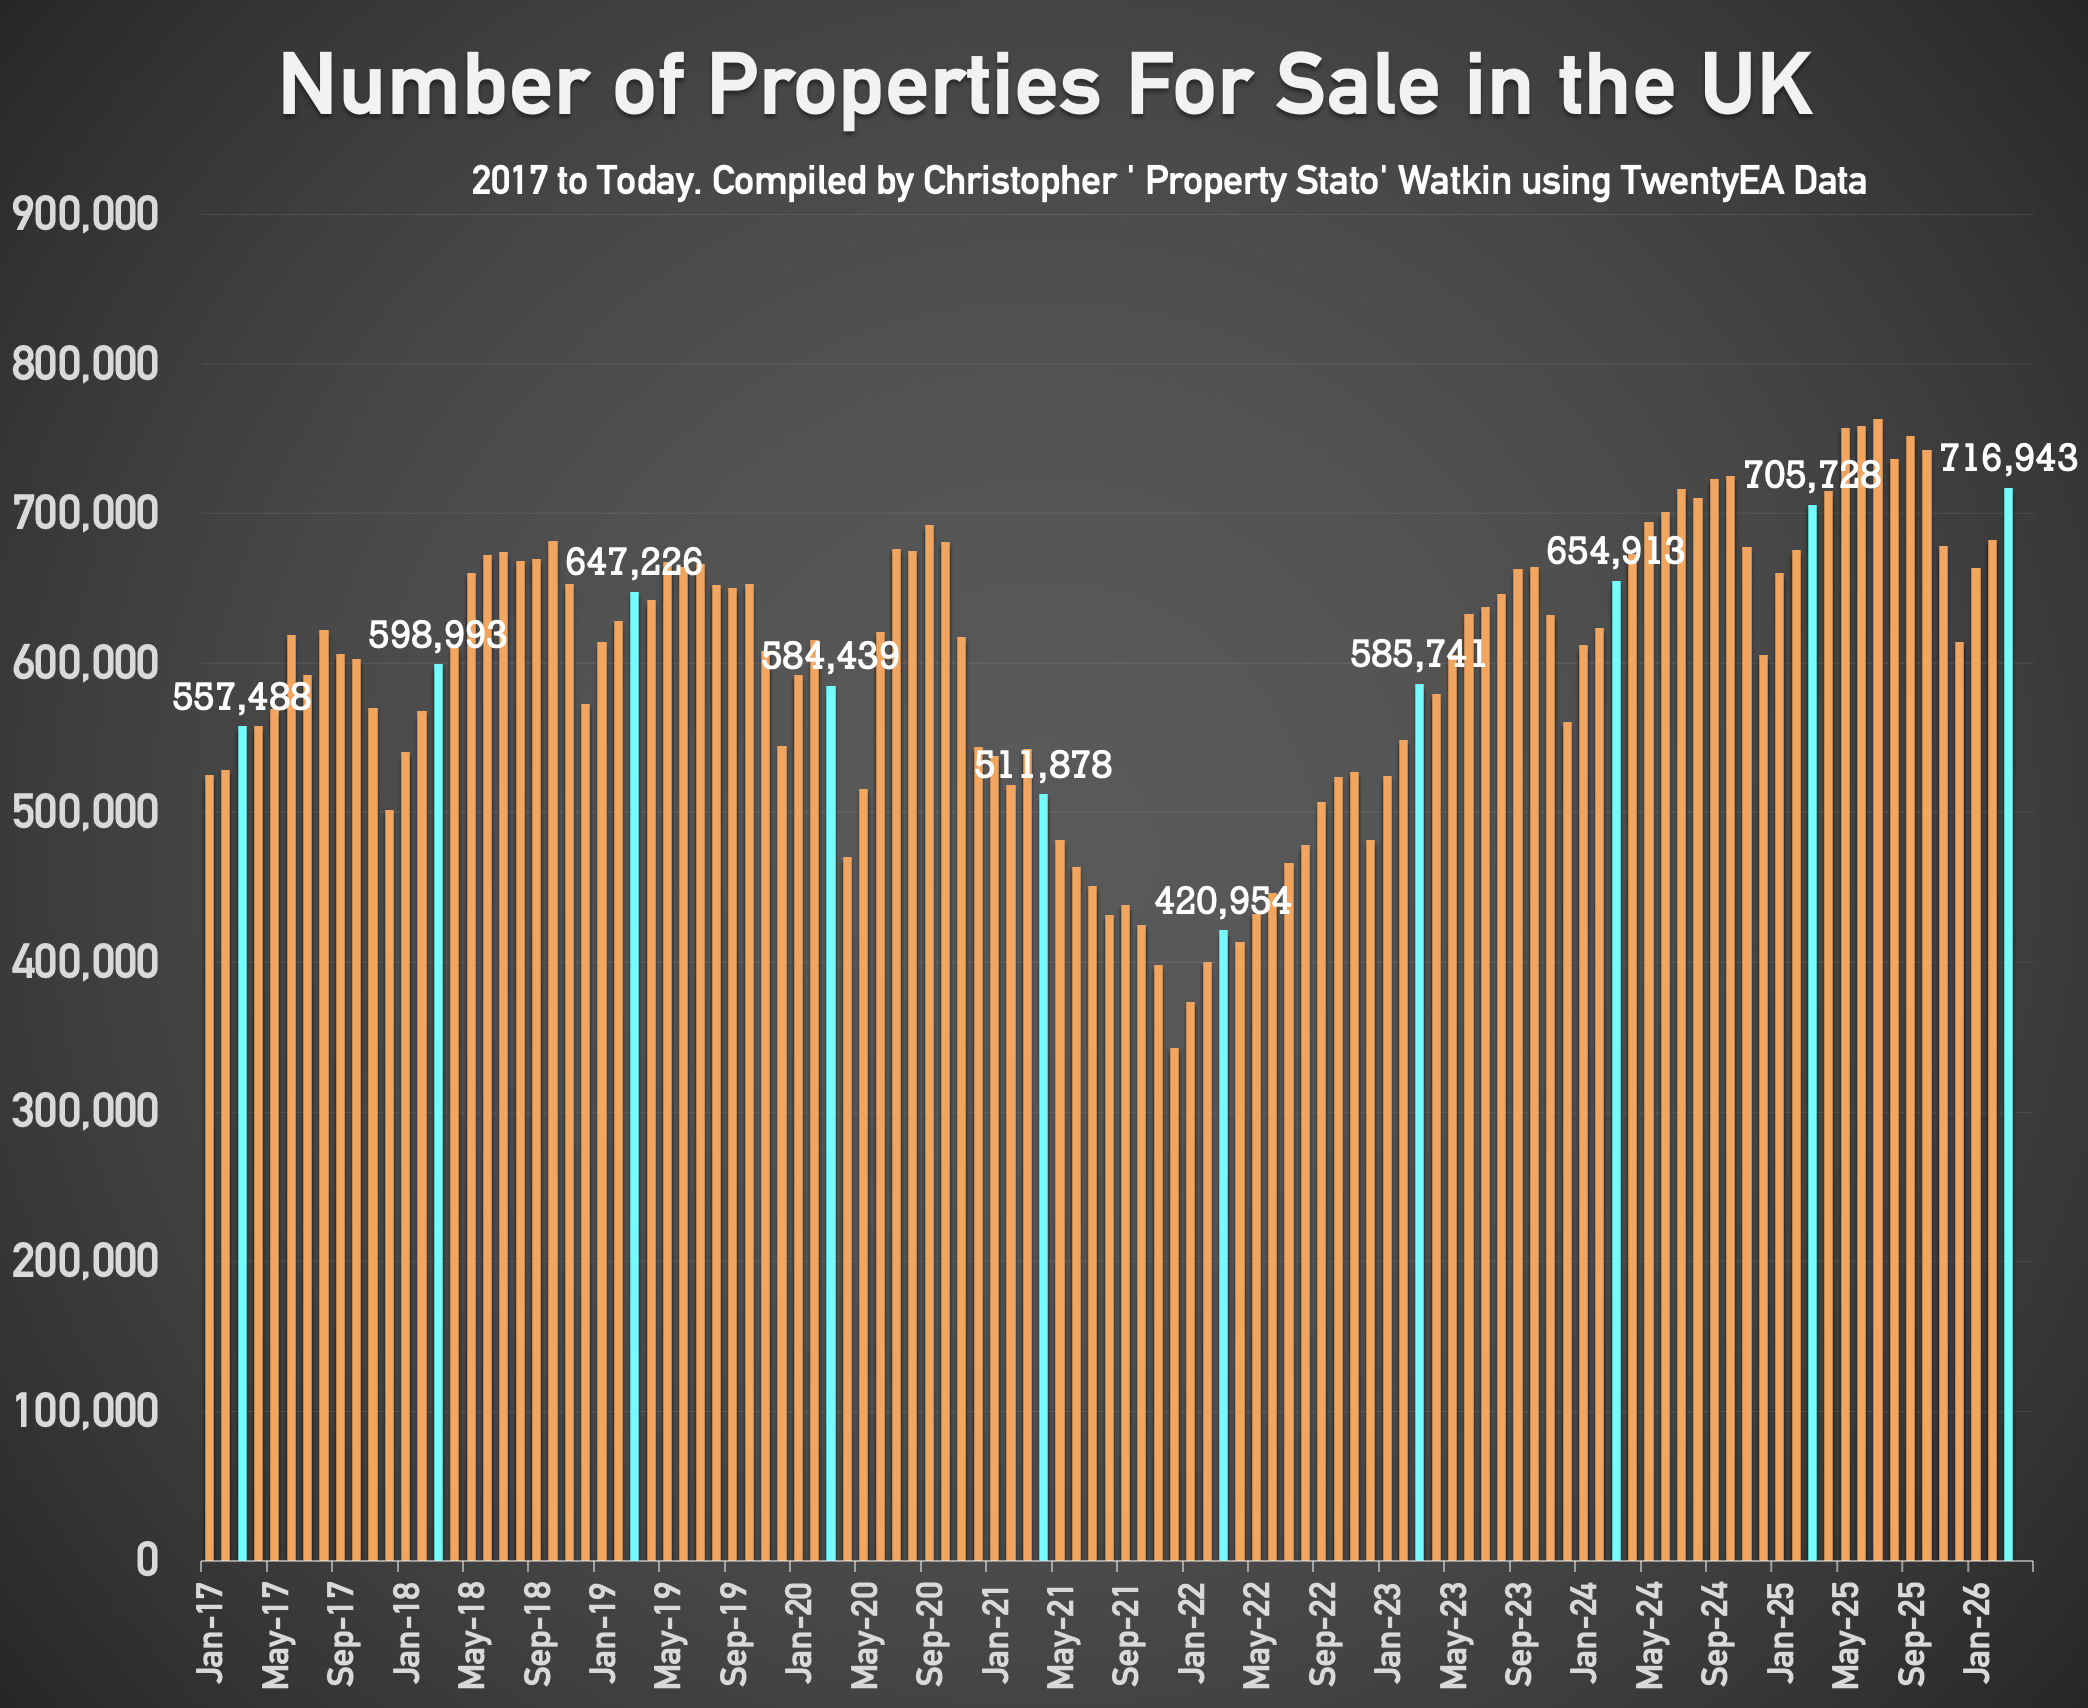
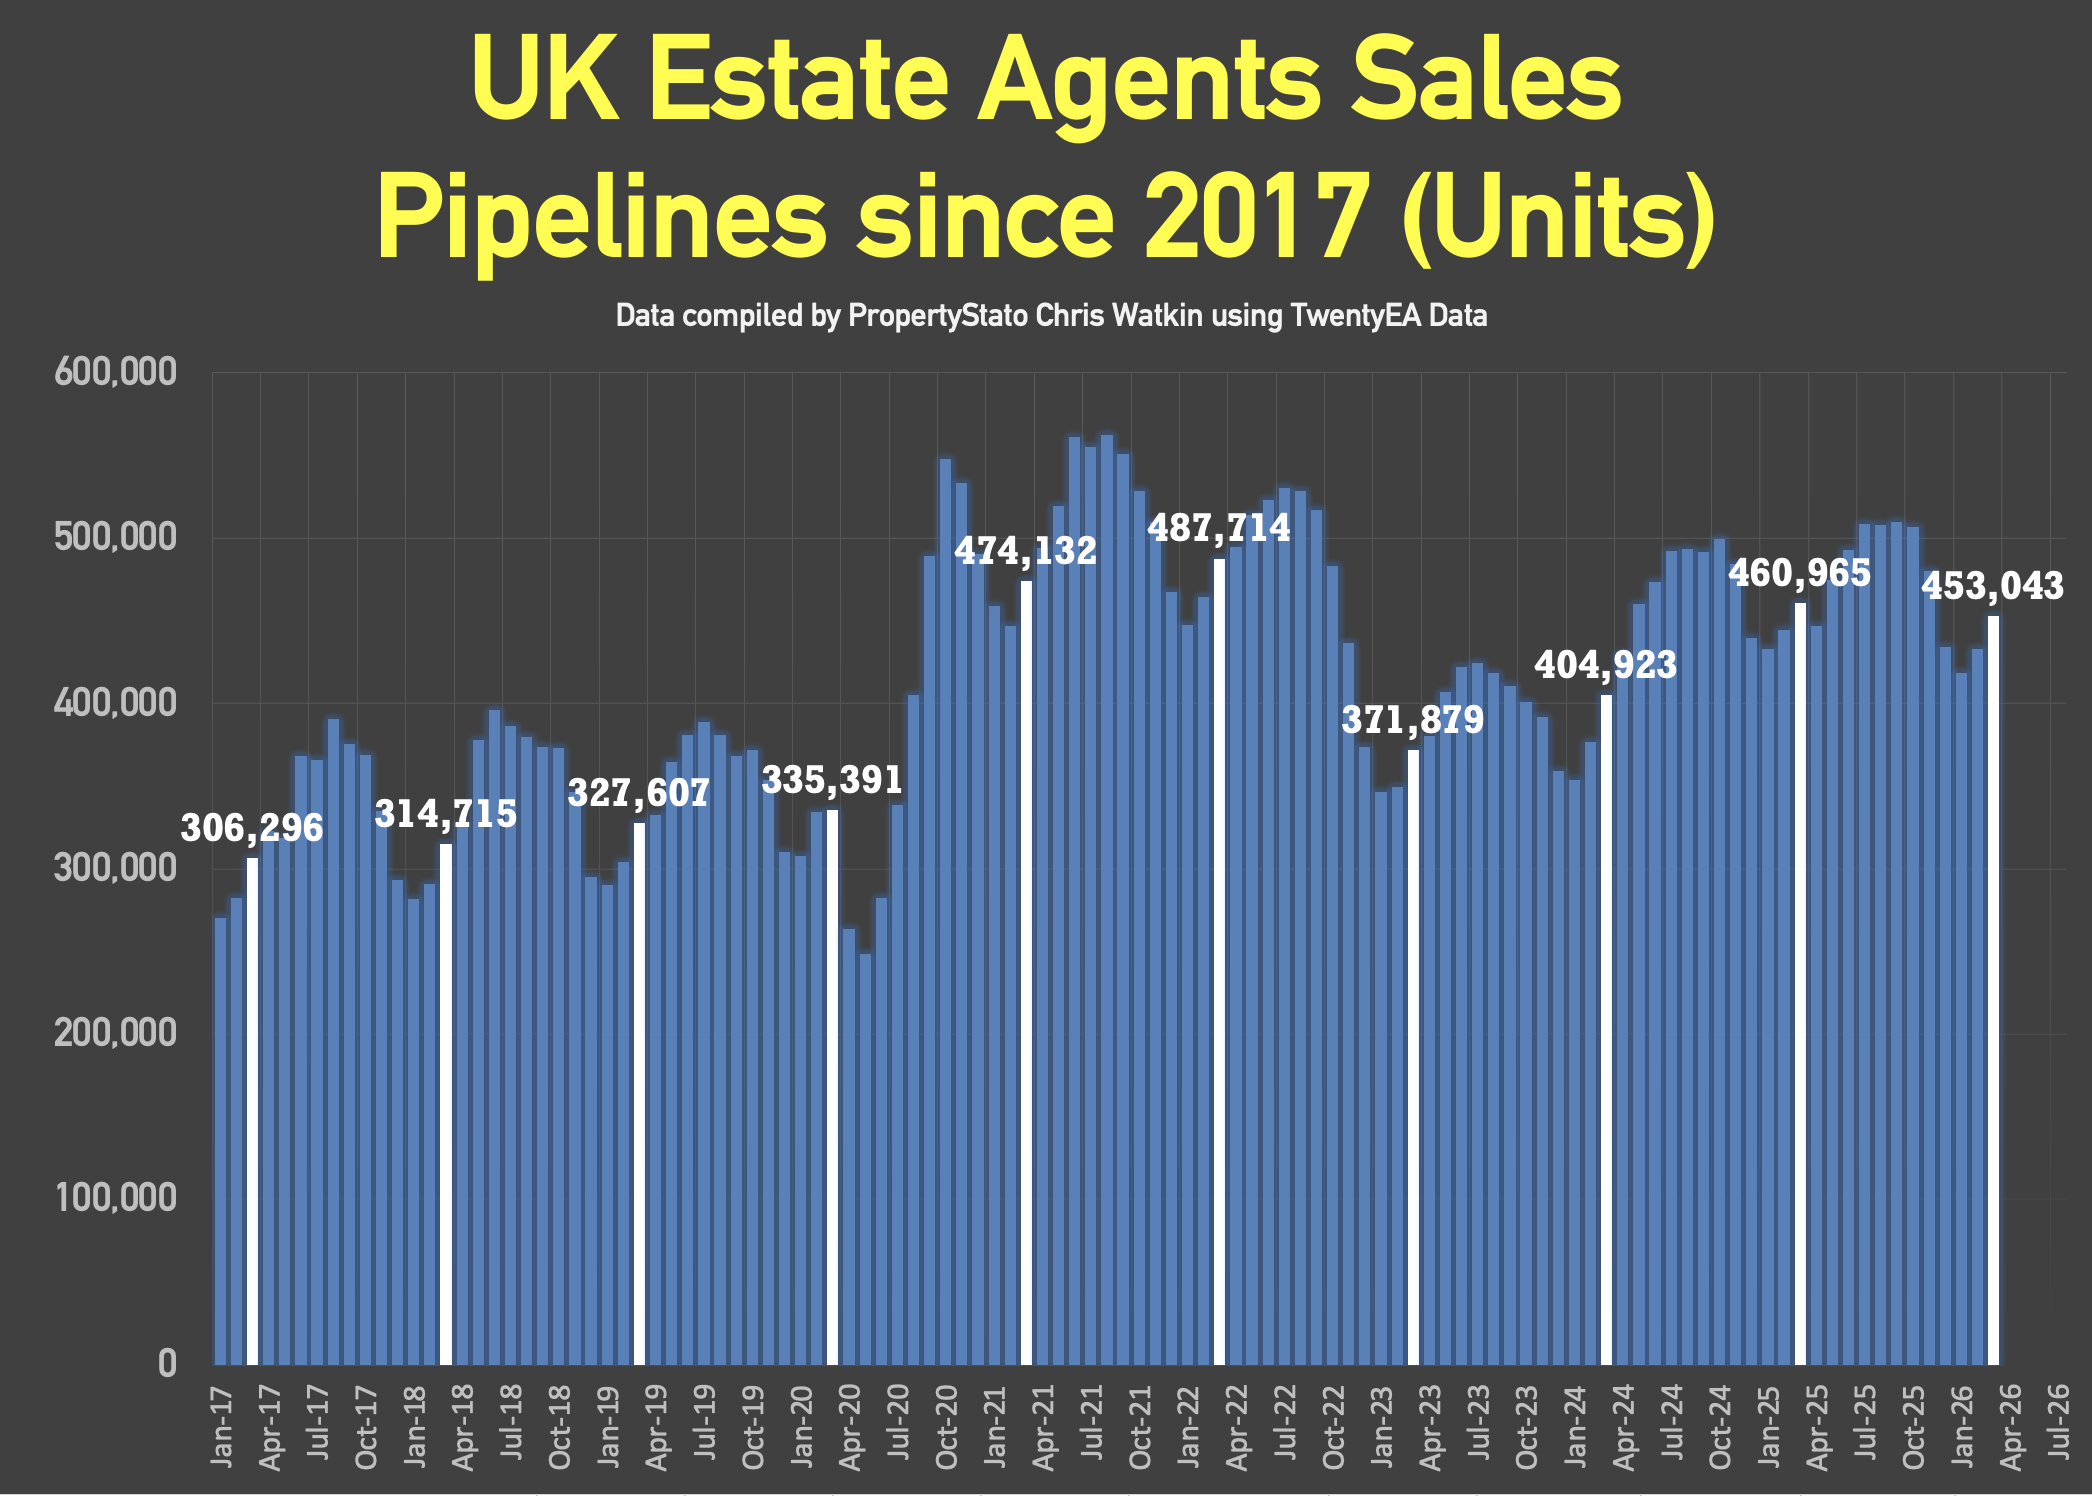
Stock Levels
- 717k homes on the market on the 1st of April ’26. (706k – 1st April 25).
- 453k homes in agent’s sales pipeline on 1 April 2026, slightly lower than 12 months ago on 1 April ’25 (461k).
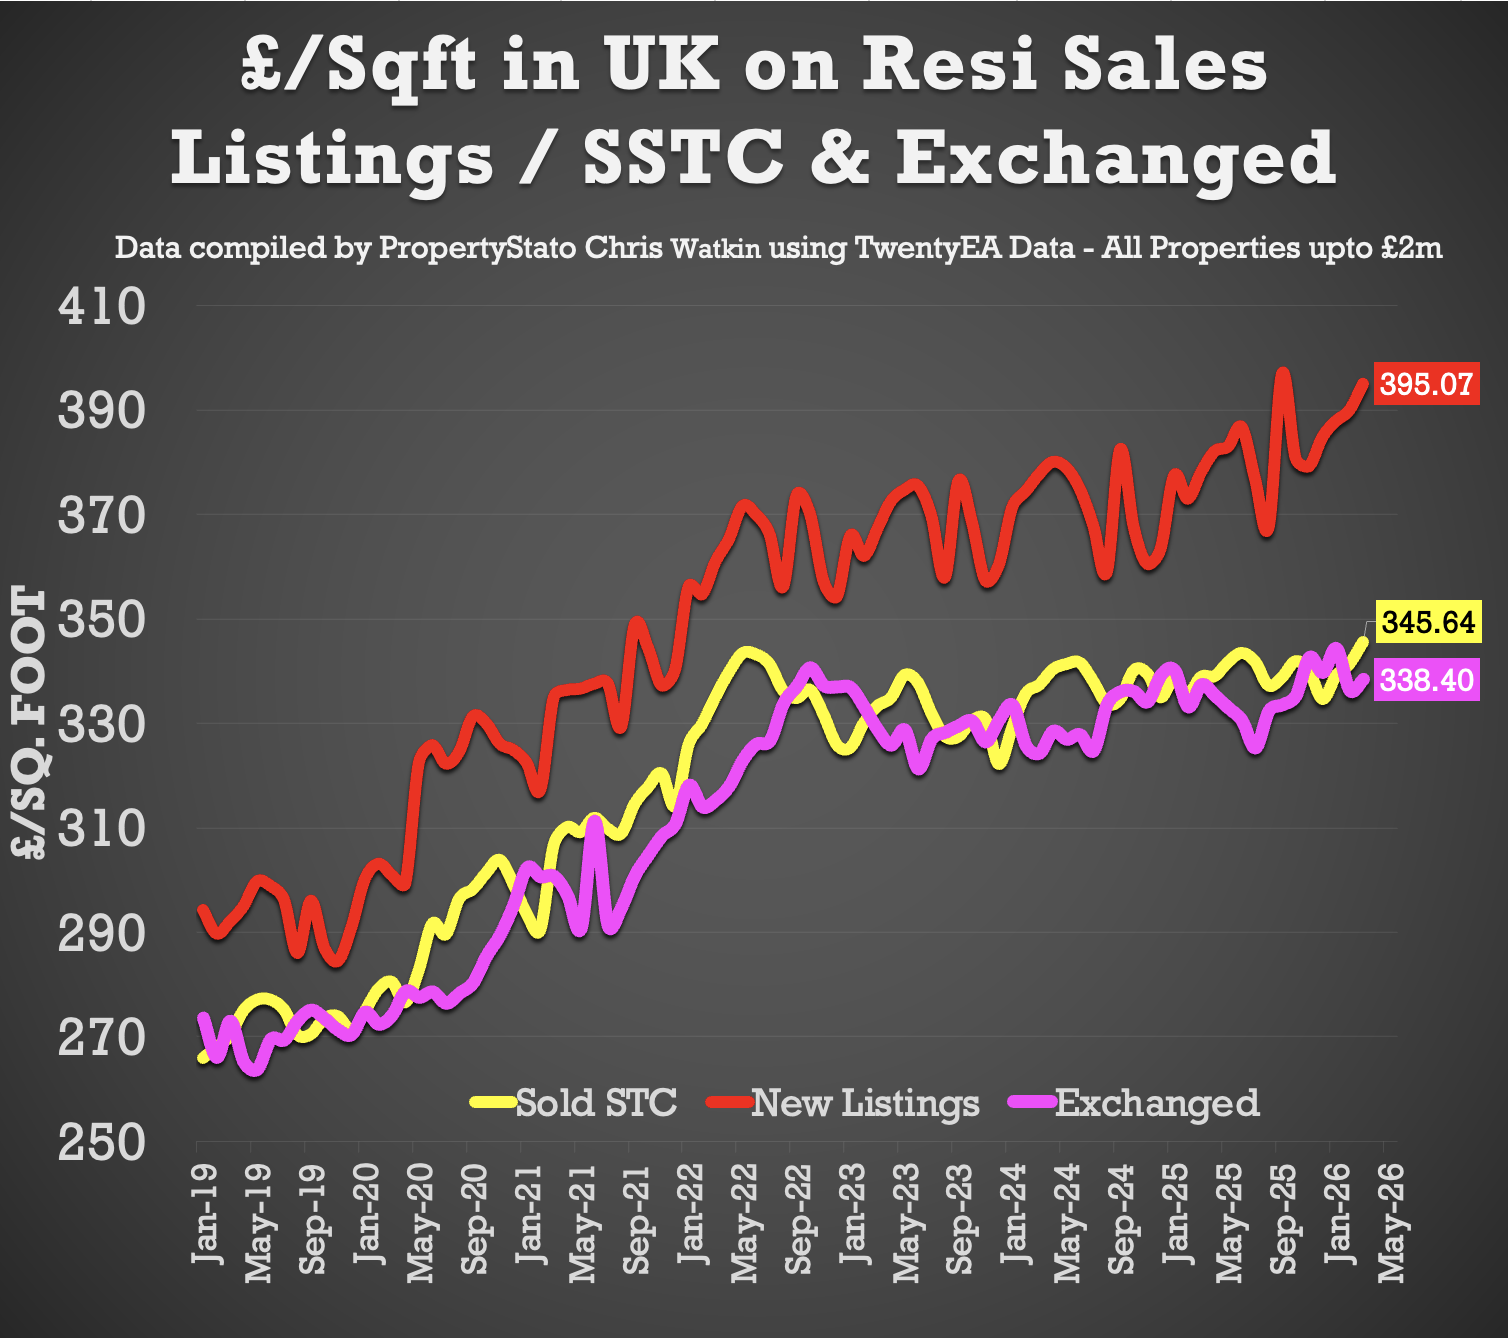
House Prices (£/sq.ft)
- March ’26 agreed sales averaged £345.64 per sq.ft. 2% higher than 12 months ago (£338.97) and 12.7% than five years ago (£306.76). The £/sqft at sale agreed matches the HM Land Registry Index with a 98% accuracy, five months in advance. That is why it is so important.
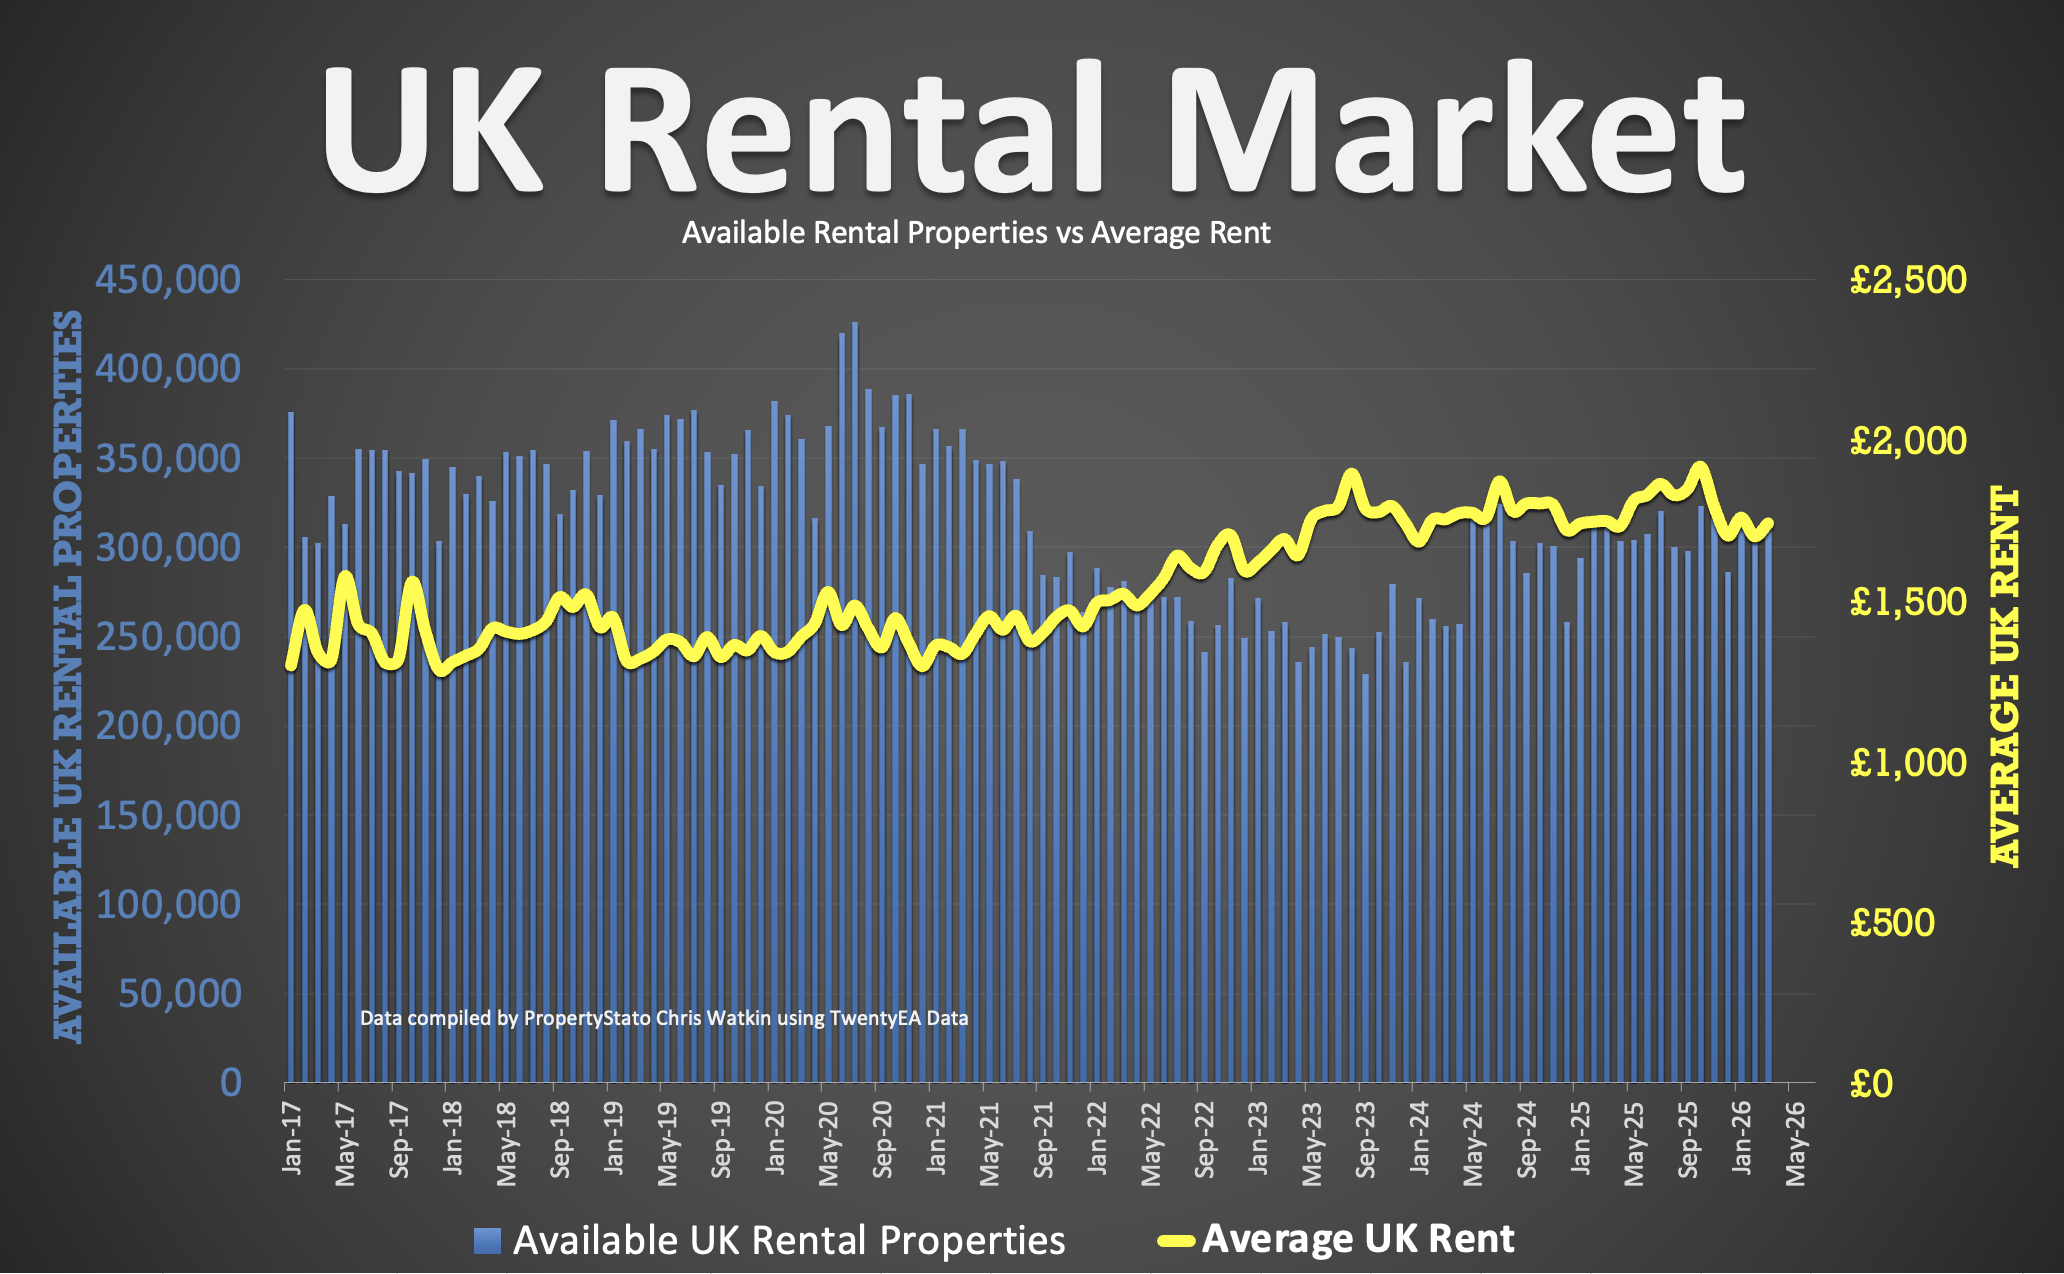
UK Rental Data
- Average rent in March 2026 – £1,740 pcm (£1,747 in March 25).
- 312k UK rental stock available to rent in March ‘26 (313k in March 2025).
Local Focus
Slough
Read the orginal article: https://propertyindustryeye.com/what-is-currently-happening-in-the-uk-property-market-91/?utm_source=rss&utm_medium=rss&utm_campaign=what-is-currently-happening-in-the-uk-property-market-91


