

The Indian rupee hit an all-time low of 95.33 to a dollar earlier on Thursday (April 30). It means that when trading international currencies, buying a single US dollar requires 95.33 rupees.
At the start of 2026, a dollar could be exchanged for 90 rupees, and a year ago for less than 85. In other words, there has been a sharp slide in the value of the rupee relative to the US dollar — a fall of 12% in just the past 12 months.
For perspective, while it is true that the rupee loses value to the dollar every year, the slide is only about 3% to 4% over 12 months. Such a sharp decline is reminiscent of September 2013, when the rupee lost 12% of its value against the dollar just between January and September.
‘Fragile Five’ economies
At that time, Morgan Stanley, a leading global investment firm, had dubbed the Indian rupee (or INR) one of the fragile five currencies in emerging markets. The other four were:
1. The Indonesian rupiah or IDR (which had fallen 15.4% against the dollar),
2. The Brazilian real or BRL (which fell 7.6%),
3. The South African rand or ZAR (which fell 14.4%), and
4. The Turkish lira or TRY (which slid 9.9%).
These currencies were losing value because the US central bank had signalled a rollback of its quantitative easing (or QE) policy.
QE essentially means money can be borrowed cheaply because a central bank prints lots of it. When investors can borrow in US dollars at almost zero interest rates, it makes sense for them to borrow in dollars and invest in economies across the world that promise high growth and returns. But when the policy stopped, it signalled that interest rates in the US were set to rise because the tap of printing fresh money had been turned off.
Story continues below this ad
Most investors pulled back money from emerging markets to invest in US bonds. A US government bond is essentially loaning money to the US government and thus works as the most risk-free investment.
But India, Indonesia, Brazil, South Africa and Turkey were the worst affected for another key reason: these economies already ran a current account deficit (meaning that as they traded goods and services with the rest of the world, more money went out than came in). They could run such a current account deficit only because they had a capital account surplus (meaning in terms of investments — foreign direct investment and investments in their stock markets — more money came in than what went out).
But with QE rollback, the investment flows reversed, and that created a situation where the relative demand of these currencies against the US dollar crashed. Since exchange rates are essentially driven by the relative demand of any two currencies, these five currencies lost value against the dollar.
How similar is 2026 to the fragile fives of 2013?
One of the biggest claims from the incumbent BJP-led NDA government has been turning the economy around from one of the fragile five to one of the top five economies in the world (in terms of GDP size). A couple of weeks ago, however, India slid to the sixth rank.
Story continues below this ad
On the fragility of the currencies, CHART 1 shows how each of the fragile five has fared against the US dollar over the past 12 months. Any movement below the 0% horizontal line means the dollar has weakened, and any movement above means the dollar has strengthened against the relevant currency.
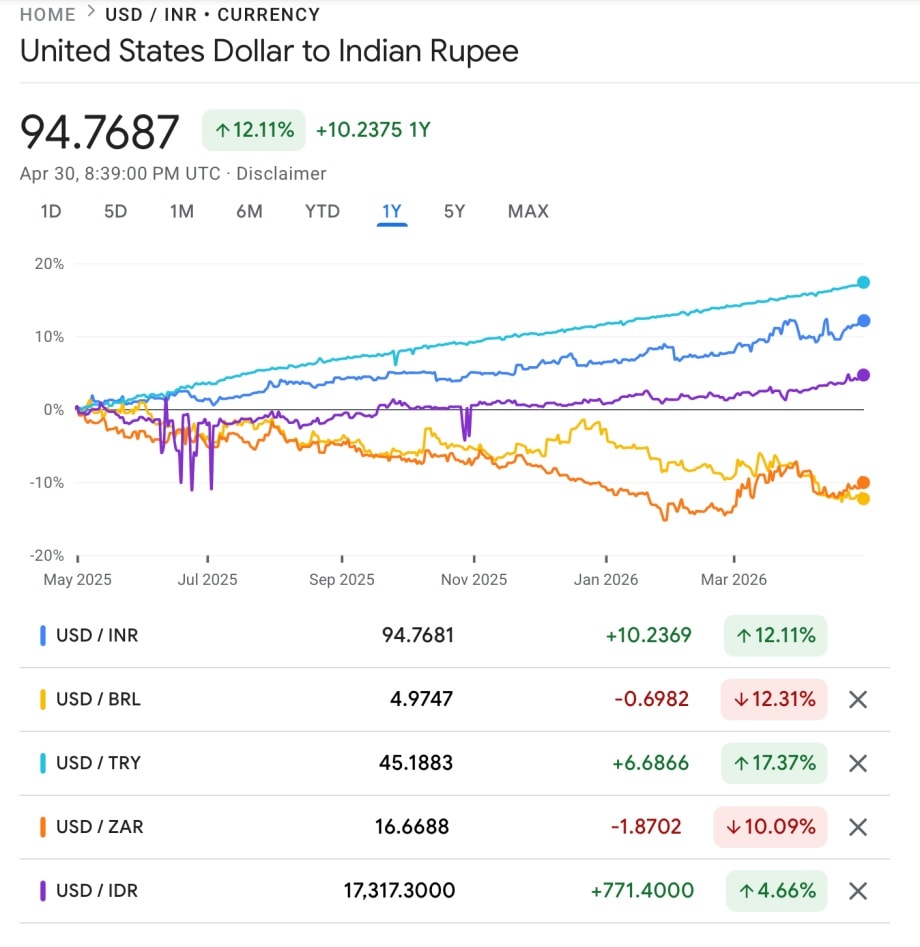 Chart 1 on rupee and fragile five currencies against the dollar today.
India is the second-worst (a fall of 12.1%) this time around. In fact, two economies — Brazil and South Africa — have seen their currencies appreciate against the dollar (by 12% and 10% respectively), or roughly the same degree by which the Indian rupee has depreciated. The Indonesian rupiah has lost just 4% of its value against the dollar.
The worst is the Turkish lira, which has lost 17% of its value against the dollar. However, the lira’s slide has actually been quite dramatic for much longer; it has lost over 1000% in its value since May 2018.
How does the rupee slide in 2026 compare with the slide in 2013?
CHART 2 shows the percentage change in the rupee’s exchange rate against the dollar at the end of each financial year. As can be seen, the rupee ended Financial Year 2013-14 down 9.5% against the dollar and ended FY 2025-26 (which ended in March) down 9.6%.
Story continues below this ad
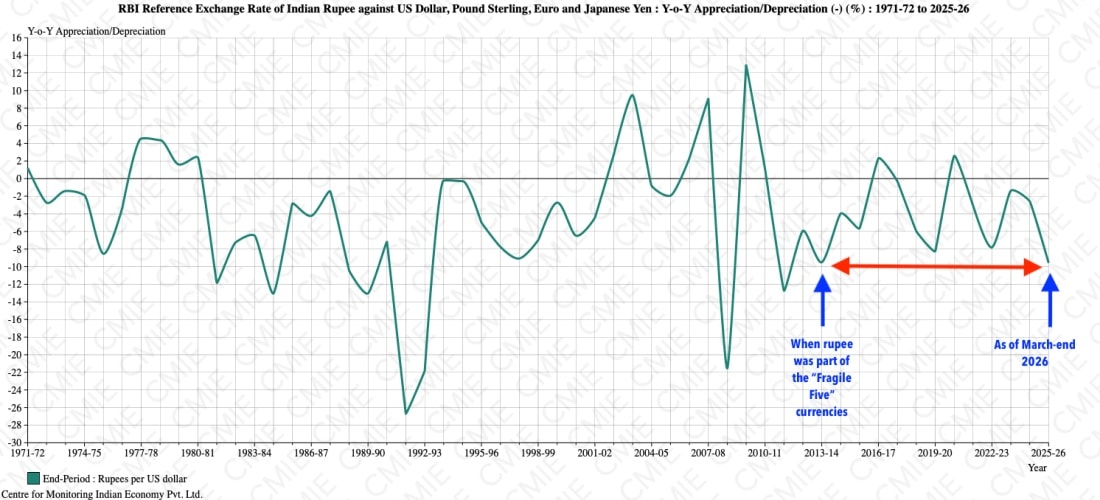 Chart 2 on rupee exchange rate comparison.
But while FY26 may have been as bad as FY14, the big difference was that the fall in the rupee’s exchange rate in FY14 came on the back of sharp falls in the two preceding years. It was on top of a 6% slide in FY13 and an almost 13% slide in FY12. The fall in the last financial year was preceded by fairly modest levels of weakness.
In terms of the factors that led to the recent slide, the story is again pretty similar to what happened to the economy’s Balance of Payment (the net effect of current and capital accounts) in 2013-14.
In CHART 3, the green and yellow lines show the change in current account “deficit” (implying money going out on a net basis) every quarter. The red and brown lines show the quarterly change in the capital account, which was mostly in surplus and sometimes in deficit.
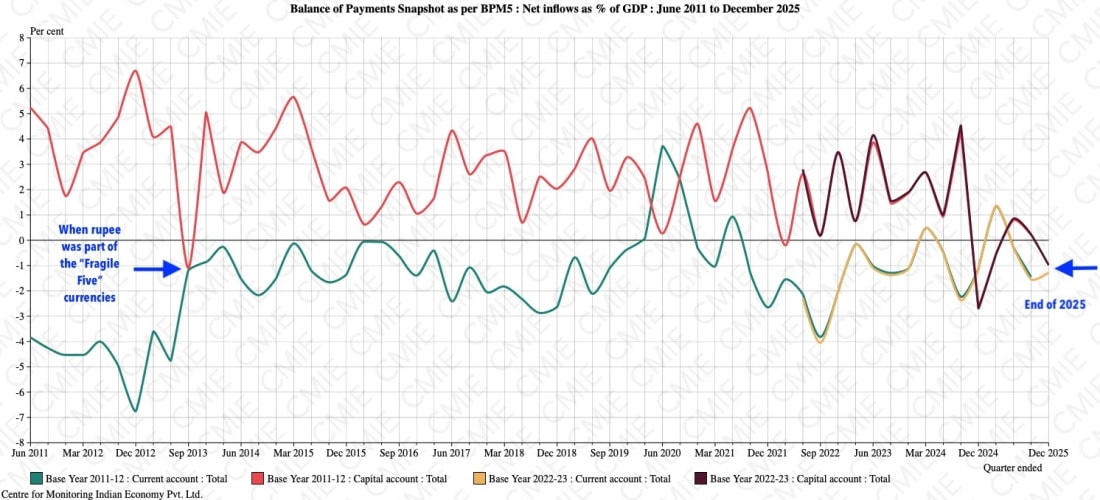 Chart 3 on BoP comparison.
If one compares the September 2013 quarter with the December 2025 quarter (the last quarter for which data is available), it is clear how similar the situation was both on the current and capital accounts. To be sure, both were in deficits, implying that not only was India spending more dollars on imports of goods and services, but also experiencing a flight of dollars out of the country on a net basis.
Story continues below this ad
The only way to pay for both deficits is to draw down the foreign exchange reserves, as shown by CHART 4.
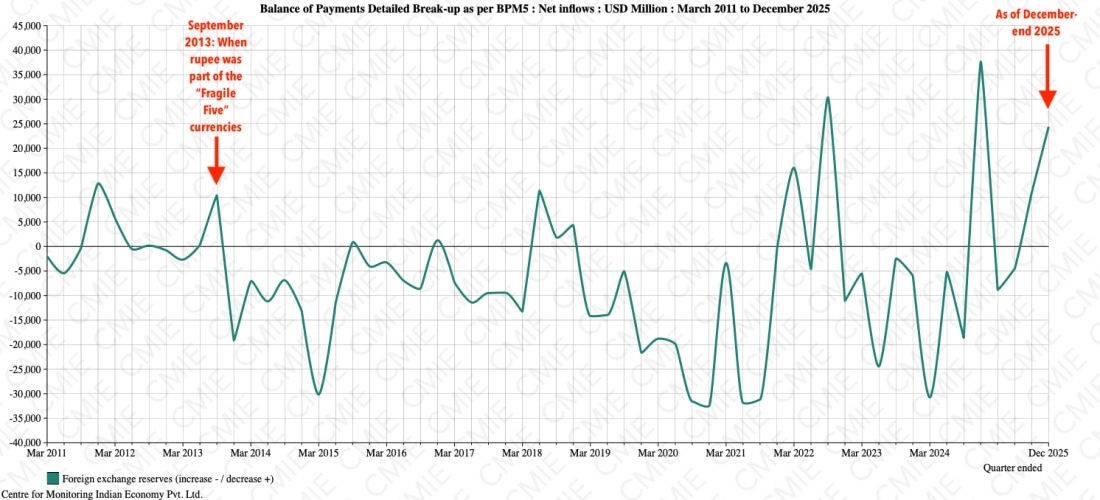 Chart 4 on forex drawdown.

