

 The UK Property Market Stats Show offers a weekly snapshot of what is really happening across the housing market, using live property data rather than lagging indices and headline-driven commentary.
This latest episode covers Week 19 of 2026, ending Sunday 17 May, and this week features guest panellist Simon Gates.
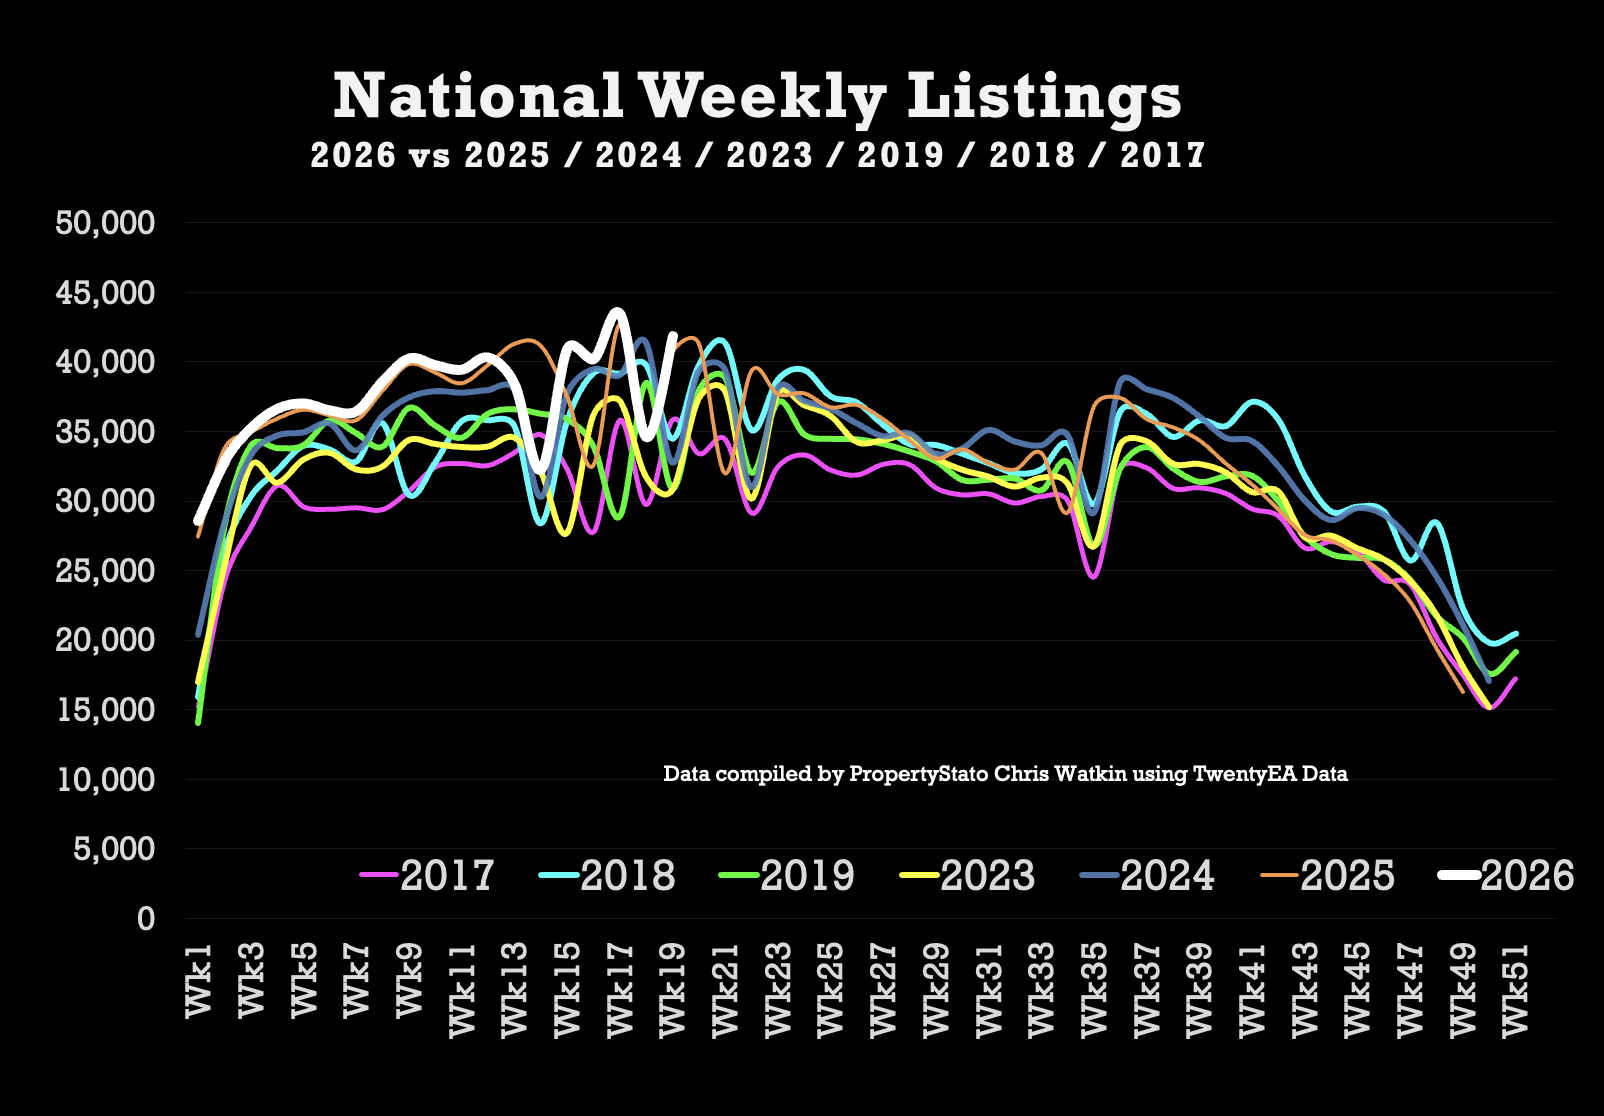
The hour-long programme is split into two parts. The first focuses on national housing market activity, analysing live weekly data on new listings, homes sold subject to contract, fall-throughs, exchanges, price reductions, stock levels, overvaluing and price-per-square-foot trends.
Unlike Land Registry figures, which can lag the market by several months, the show examines buyer and seller behaviour in near real time, providing agents with a more current view of market conditions.
The second half of the programme takes a closer look at an individual local market. This week’s episode focuses on Scunthorpe, examining estate agent market share, pricing strategies, exchanges, time to sell and fall-through rates.
The show combines national housing market analysis with local performance data to provide estate agents with a detailed view of trends shaping the market week by week.
Important Note – Week 18 (the week before) was a bank Holiday week, so numbers will be artificially lower than normal for week 18 because of that
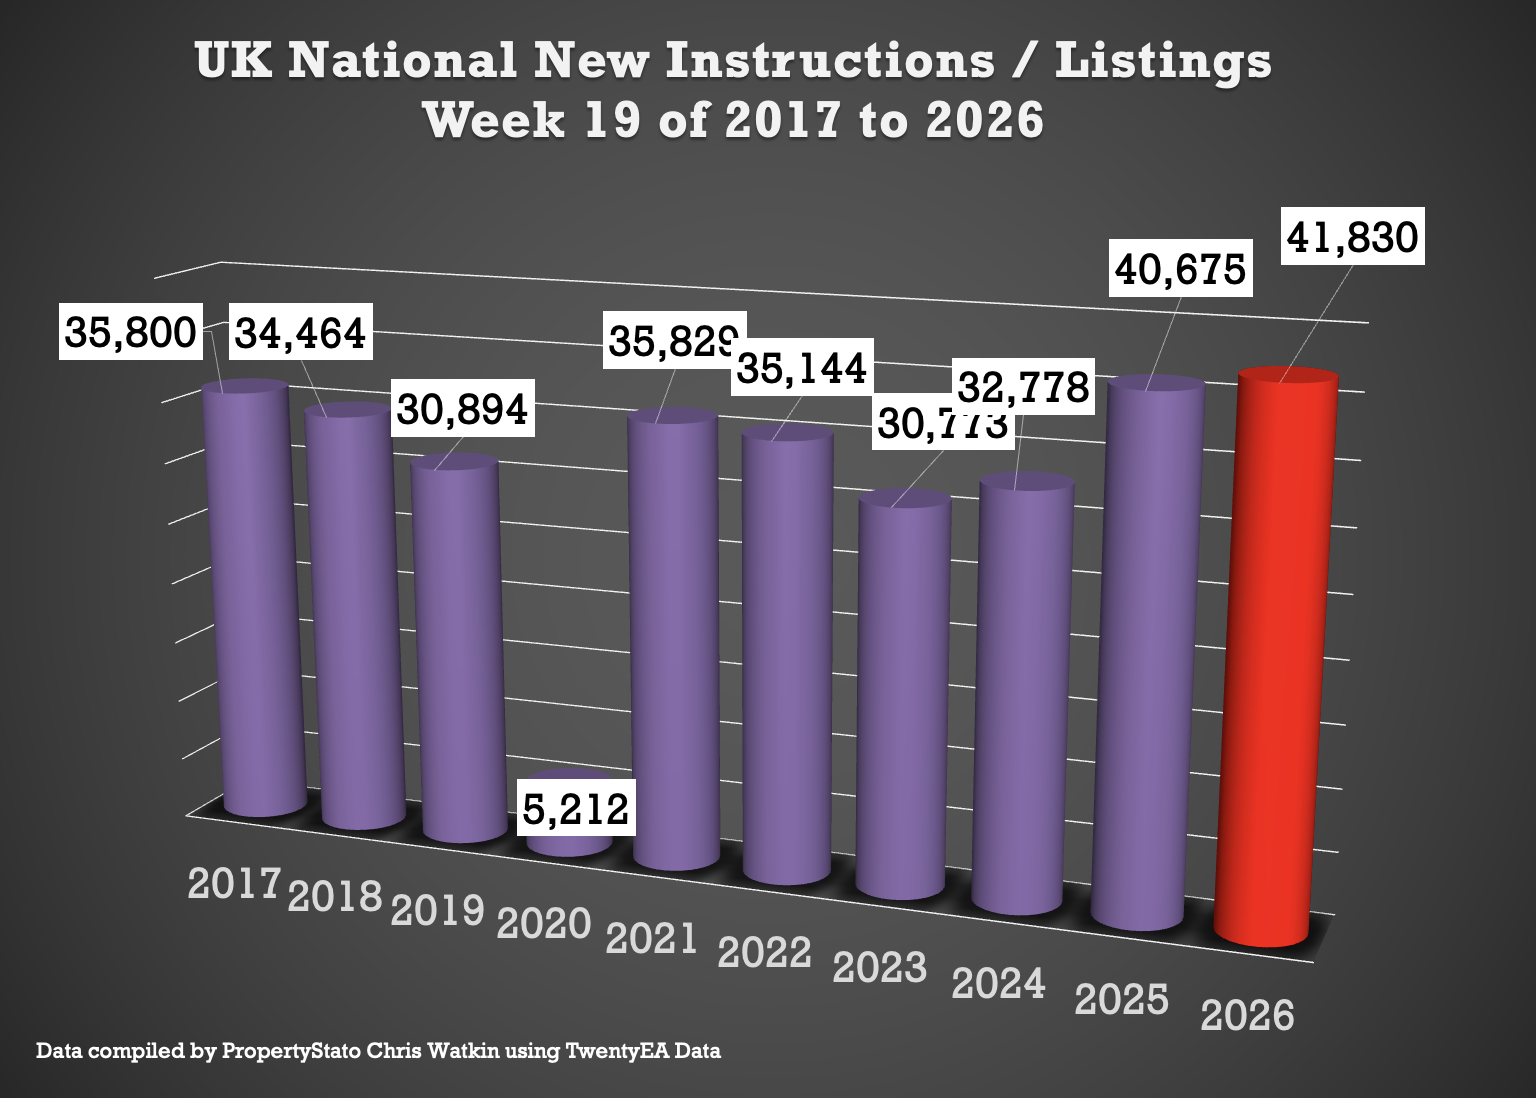
🟥 Listings
Week 19 ..
41.8k new properties came onto market this week, UP from 34.6k last week.
Weekly average for 2026: 37.5k.
2025 weekly average: 30.6k.
10-year week 19 average : 32.3k
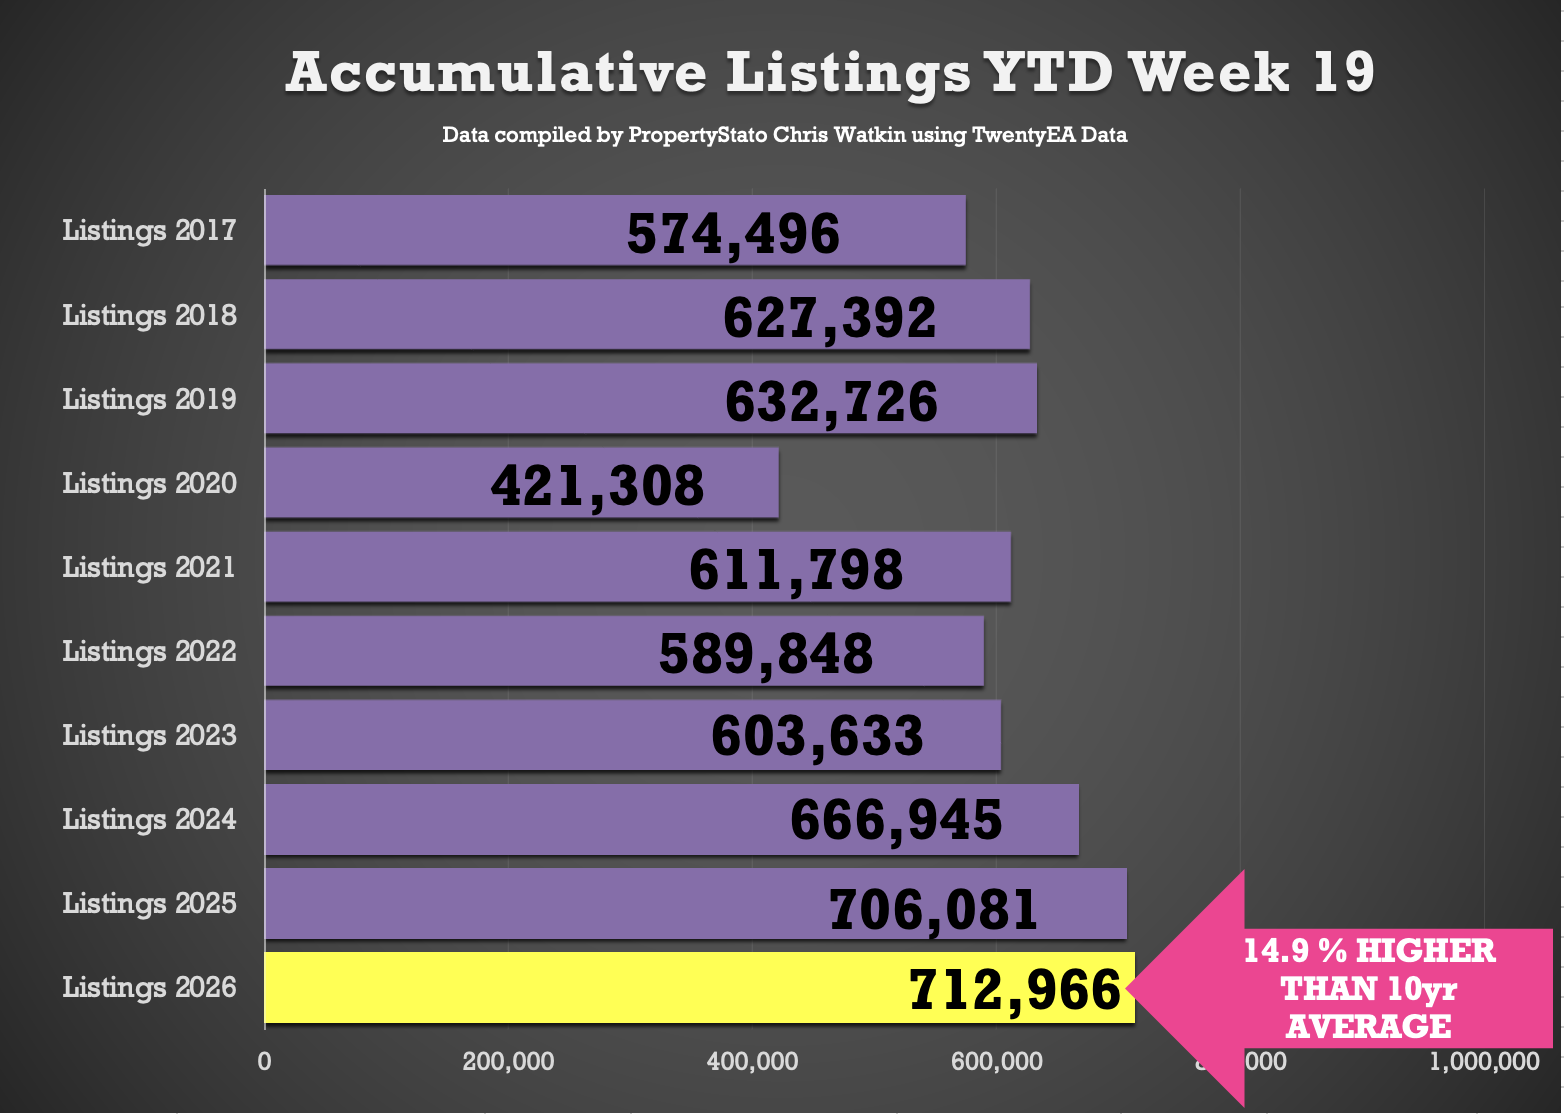
Year to Date
713k new properties (listings) have come onto the market YTD
1% ahead of 2025 YTD (706k)
6.9% ahead of 2024 YTD (667k)
16.6% higher than the 2017–19 average YTD (611k).
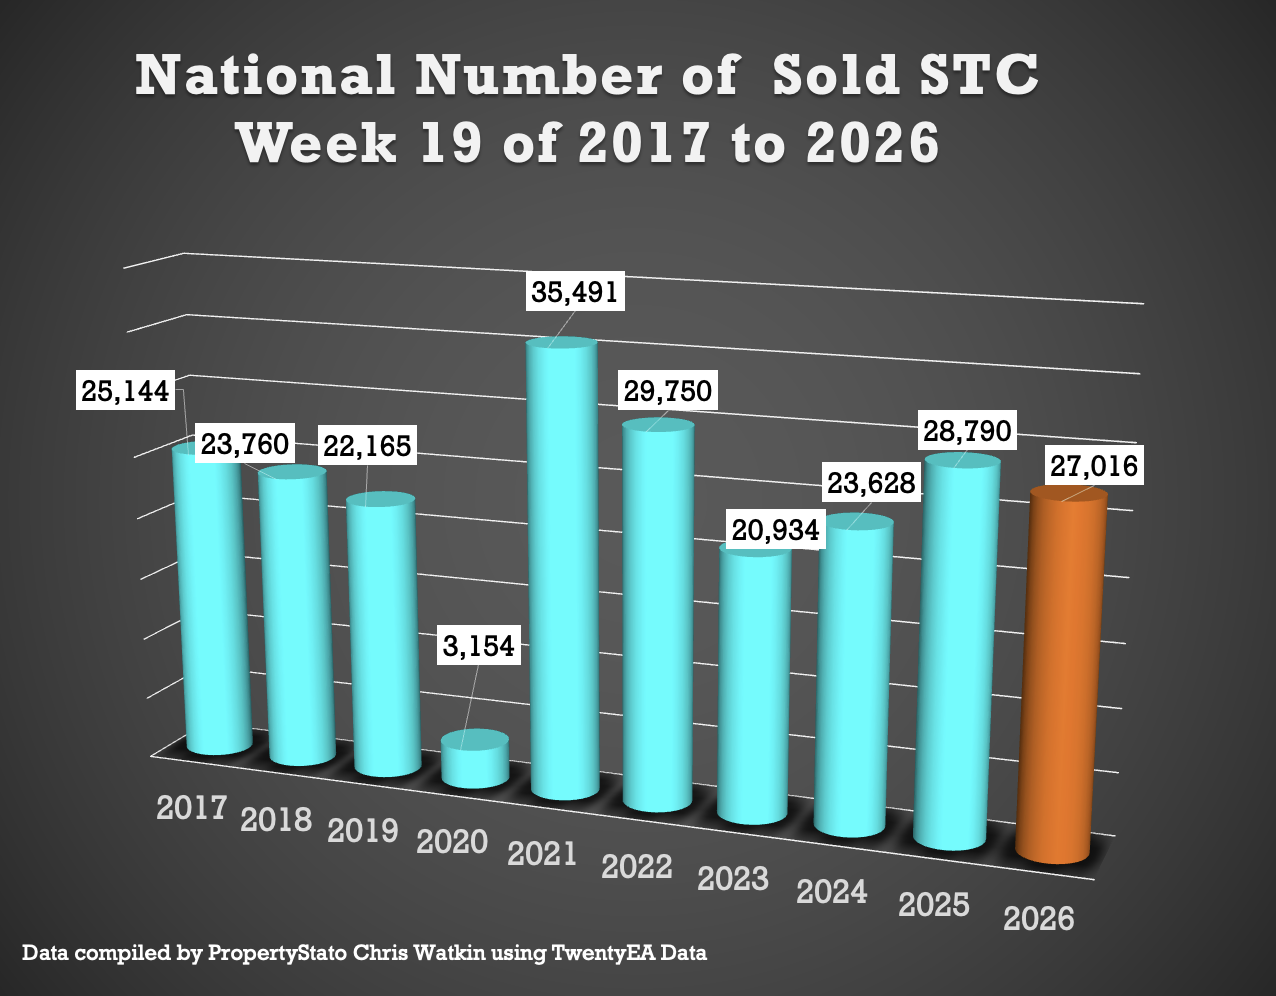
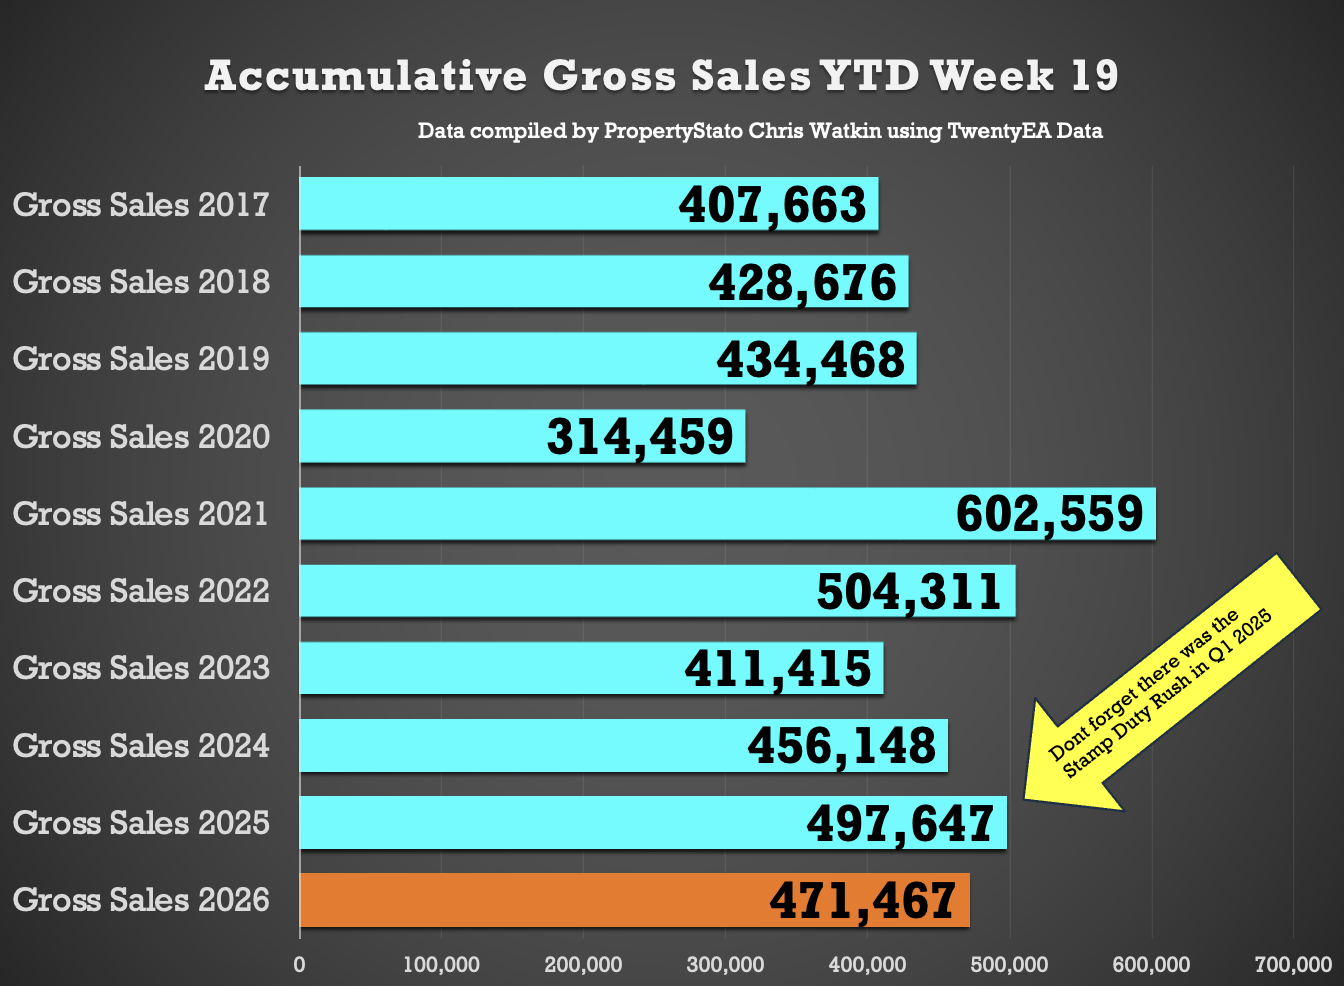
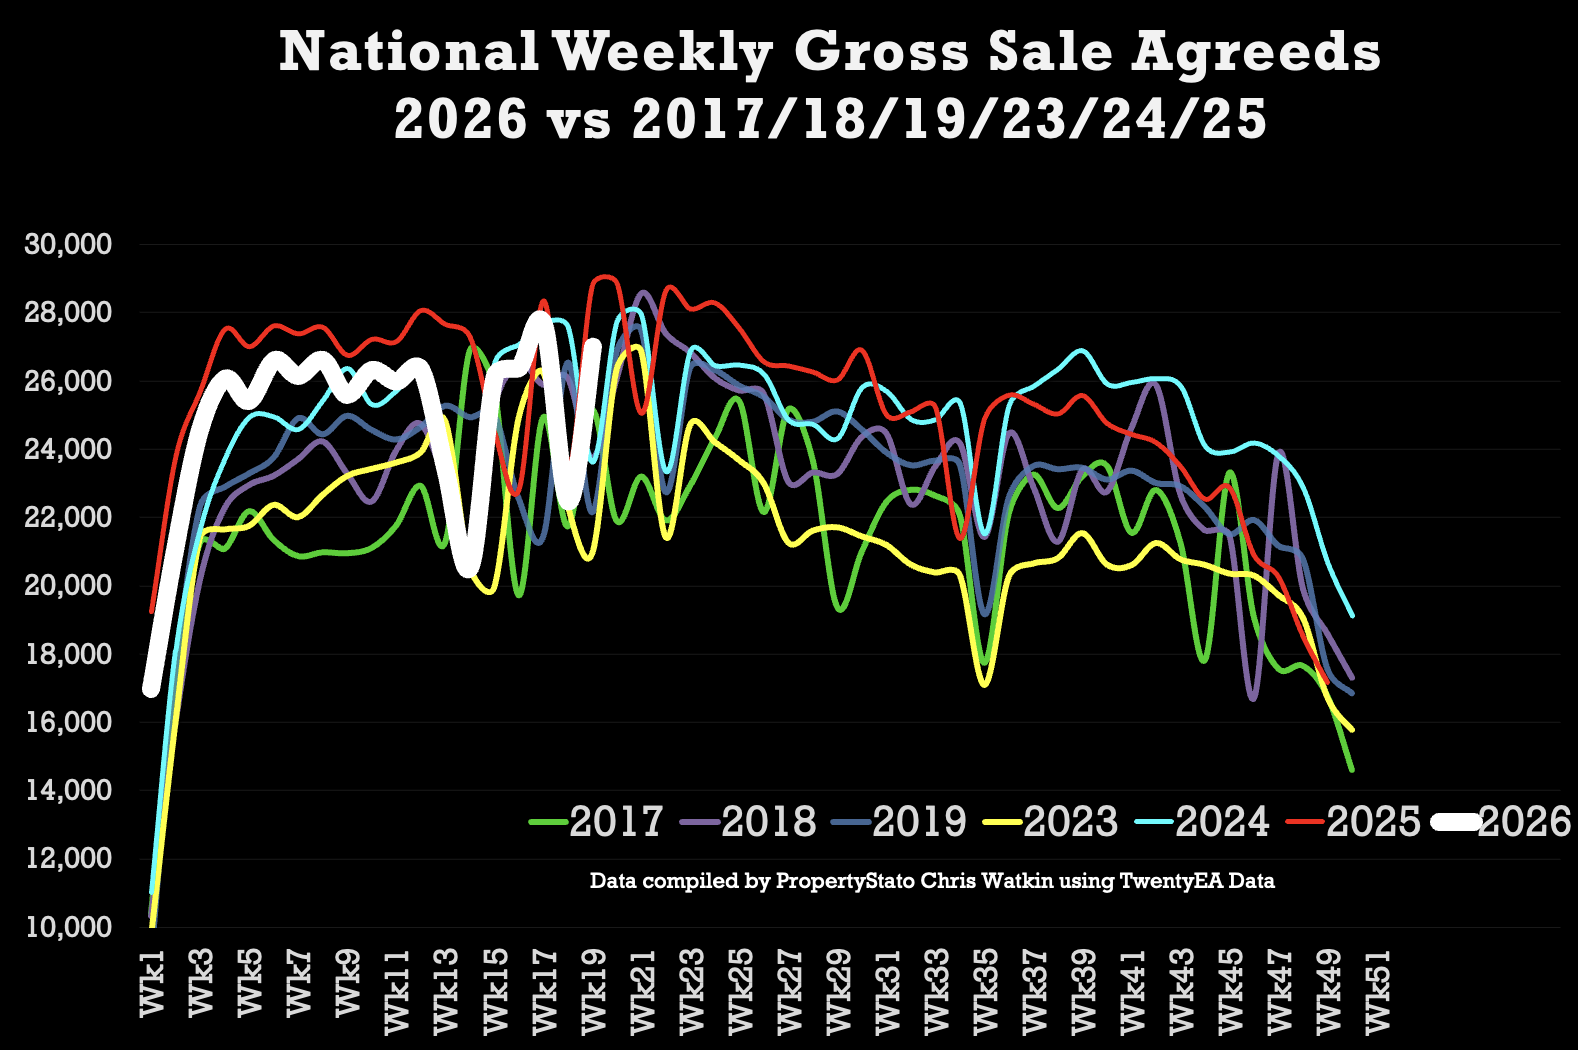
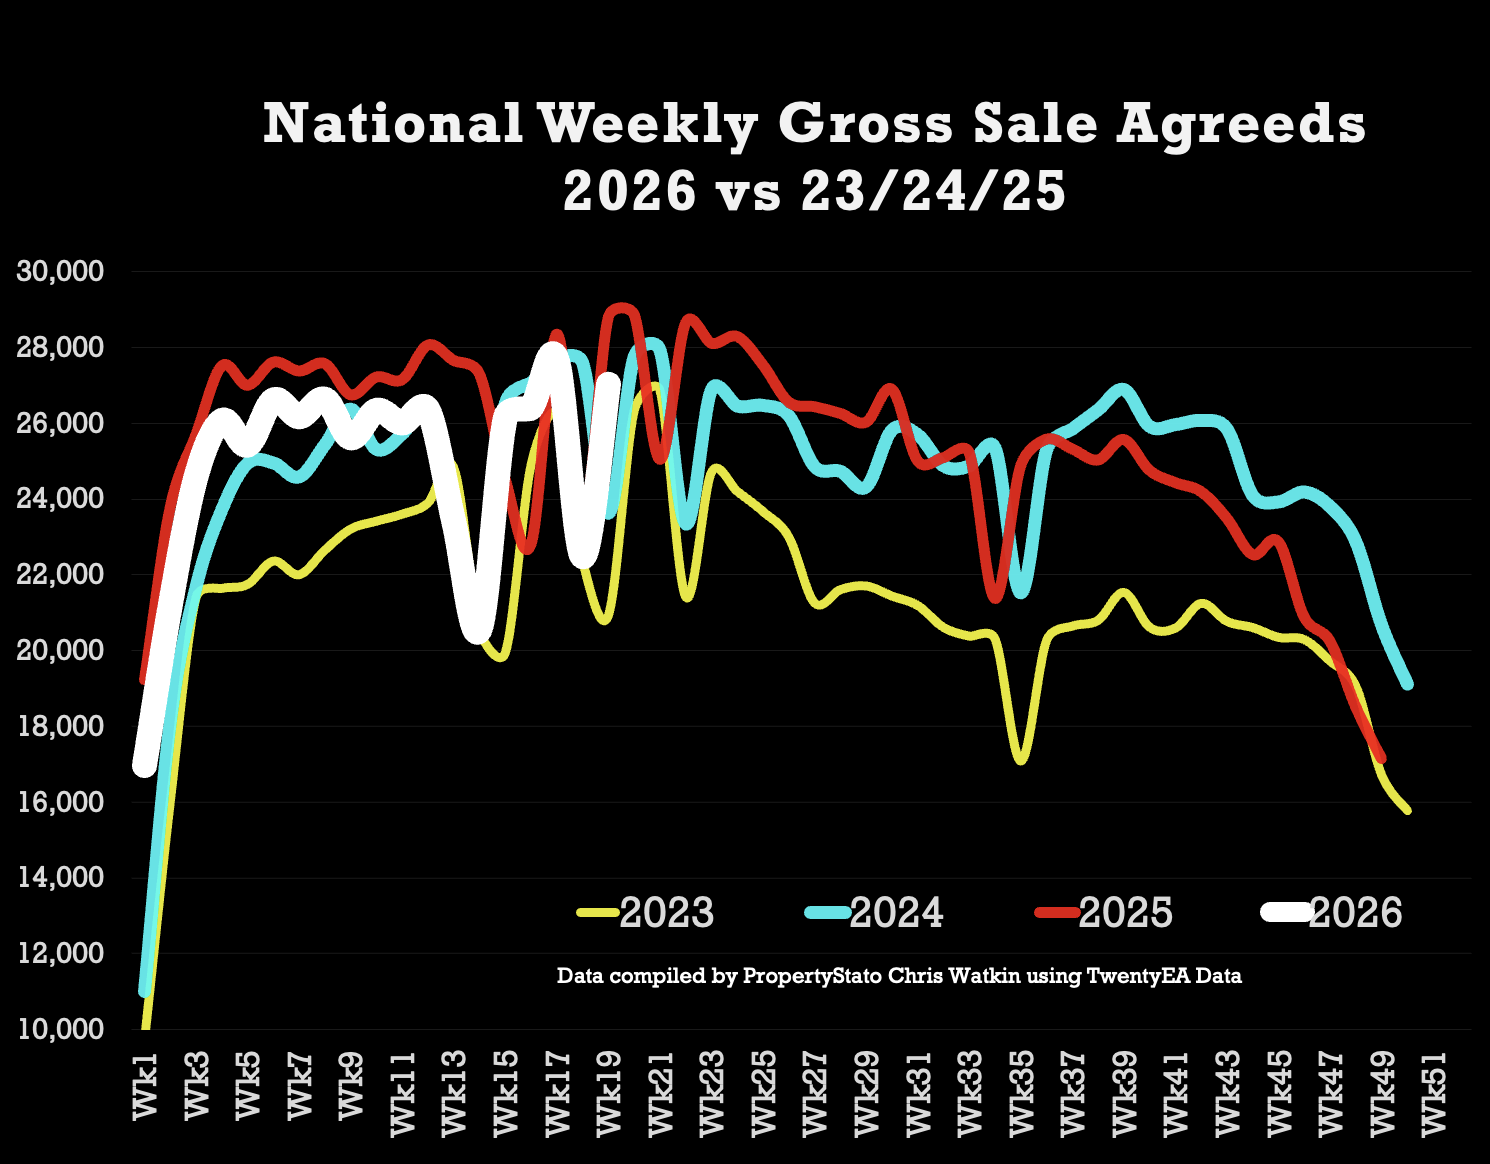
🟥 UK Gross Resi Sales
Week 19
27k homes sold stc this week 19, UP from 22.5k last week
Week 19 average (for last 10 years which includes the post pandemic boom) : 24k
2026 weekly average : 24.8k.
Year to Date
471k UK homes sold stc YTD
5.3% lower than 2025 YTD (498k)
3.4% higher than 2024 YTD(456k),
14.6% higher than 2023 YTD(411k)
11.3% higher above pre Covid 2017-19 years(424k).
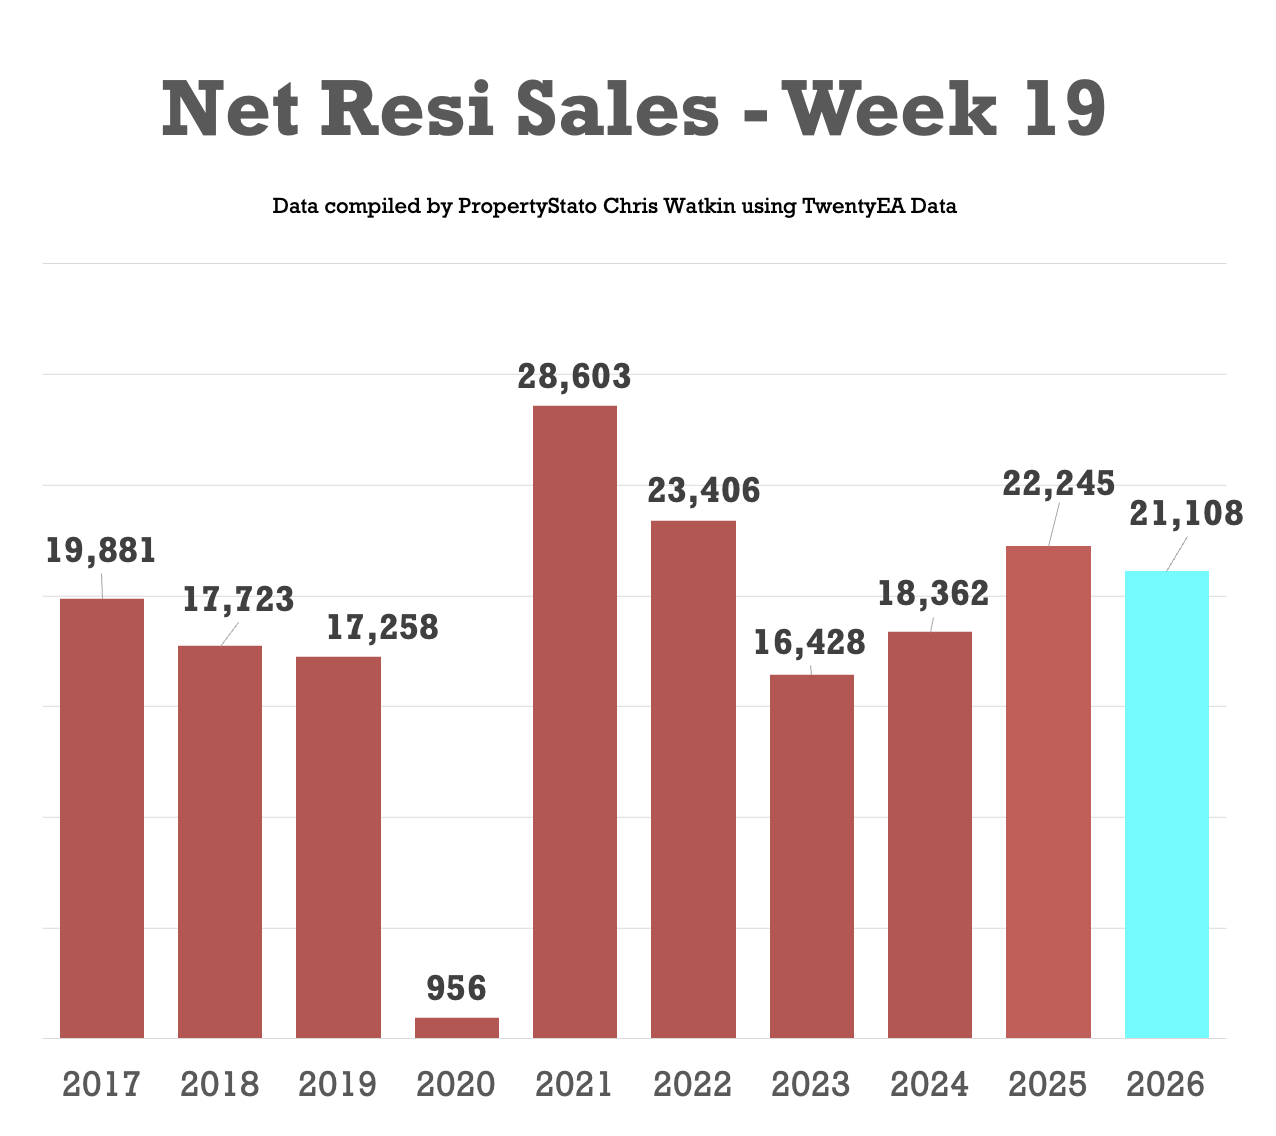
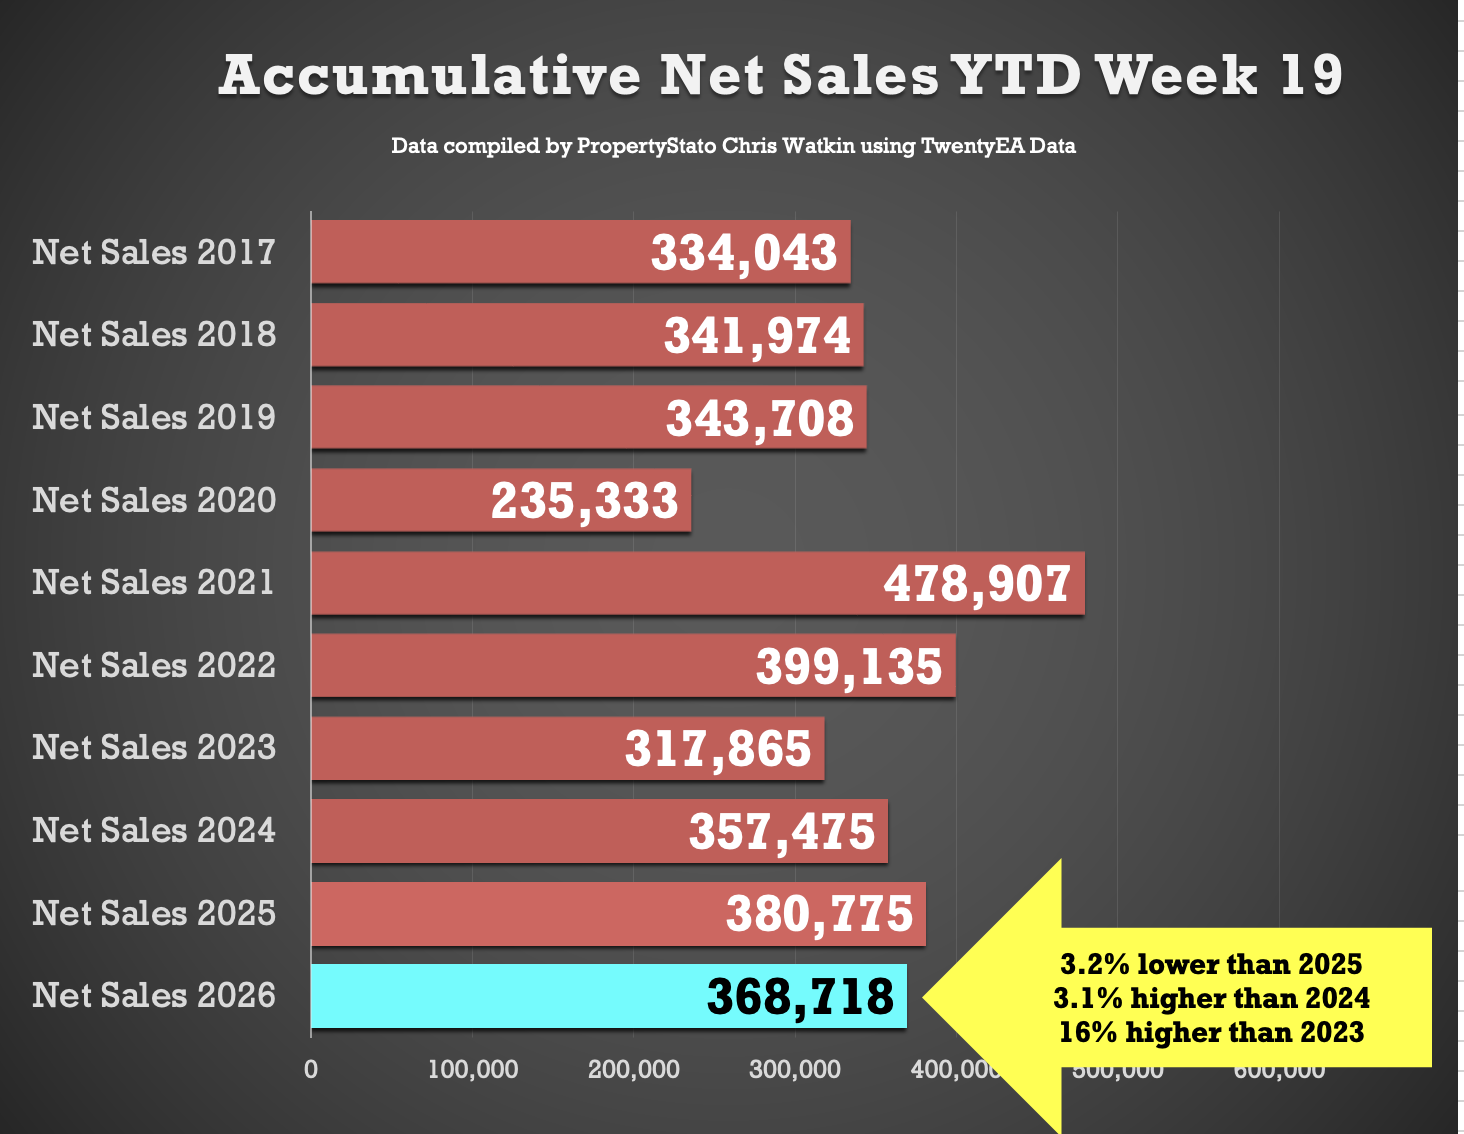
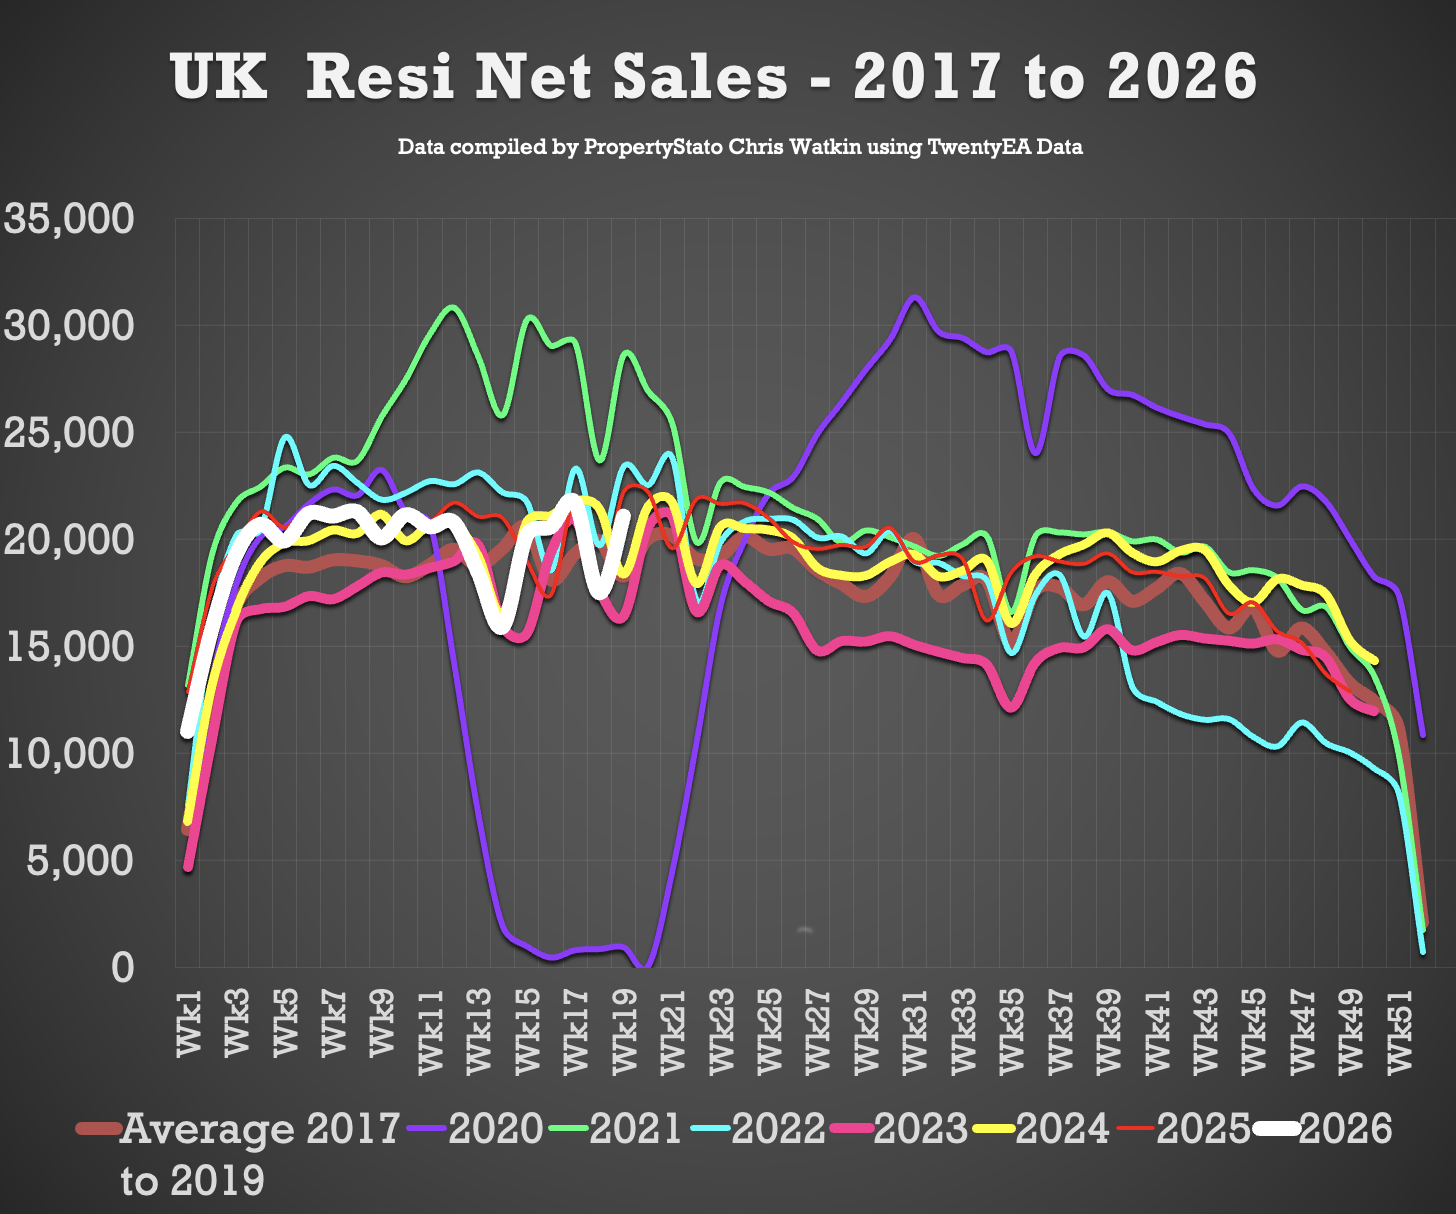
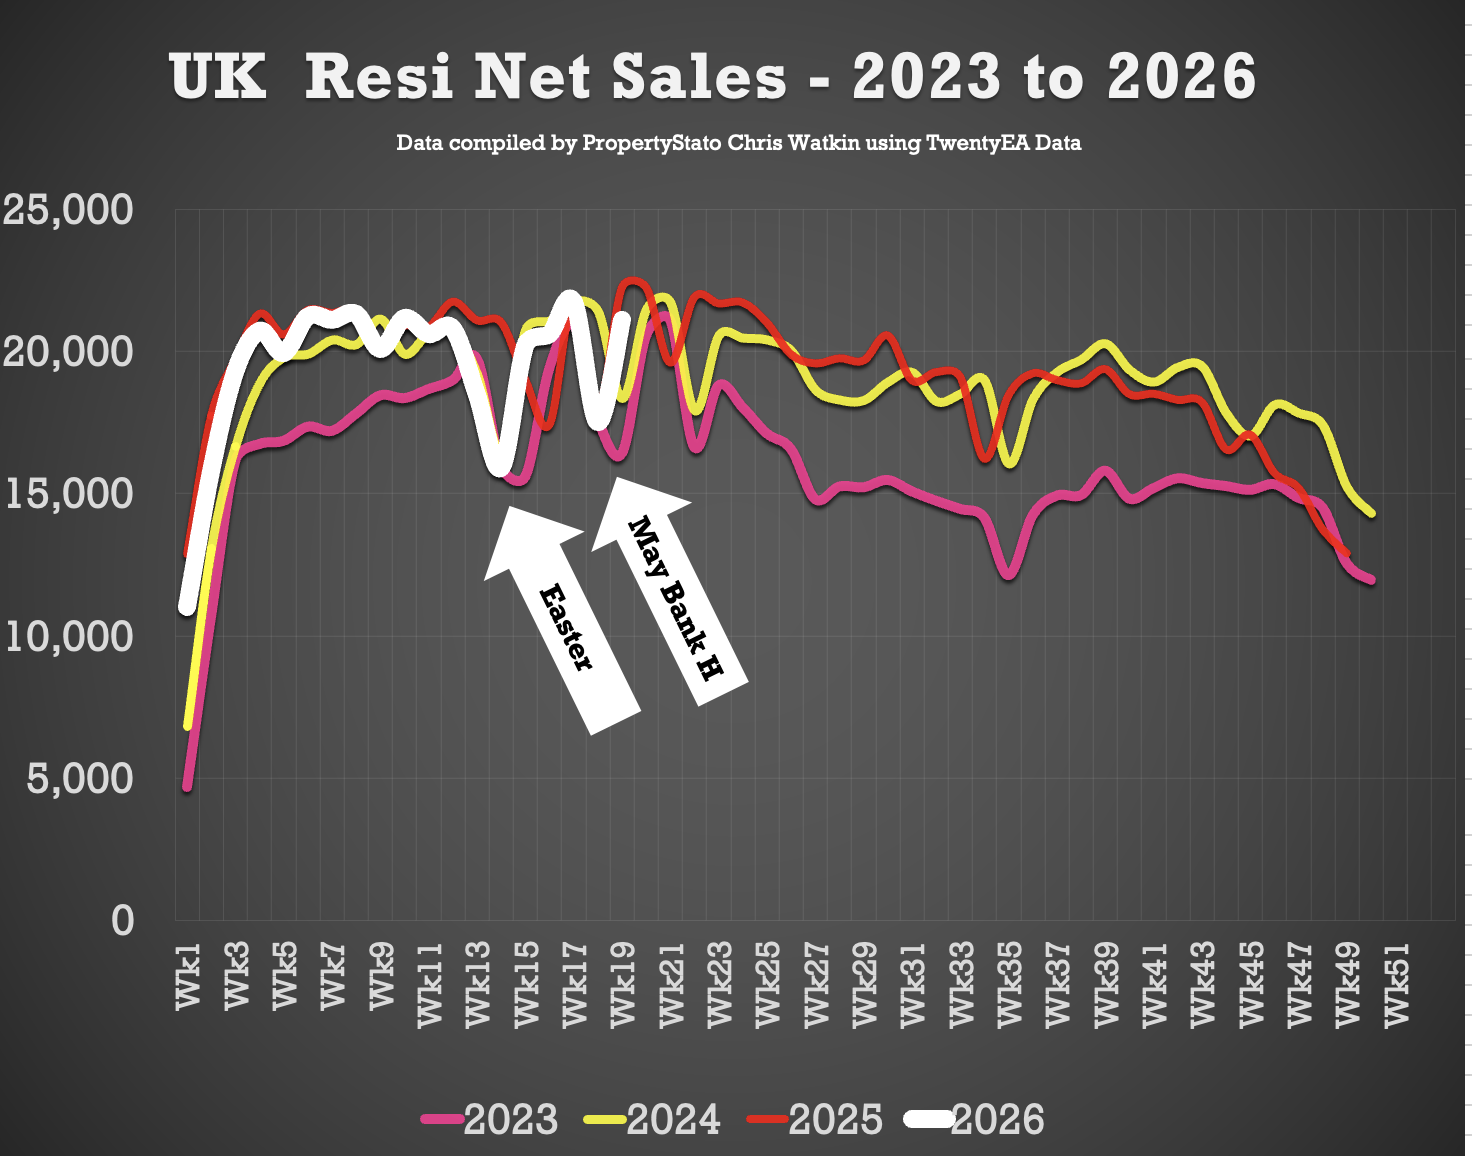
🟥 UK Net Resi Sales YTD
Week 19
21.8k Net Sales, up from 17.5k last week
Ten-year Week 19 average: 18.6k.
Weekly average for 2026: 19.4k.
Weekly average for the whole of 2025: 18.8k.
Year to Date
369k UK net home sales YTD
3.2% lower than 2025 (380k),
3.1% ahead of 2024 (357k),
16% ahead of 2023 (318k)
8.5% above the 2017–19 average (340k).
(Net Sales being Gross sales less Fall Thrus).
Other Important UK Property Market Stats for Week 19
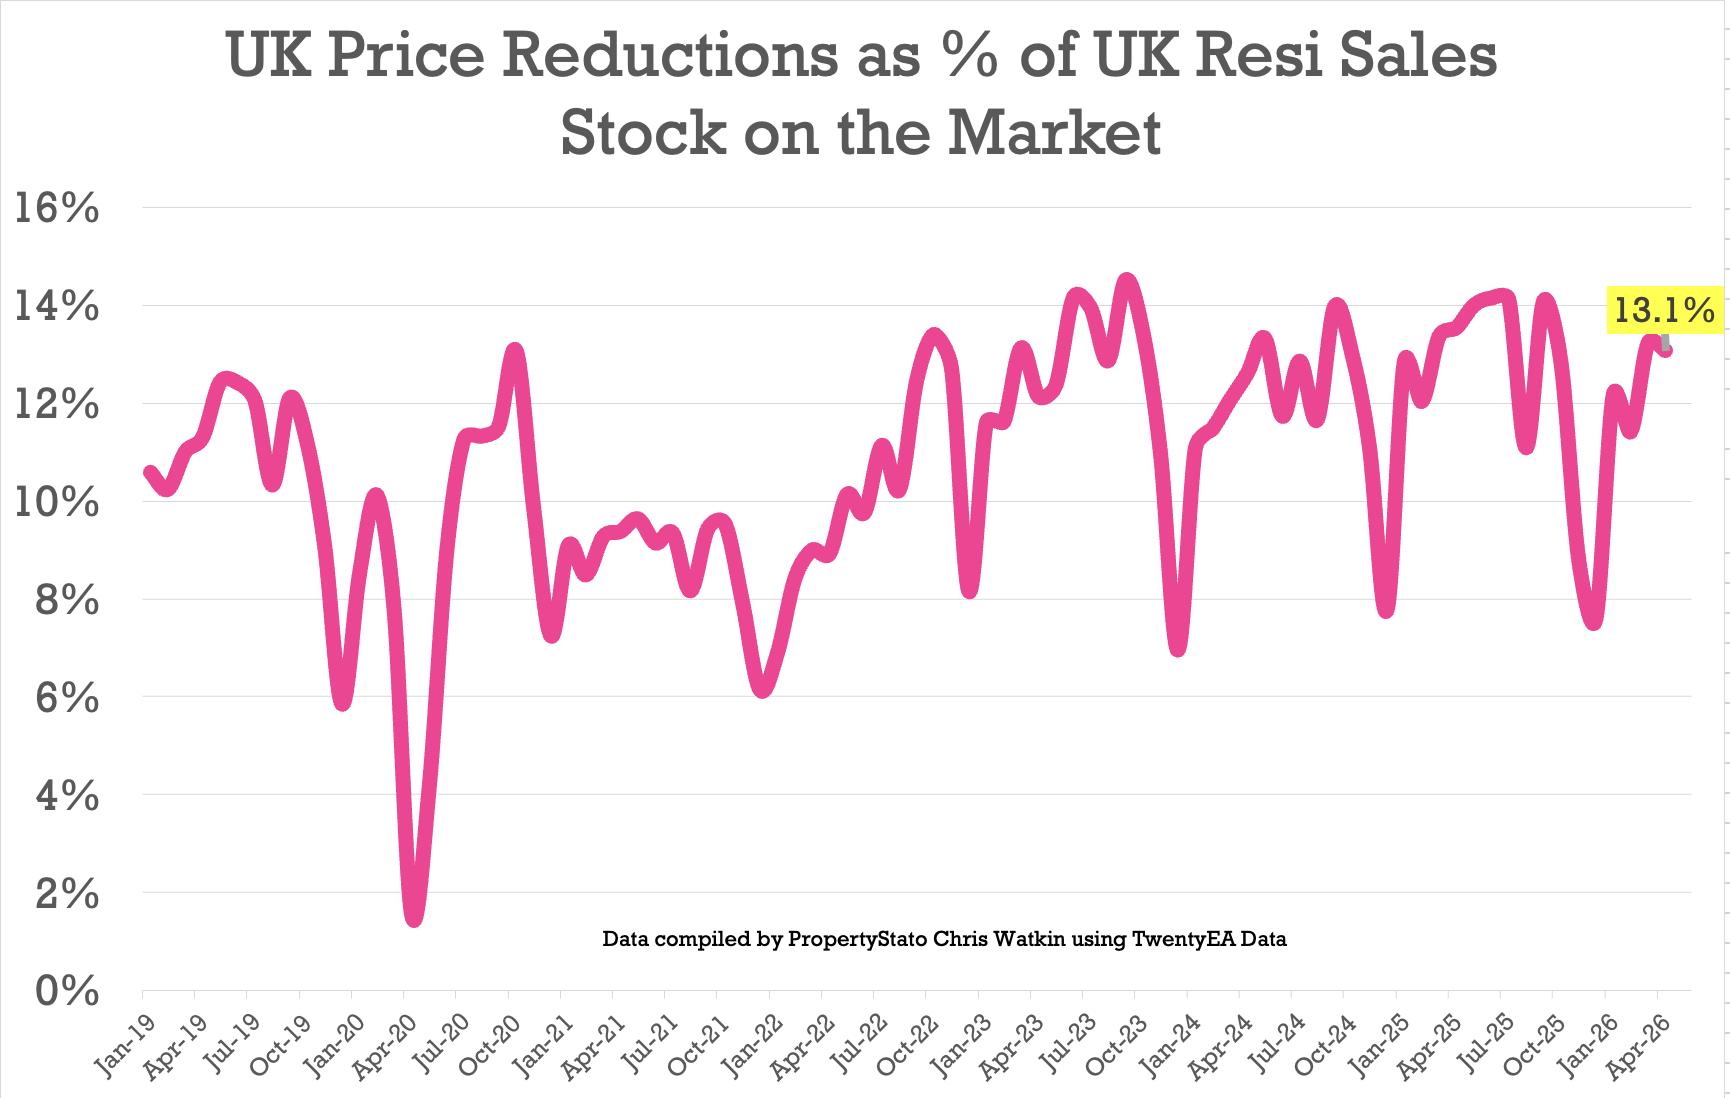
🟩 Price Reductions
• 27.5k reductions this week, UP from 22.5k last week.
• 13.1% of UK resi homes for sale were reduced in April. Mar 26 was 13.2%.
• 2025 average was 12.8%, versus the 6-year long-term average of 10.7%.
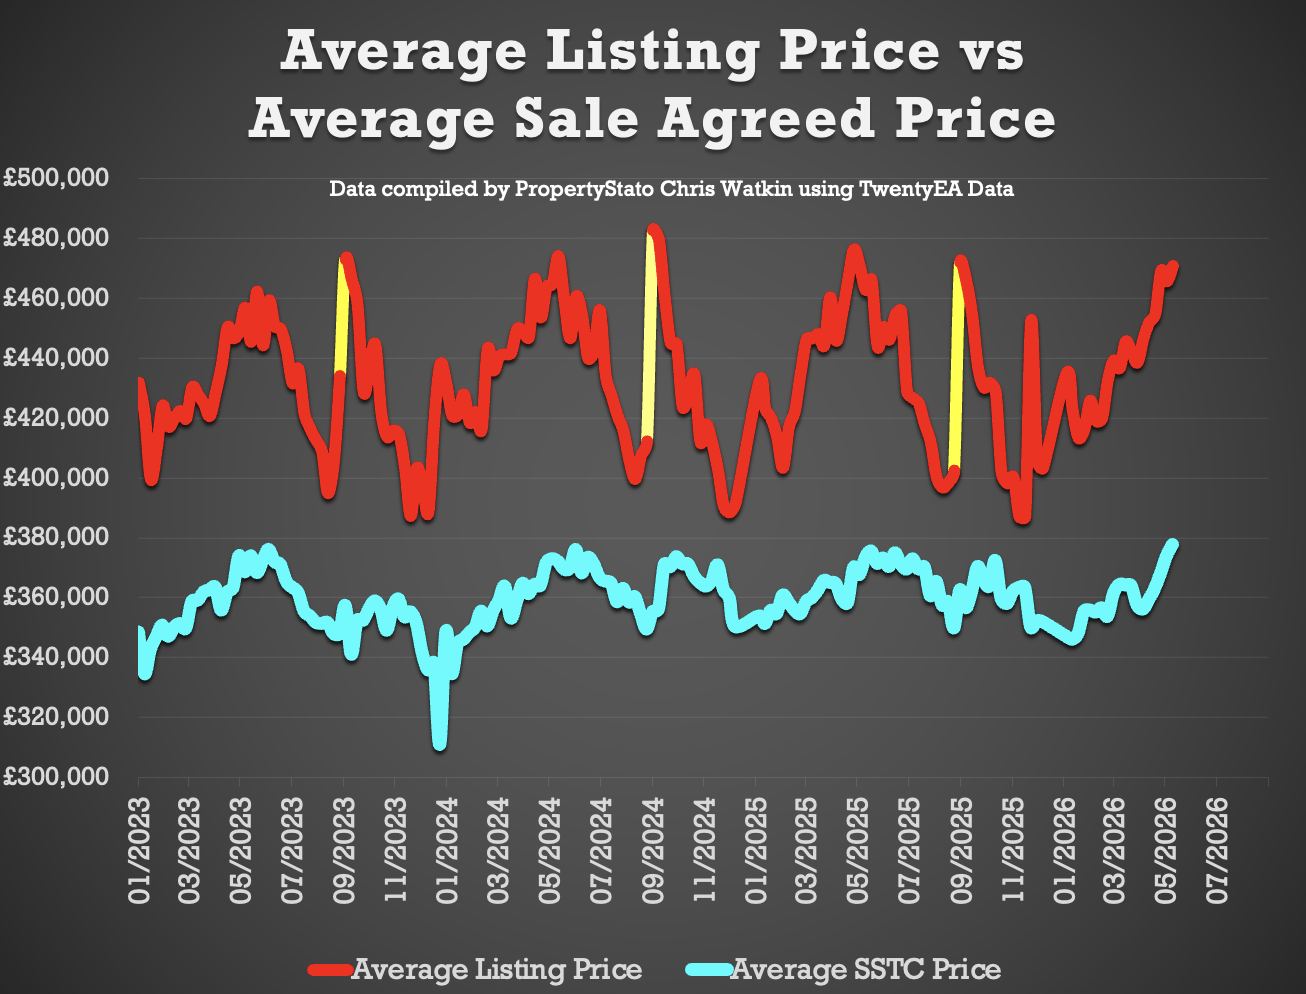
🟩 Price Difference between Asking Price of Listings & Asking Price of those Homes that go Sold stc
• 24.7% difference (long term 10 year average is 16% to 17%). (£471k ave Listing Ave Asking price vs £378k Sale Agreed ave Asking price)
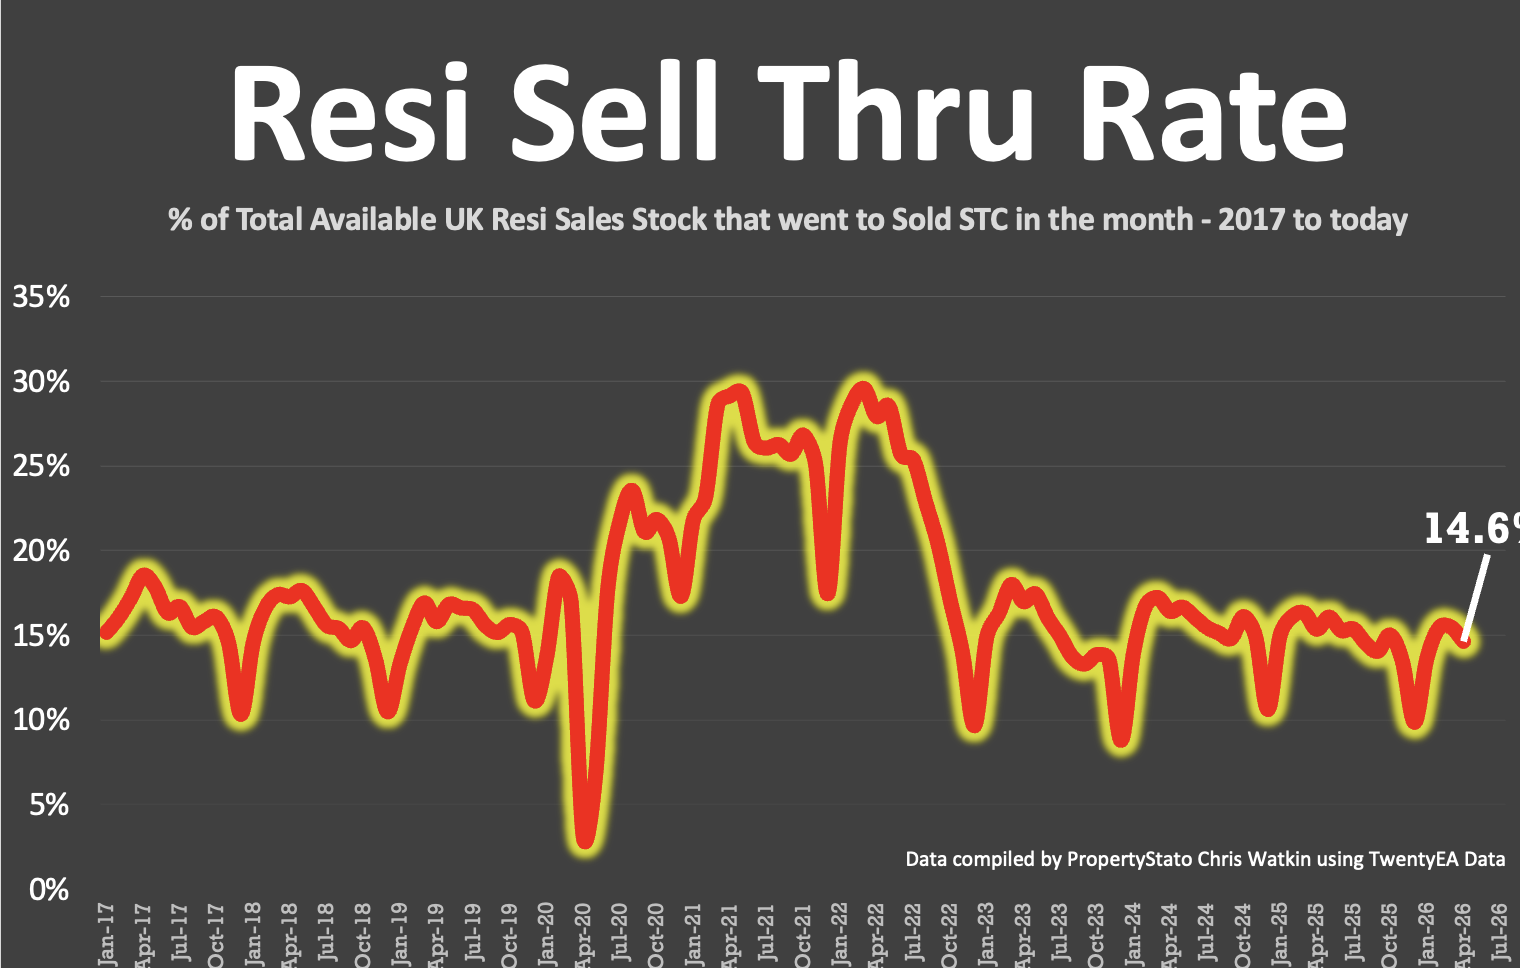
🟩 Sell-Through Rate
• 14.6% of homes on agents’ books went SSTC in April ’26. Down from March ’26 – 15.5%
• Pre-Covid average: 15.5%.
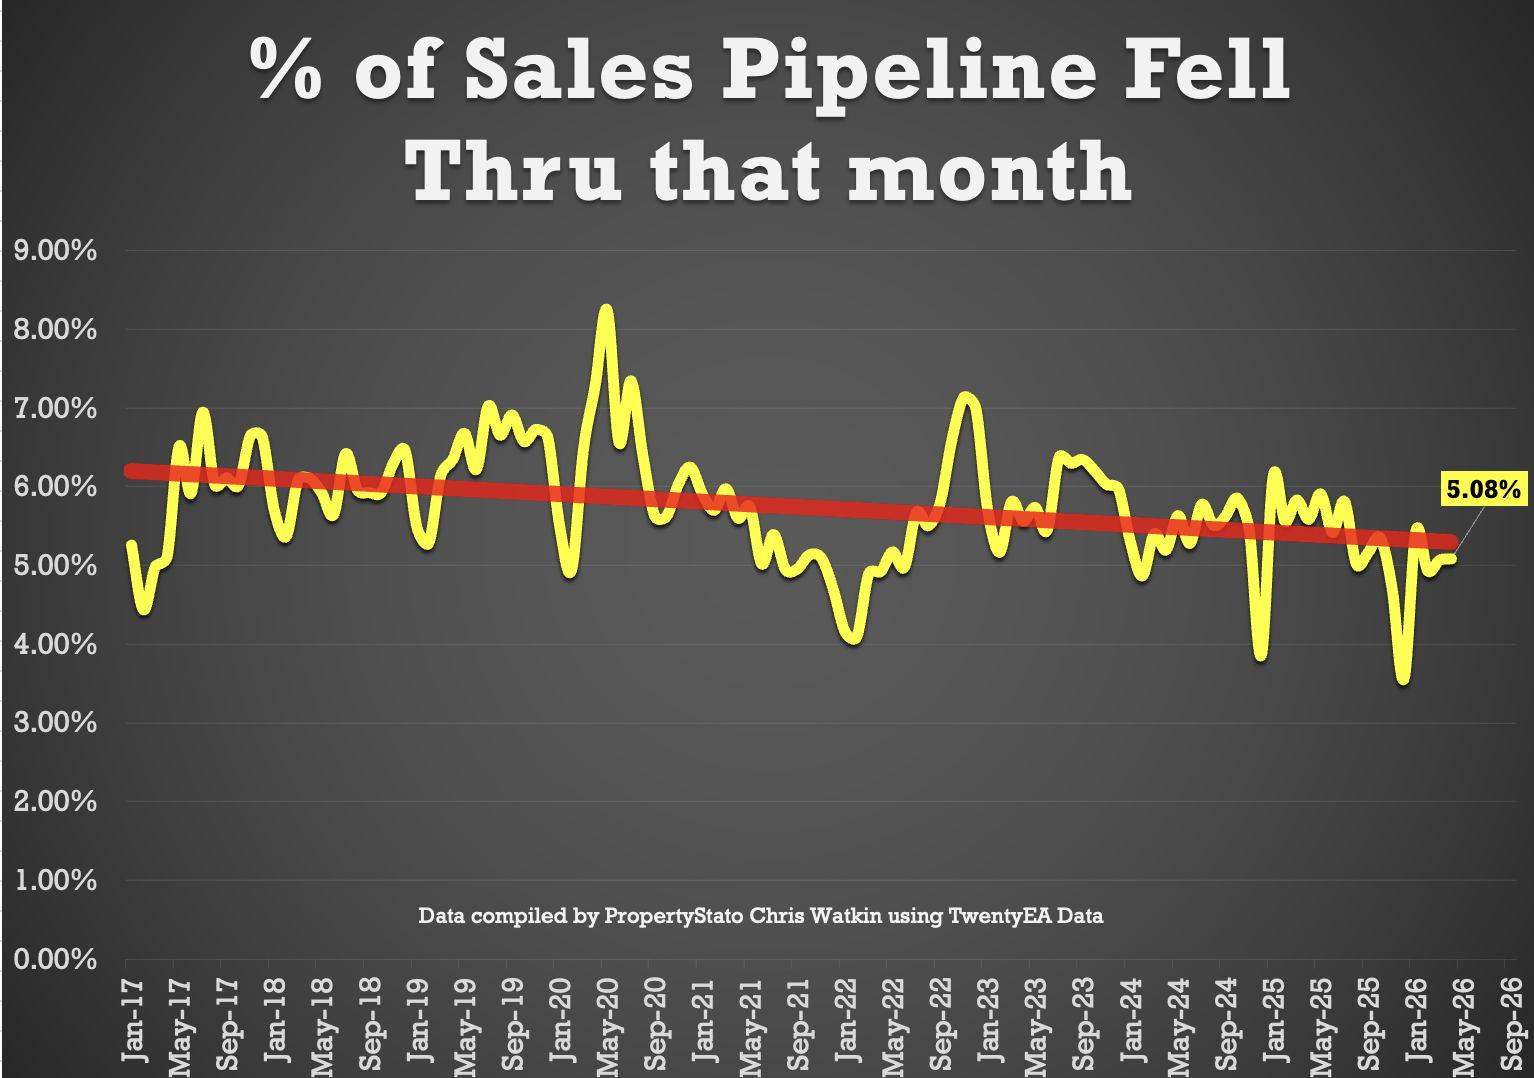
🟩 Fall-Throughs
• 5,908 fall-throughs last week (pipeline of 461k home Sold STC).
• Weekly average of fall thrus for the whole of 2025: 6.1k and 5.4k in 2026 YTD
• Fall-through rate (Fall thru expressed as a % of the Gross sales that week): 22%, UP SLIGHTLY from last week’s 21.4%.
• Long-term average: 24.5% (post-Truss chaos saw levels exceed 40%).
• 5.08% of all the sales agreed in Estate Agent’s Sales pipelines fell thru in April 2026. 2025 average – 5.3% & 10 year average 5.8%).
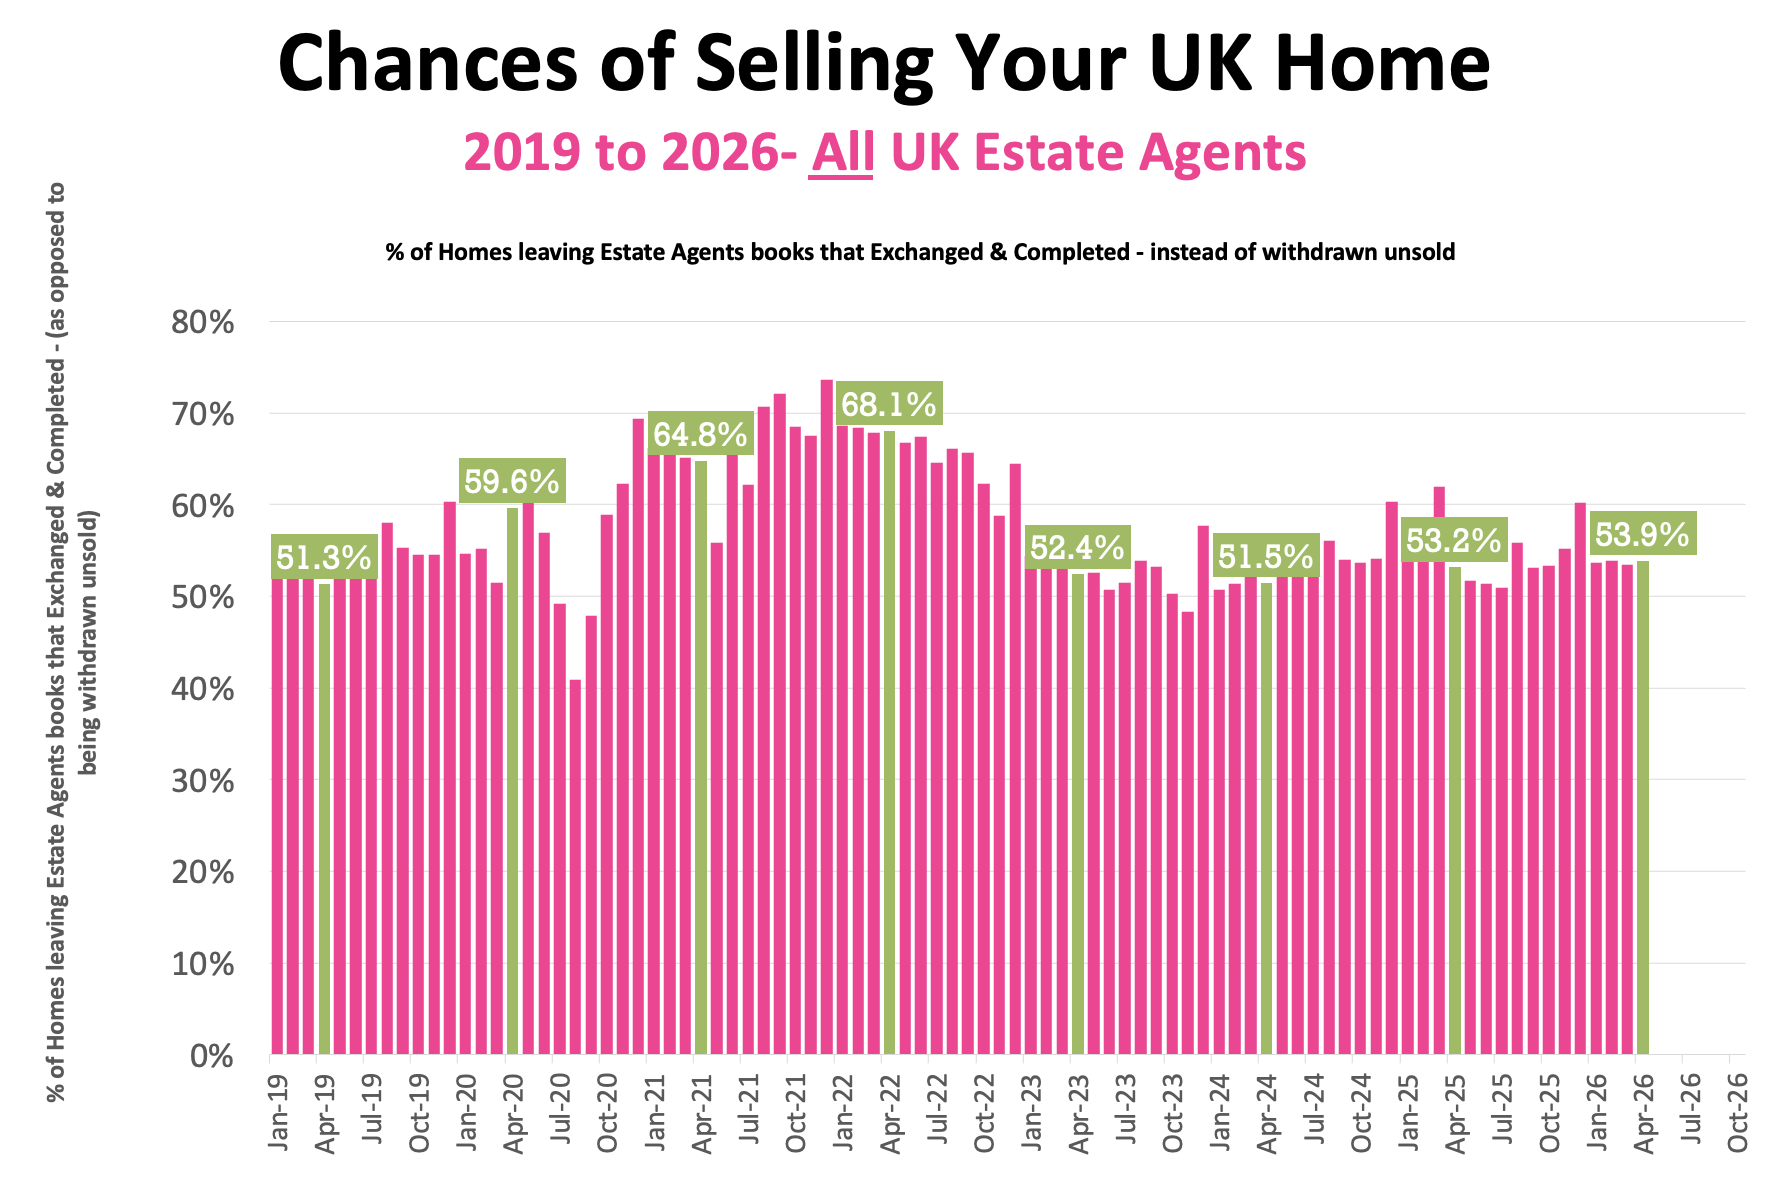
🟩 Probability of Selling (% that Exchange vs withdrawal)
• April 2026 Stats : 53.9% of homes that left agents’ books exchanged & completed in April. (Note this figure will change throughout the month as more April stats come in).
• 57.6% is the 7 year average (which includes the crazy years post lockdown 18 months).
🟩 Exchanges
• April 2026 – 74,049 Exchanges (compared to 69,435 in April 2025)
• 289k UK Exchanges YTD to the end of April 2026. 8% lower than Jan to April 2025, when it was 314k. Note – There were more exchanges in Q1 2025 because of the stamp duty holiday which finished in April 2025.
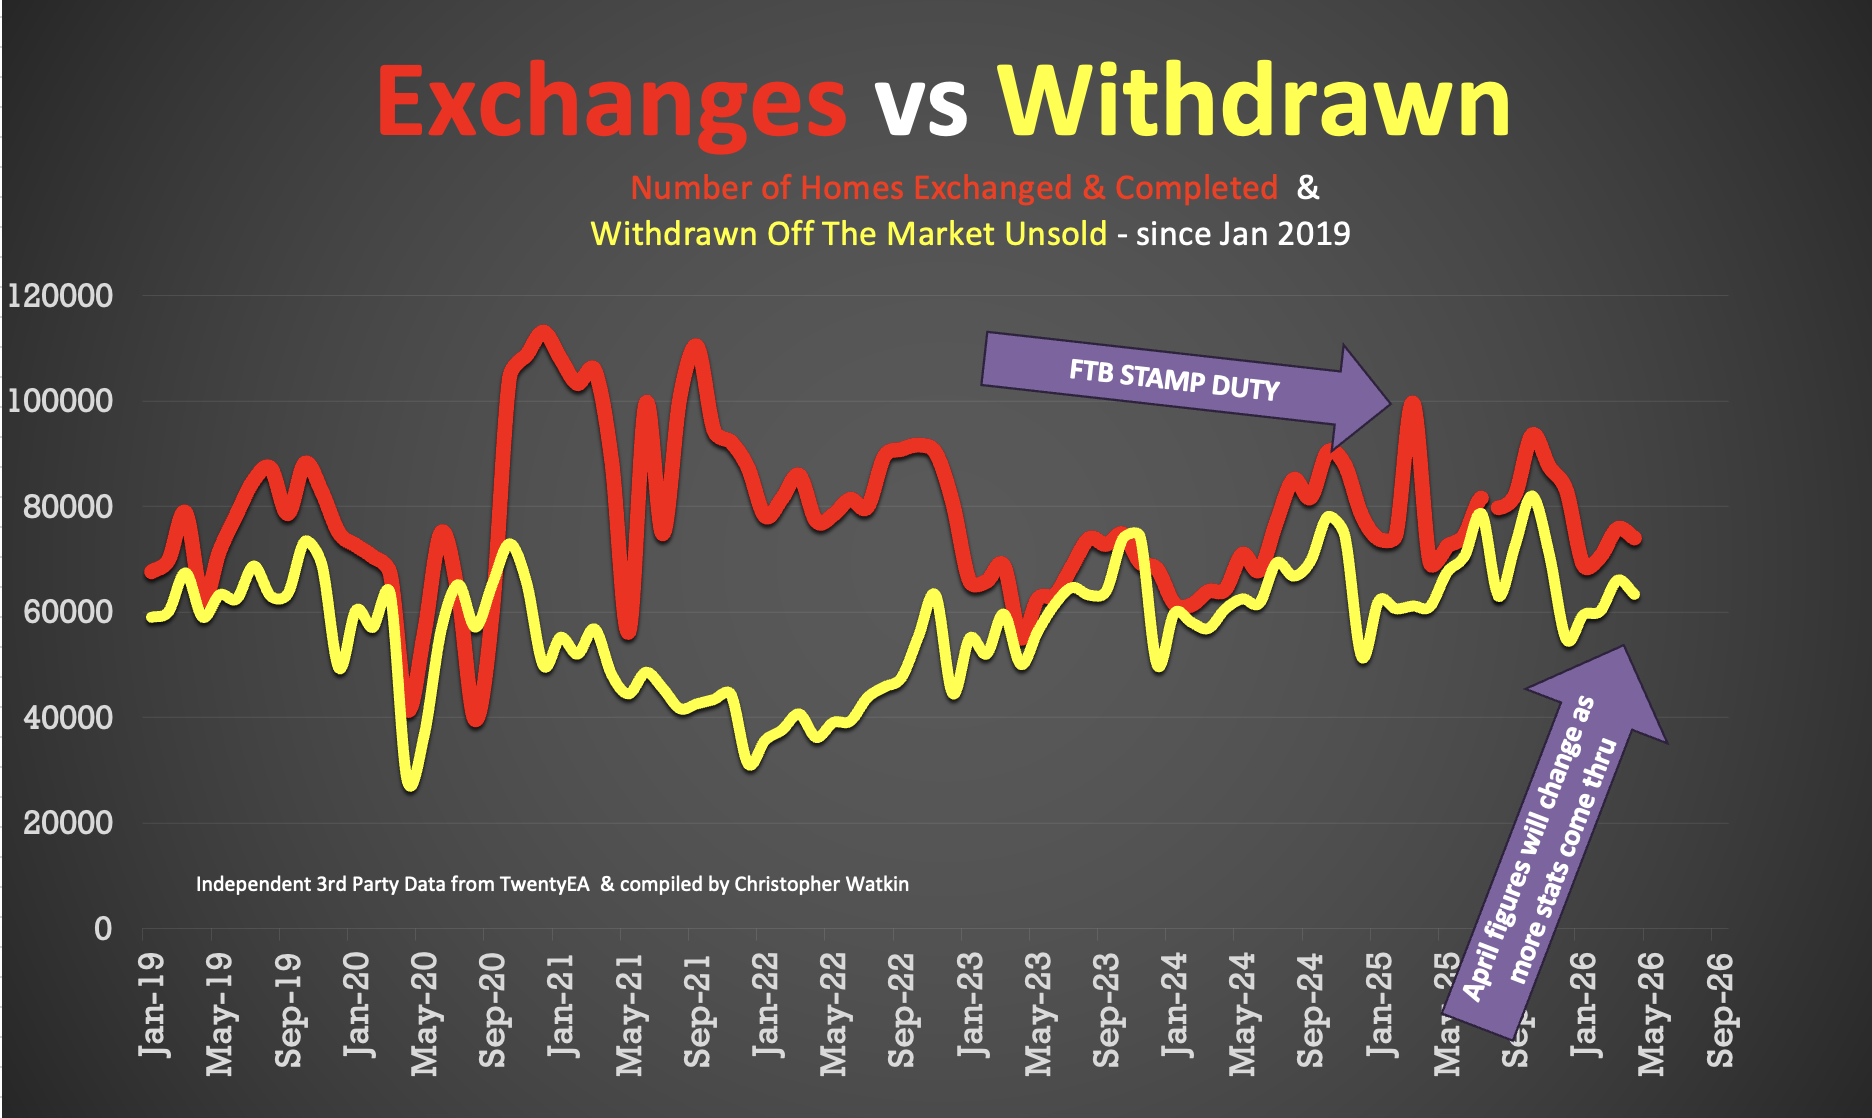
🟩 Withdrawals
• April 2026 – 63,418 Withdrawals (compared to 61,085 in April 2025).
• Concerning that 46.1% of all homes leaving UK Estate Agent books go unsold.
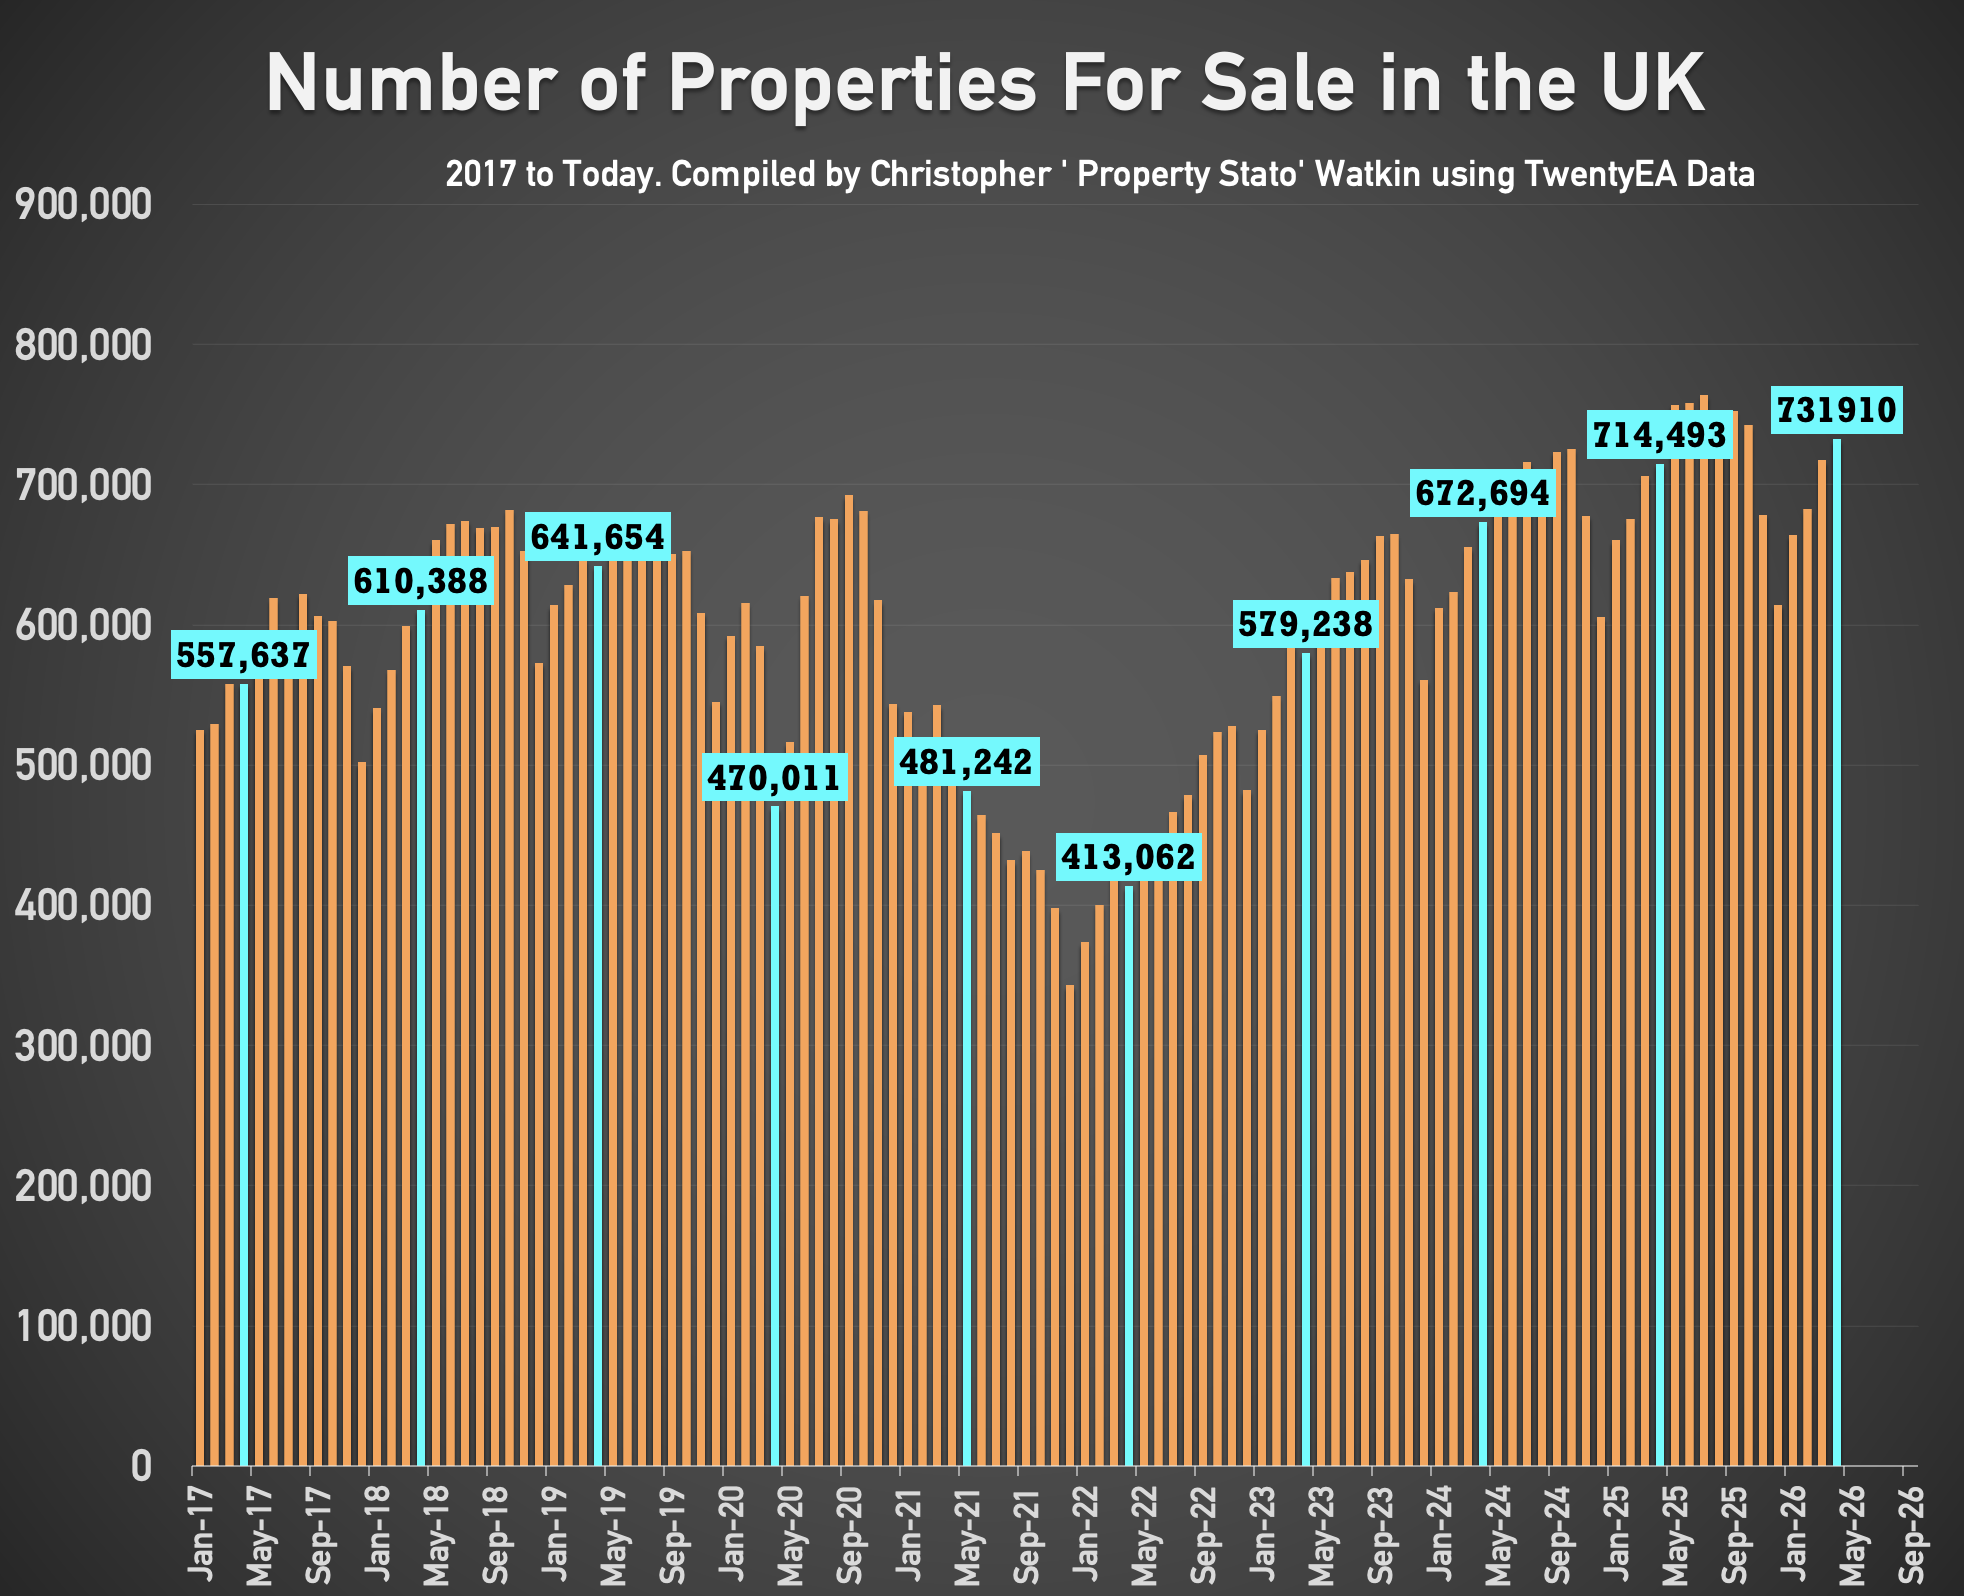
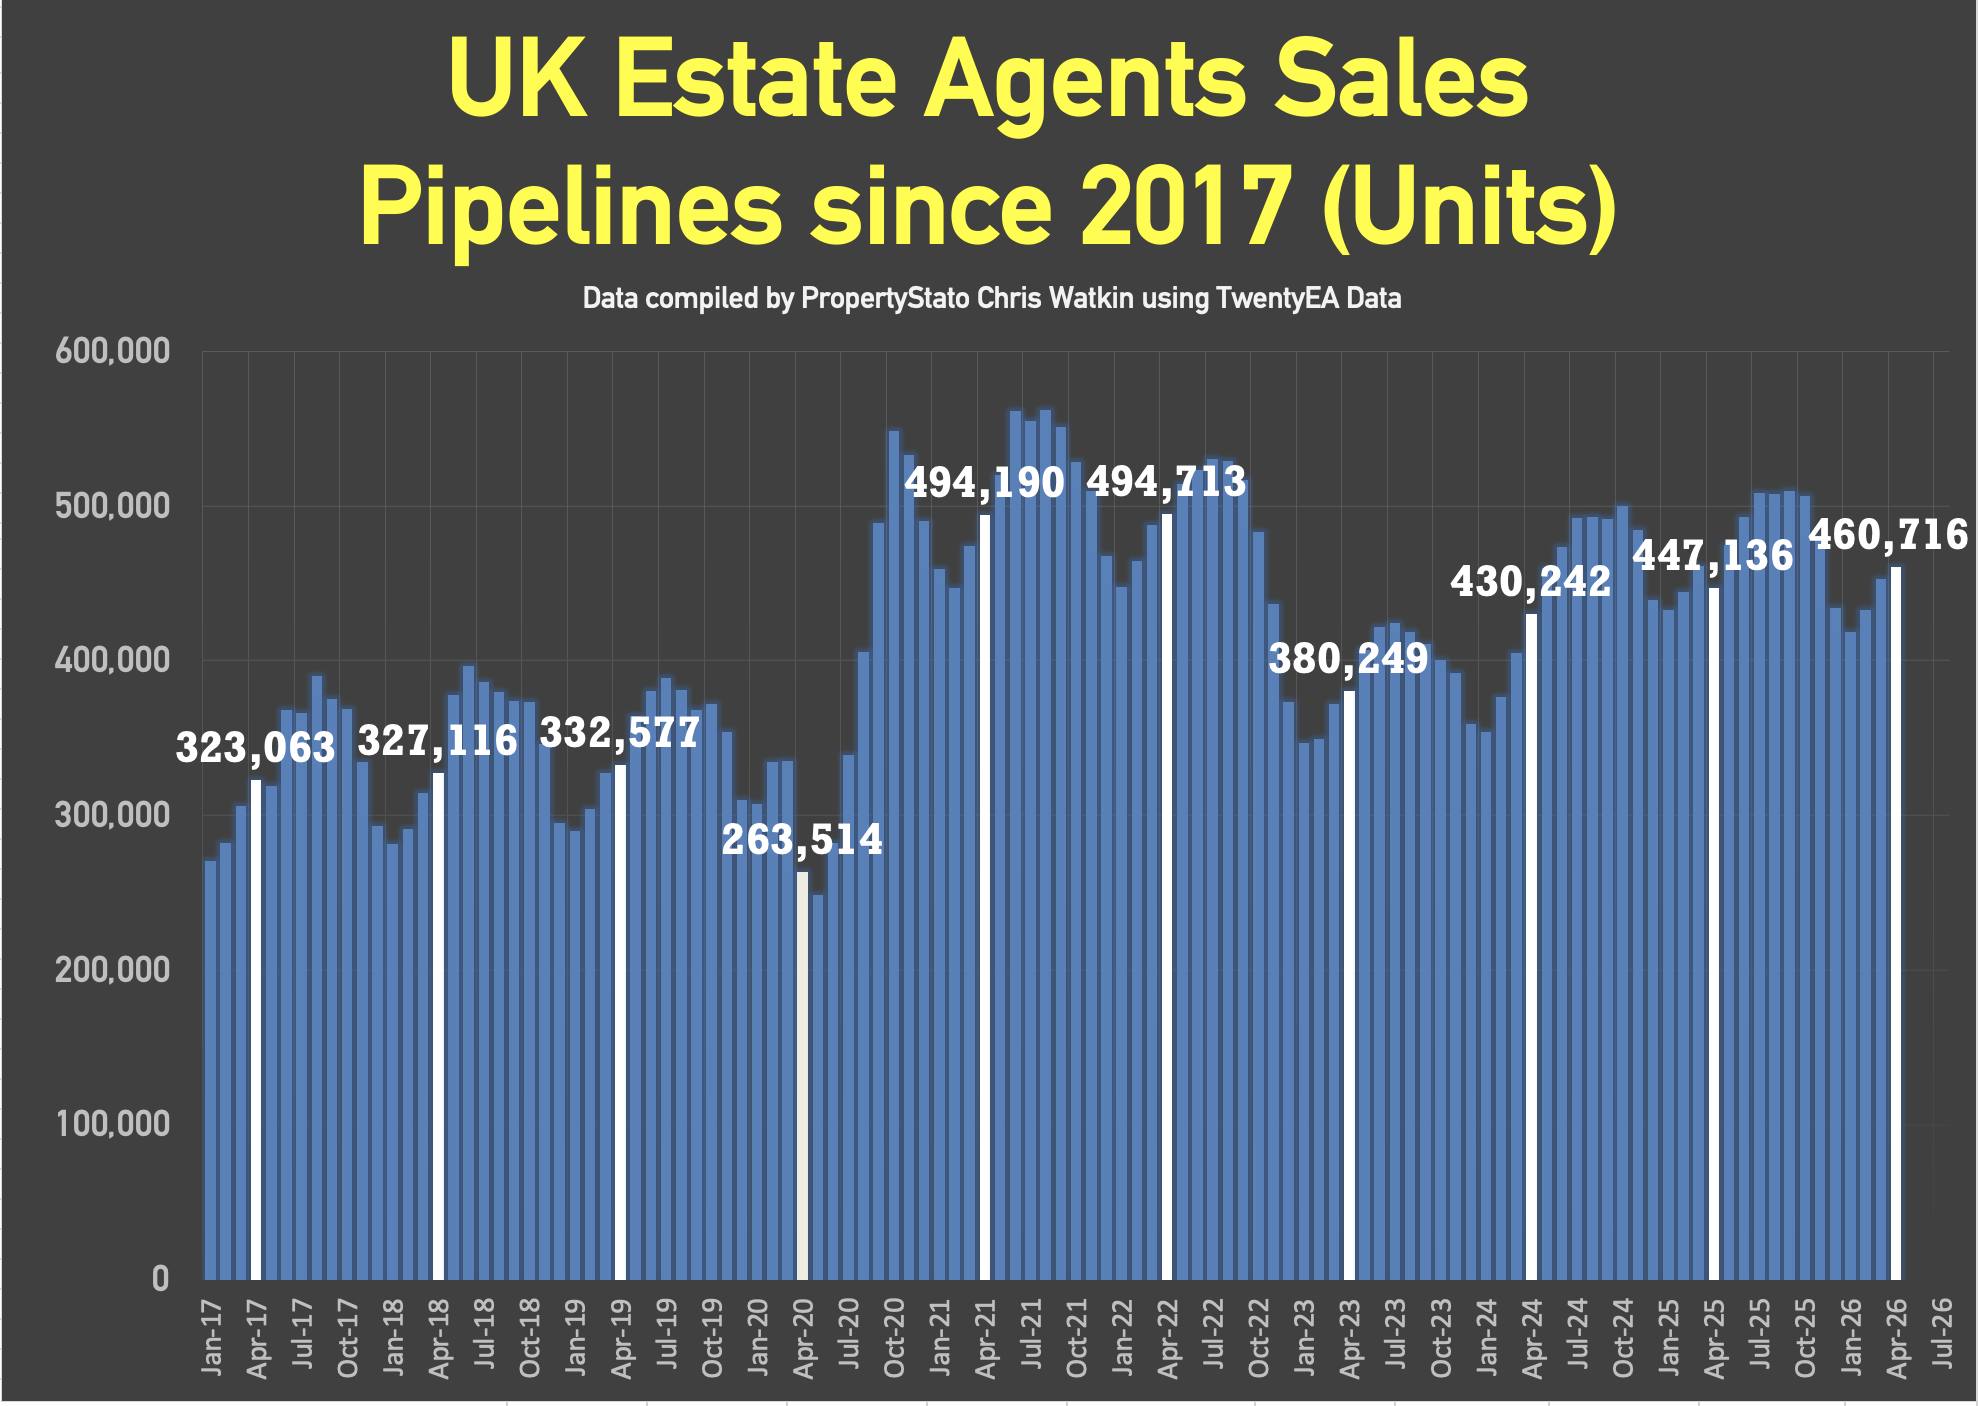
🟩 Stock Levels
• 731k homes on the market on the 1st of May ’26. (714k – 1st May 25)
• 461k homes in agent’s sales pipeline on the 1st May 2026, slightly higher than 12 months ago on 1st May ’25 (447k).
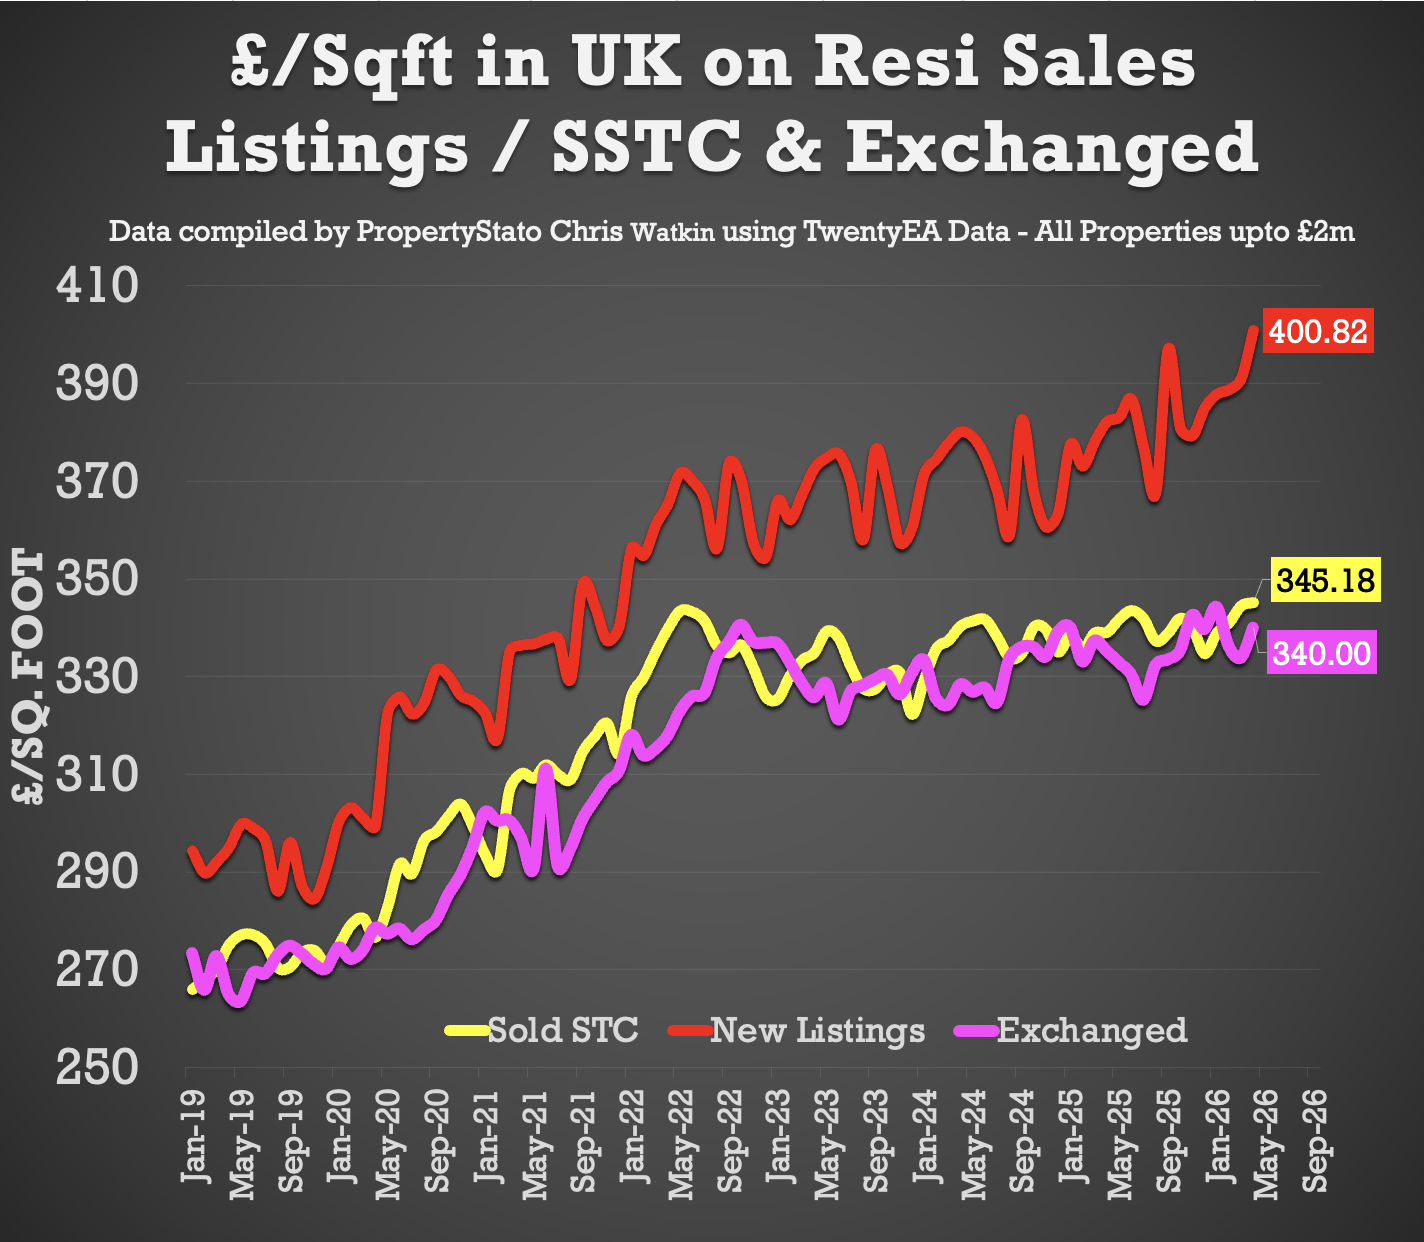
🟩 House Prices (£/sq.ft)
• April ’26 agreed sales averaged £345.18 per sq.ft. 1.8% higher than 12 months ago (£339.10) and 11.3% than 5 years ago (£310.18).
The £/sqft at sale agreed matches the HM Land Registry Index with a 98% accuracy, 5 months in advance. That is why it is so important.
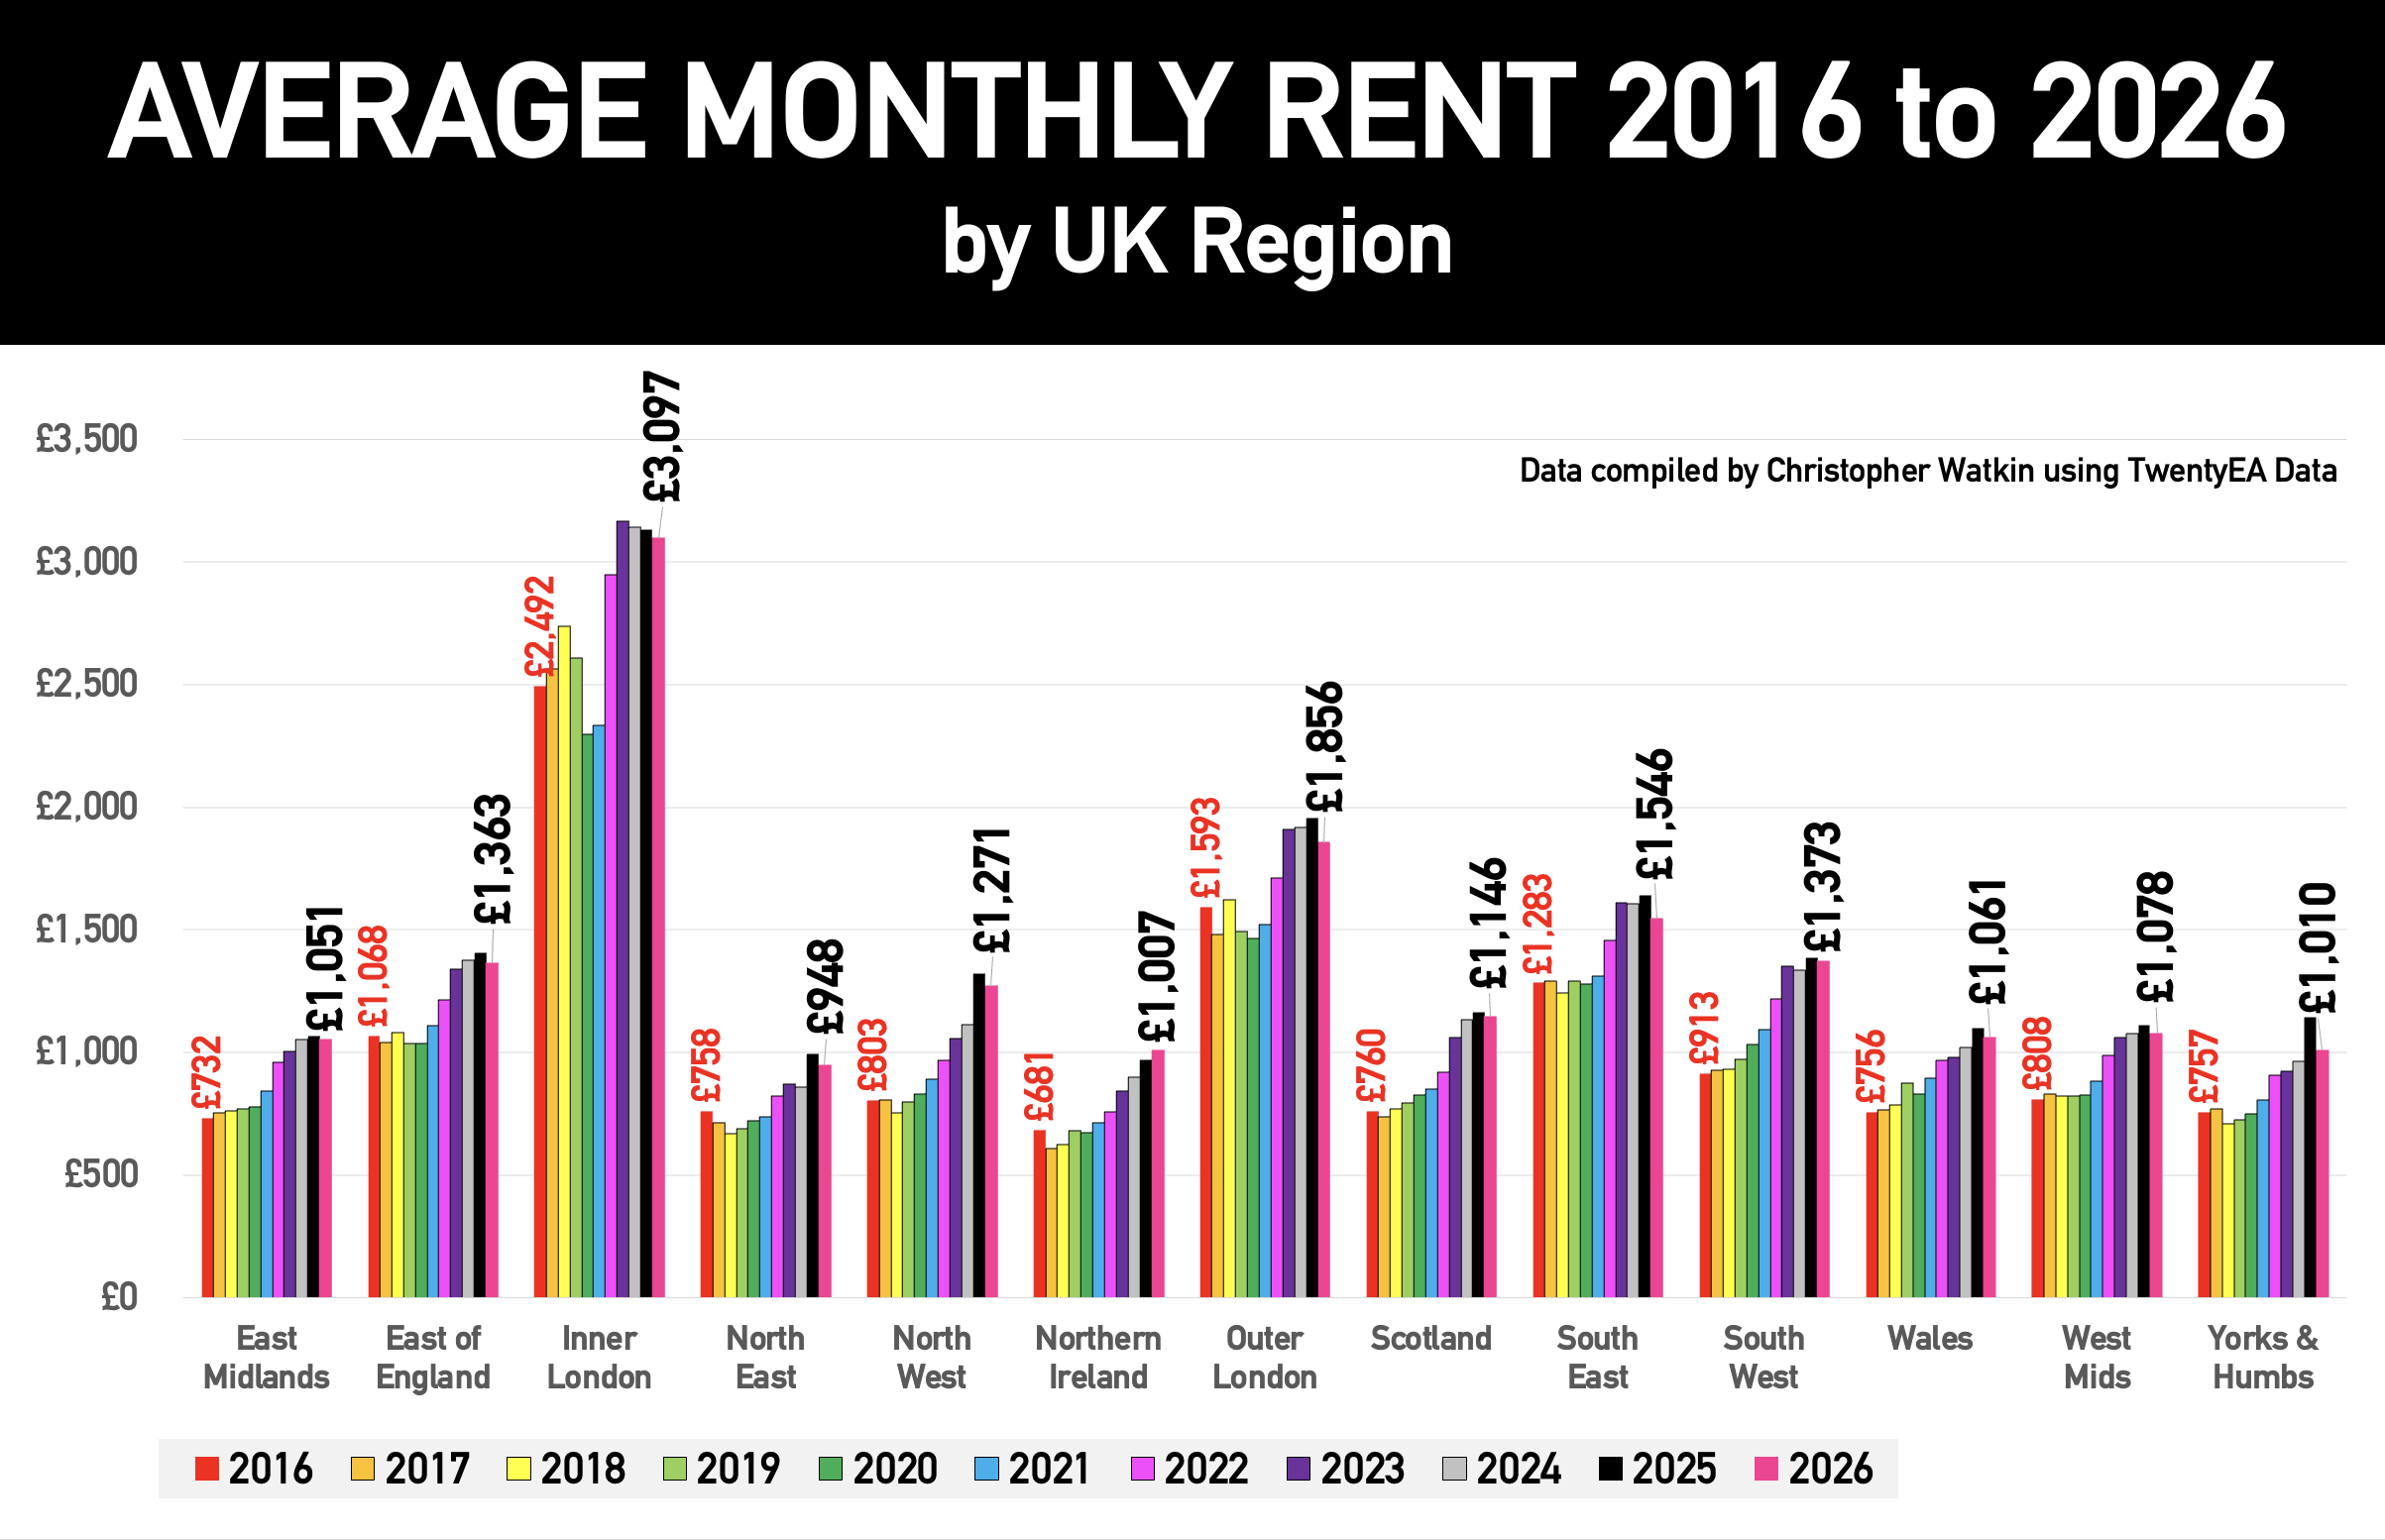
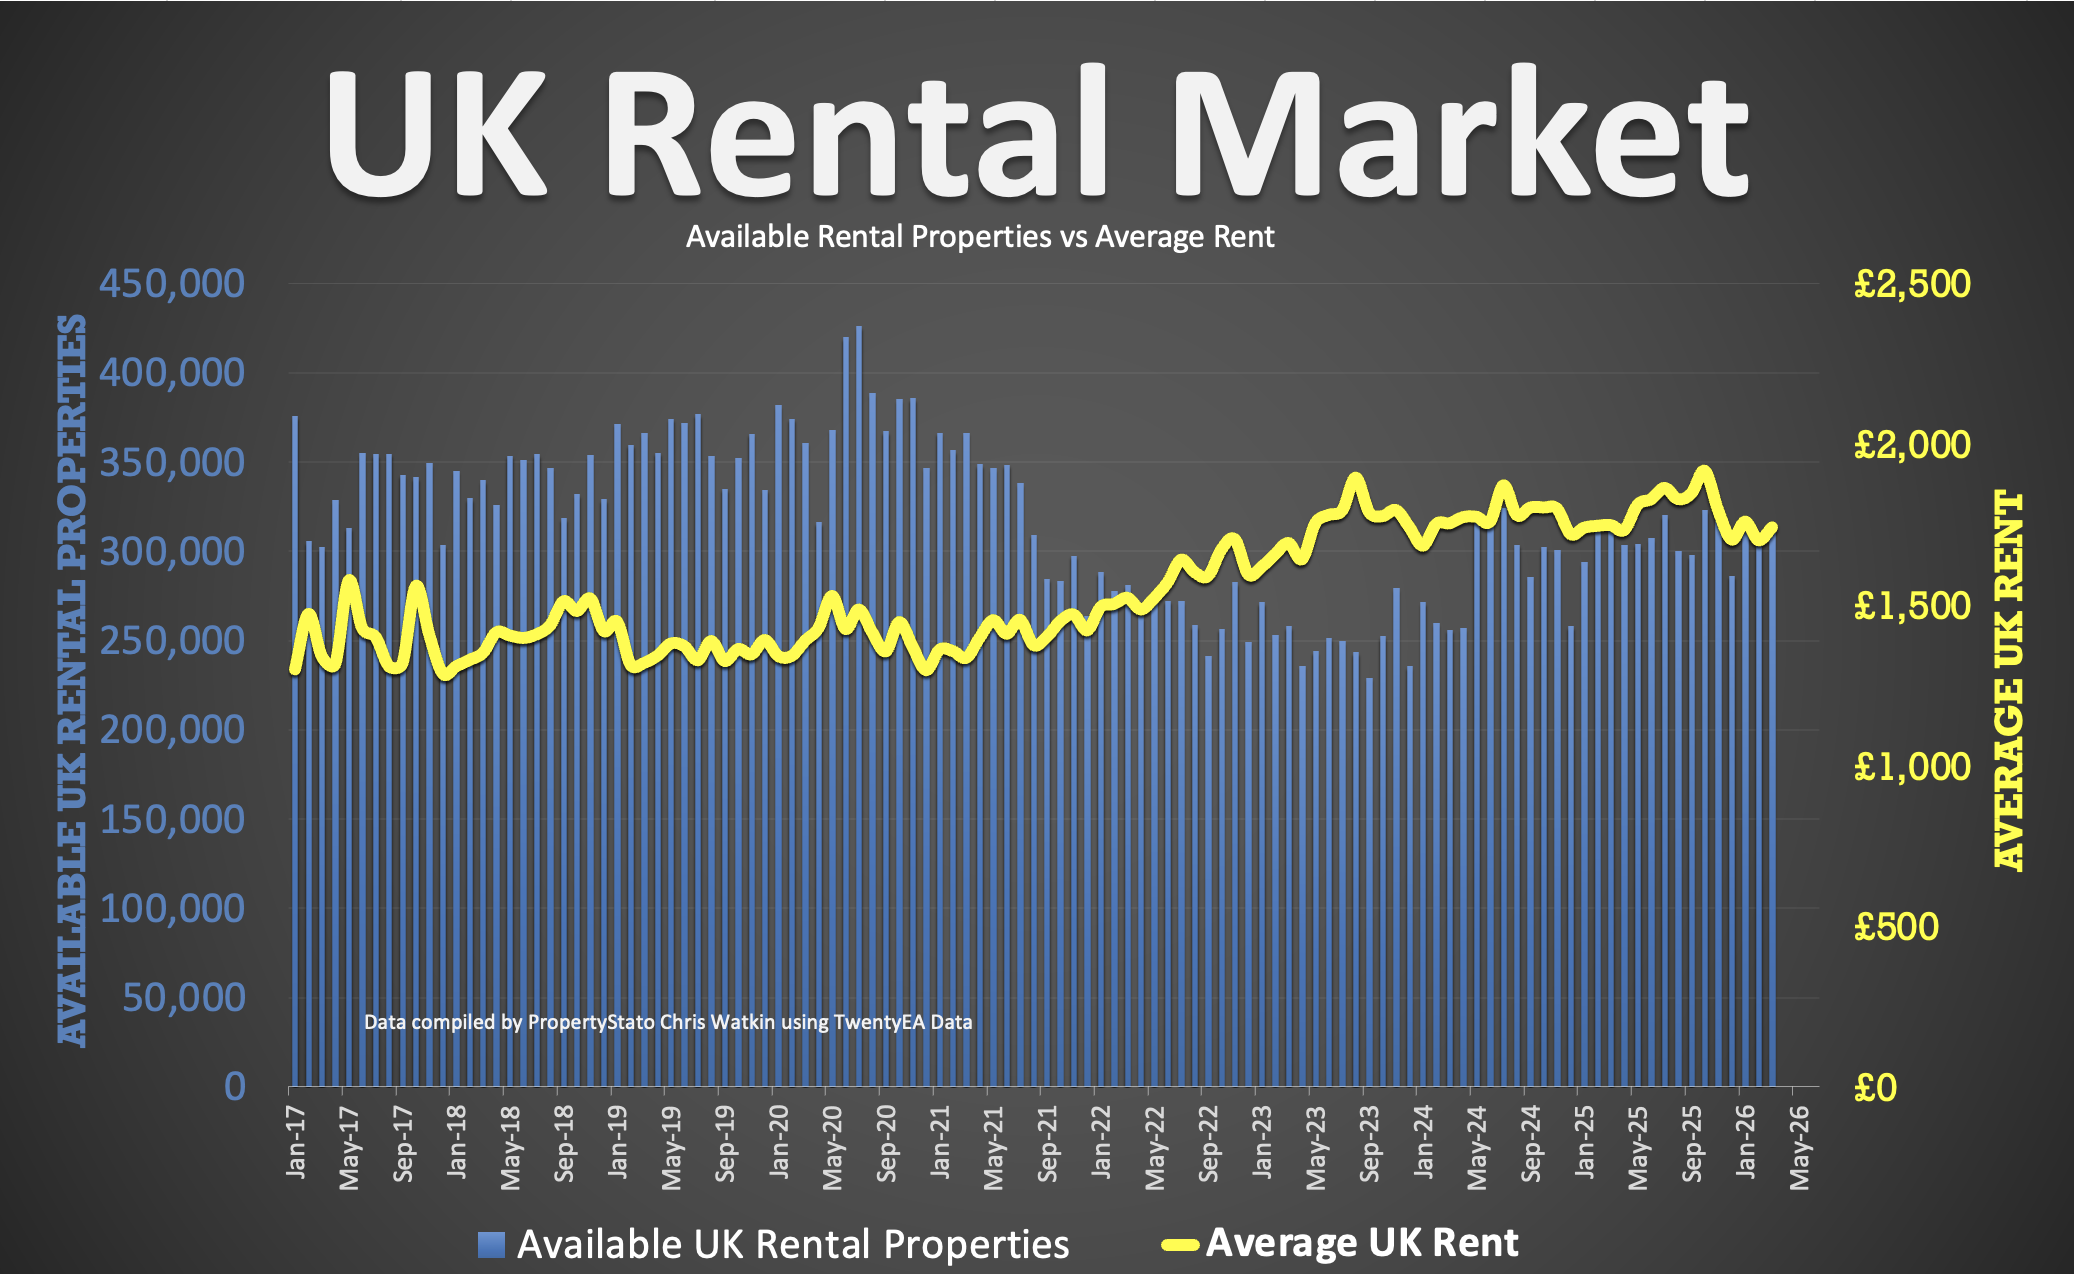
🟩 UK Rental Data
• Average Rent in Wk 19 – £1,817 pcm
• Average Rent in May 2026 – £1,778 pcm (£1,779 in May 25)
• Average Rent in YTD 2026 – £1,742 pcm
• 302k UK Rental Stock available to rent in April 26 (303k in April 2025).
🟩 Local Focus
Scunthorpe


