

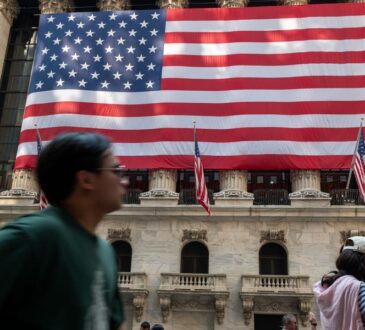
Investors panicked when the U.S. attacked Iran in late February. The S&P 500 (SNPINDEX: ^GSPC) fell nearly 8% over the following month as missiles and drones disrupted shipping traffic through the Strait of Hormuz, causing the largest oil supply disruption in history.
However, investors’ anxiety eased when President Trump struck a more diplomatic tone in late March, and the ceasefire announced in early April cemented the rebound. Over the eight-week period that ended May 22, the S&P 500 advanced 17.3%, the second-best eight-week rally in history.
Missed Nvidia in 2009? This Rare Signal Is Flashing Again. In 2009, a “Double Down” signal flashed for a little-known chipmaker called Nvidia. For the first time in years, that same “Total Conviction” signal is flashing for a company 1/100th the size of Nvidia. Continue »
The stock market maintained its momentum last week. The S&P 500 has now climbed 19% since March 27 and closed higher in nine straight weeks, its longest win streak since 2023. And history says the index is likely to maintain its upward trajectory during the next year.

The S&P 500’s incredible nine-week win streak hints at more upside
The S&P 500 has now posted positive returns for nine straight weeks, something it has only done 10 other times since it was created in 1957. While past performance is never a guarantee of future results, we can examine those incidents to make an educated guess about the future.
The chart below lists the S&P 500’s previous nine-week win streaks and shows how the index performed in the subsequent year.
|
S&P 500’s 9-Week Win Streak Ends |
S&P 500’s 12-Month Return |
|---|---|
|
May 1957 |
(8%) |
|
October 1958 |
11% |
|
February 1961 |
12% |
|
May 1963 |
15% |
|
September 1963 |
14% |
|
January 1964 |
13% |
|
November 1985 |
23% |
|
September 1989 |
(9%) |
|
January 2004 |
2% |
|
December 2023 |
24% |
|
Average |
10% |
Data source: Bluekurtic Market Insights.
As shown above, the S&P 500 has returned an average of 10% in the year following nine-week win streaks. That means the index will climb 10% to hit 8,338 by May 2027 if its performance matches the historical average.
However, the S&P 500’s recent nine-week win streak was particularly exceptional, as the index added 17.3% during the first eight weeks, its second-best eight-week stint in history. Following eight-week win streaks where the S&P 500 added at least 15%, the index has returned an average of 16% over the next year.
So what? The S&P 500 closed at 7,473 on May 22 (the day its eight-week gain reached 17.3%). History says the index will advance 16% to 8,669 during the next year, implying 14% upside from its current level of 7,580.


