The Canadian dollar has weakened materially against the U.S. dollar this year, trading near the bottom of its year-to-date range after falling roughly 3.5% to 4% over the first half of the year. The move has been too broad and too closely tied to the repricing of U.S. assets to be read as a purely Canada-specific story. Instead, CAD weakness looks like one expression of a wider shift back toward U.S. dollar exposure, as markets moved away from earlier expectations that the Fed would be able to ease policy more quickly than other central banks.
That distinction matters for the outlook. If the loonie were simply being marked down on domestic concerns, the path forward would depend mainly on Canadian growth, inflation, and Bank of Canada policy. But if the larger force is renewed demand for U.S. dollar assets, CAD is more exposed to the broader global regime: how investors are pricing U.S. growth, U.S. rates, and the relative appeal of holding dollars versus other currencies. The recent evidence points more strongly to the second interpretation.
Loonie vs. Other Currencies
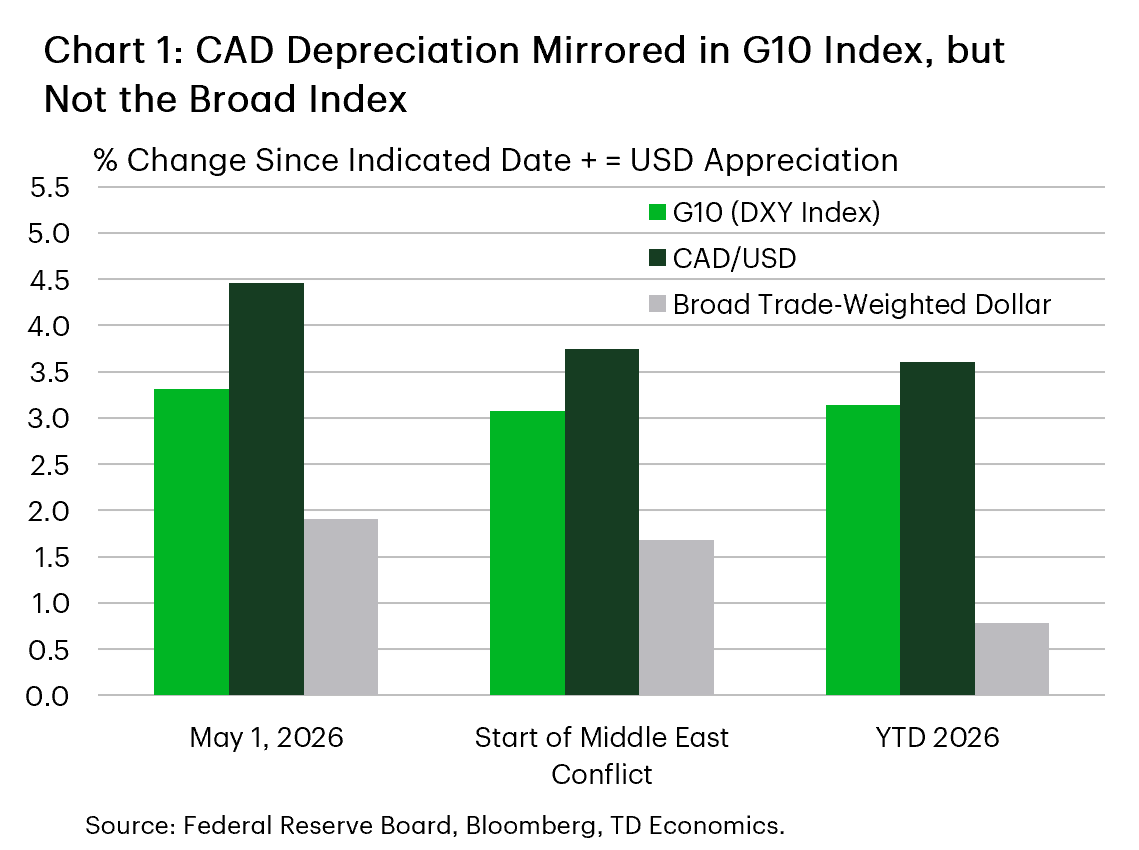
The cross-currency evidence supports this broader framing, but it is important to distinguish between different ways of measuring the U.S. dollar. DXY, the commonly cited “dollar index,” tracks the dollar against a small group of major currencies, with the euro carrying by far the largest weight. That makes it useful as a quick read on dollar strength against major advanced-economy currencies, but less representative of how the dollar is moving against the full set of U.S. trading partners. Chart 1 shows that the latest dollar strength has been concentrated most heavily in the currencies that matter most for DXY, while the Federal Reserve’s broader dollar index shows a more mixed pattern across the United States’ 26 largest trading partners.
A closer inspection of the currencies in the broad index is offered in Chart 2. There, we can see three groups: the first group contains the currencies that have borne a disproportionate share of the latest dollar move, including the euro, loonie, Korean won, Indian rupee, and the Japanese yen. These are large, liquid currencies that carry meaningful weight in most dollar indexes, so their weakness helps explain why the bilateral CAD move has felt severe even though it is not isolated.
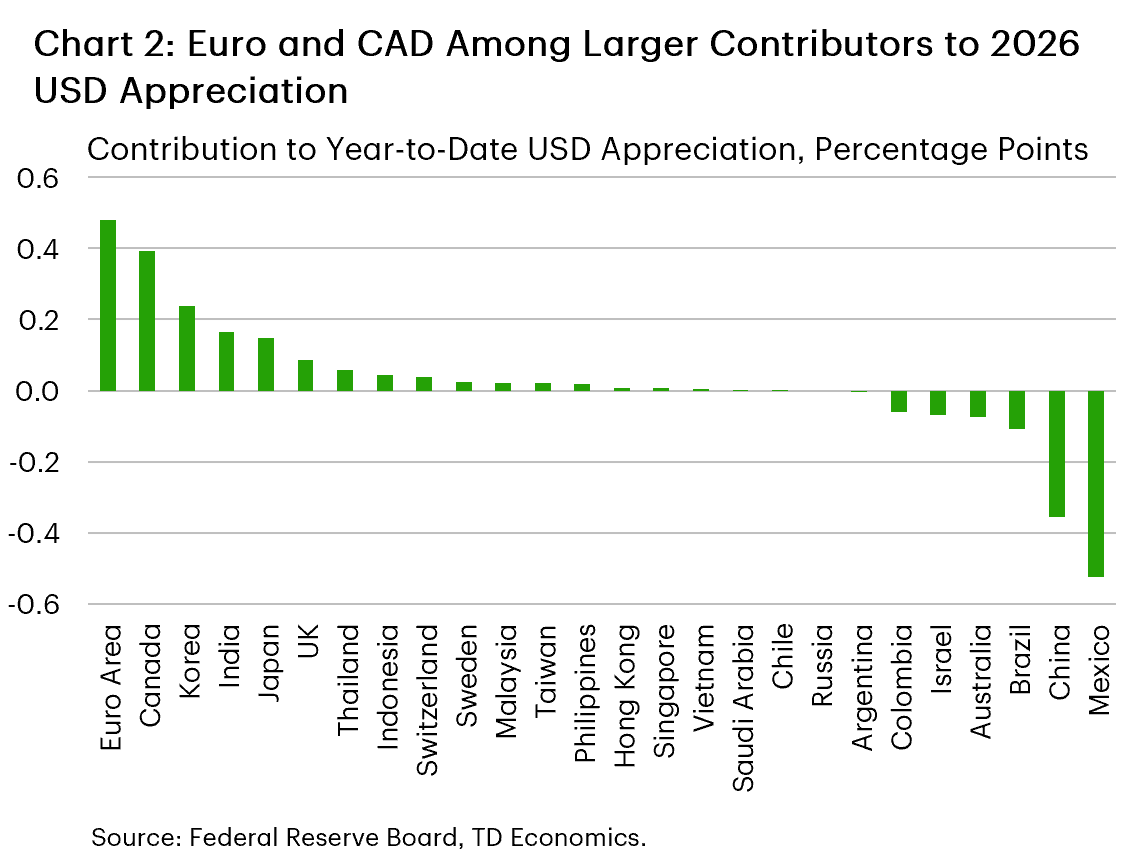
A second group has moved against the broader trend, led by the Mexican peso and Chinese renminbi. The peso is the clearest outlier, supported by high real rates, resilient domestic growth, and optimism around nearshoring, while the renminbi has been steadier than China’s soft domestic backdrop would otherwise suggest, helped by policy management and efforts to limit sharp currency moves.
Most remaining currencies sit closer to the middle, moving broadly in line with the aggregate dollar move rather than clearly standing out in either direction.
This split reinforces that CAD has weakened because the dollar backdrop became more supportive, but the intensity of the move also depends on its own mix of growth, rates, policy credibility, and investor positioning. Canada fell into the group where the case for holding local currency became less compelling relative to the U.S. dollar, leaving the loonie more vulnerable once capital began moving back toward USD assets. We consider the usual candidate explanations for this development below.
Signs of Preference for the USD Coming Back
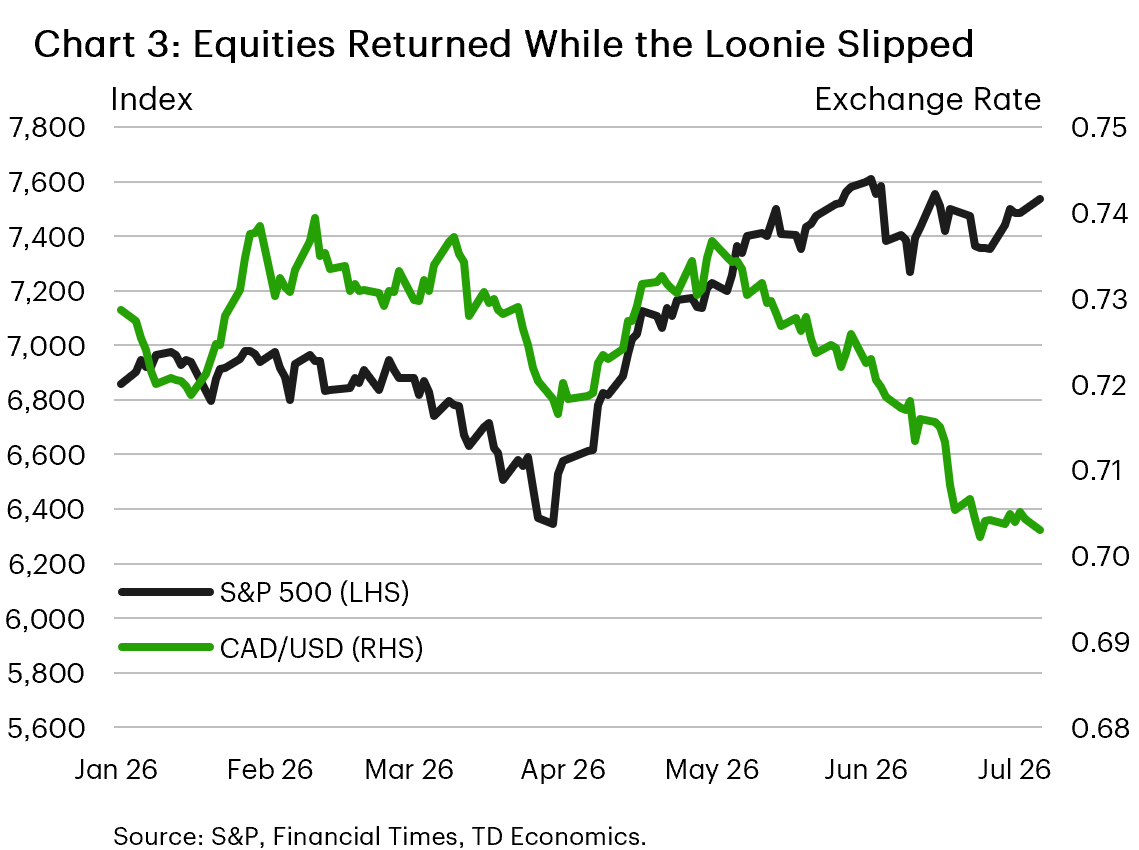
The timing of the move points to renewed preference for U.S. dollar exposure rather than a stand-alone CAD selloff. Chart 3 compares equities with CAD/USD and shows that the loonie started to weaken in May after the U.S. equity markets had recovered. That rebound helped confirm that markets had moved into a more comfortable risk backdrop and capital increasingly gravitated toward the U.S. dollar.
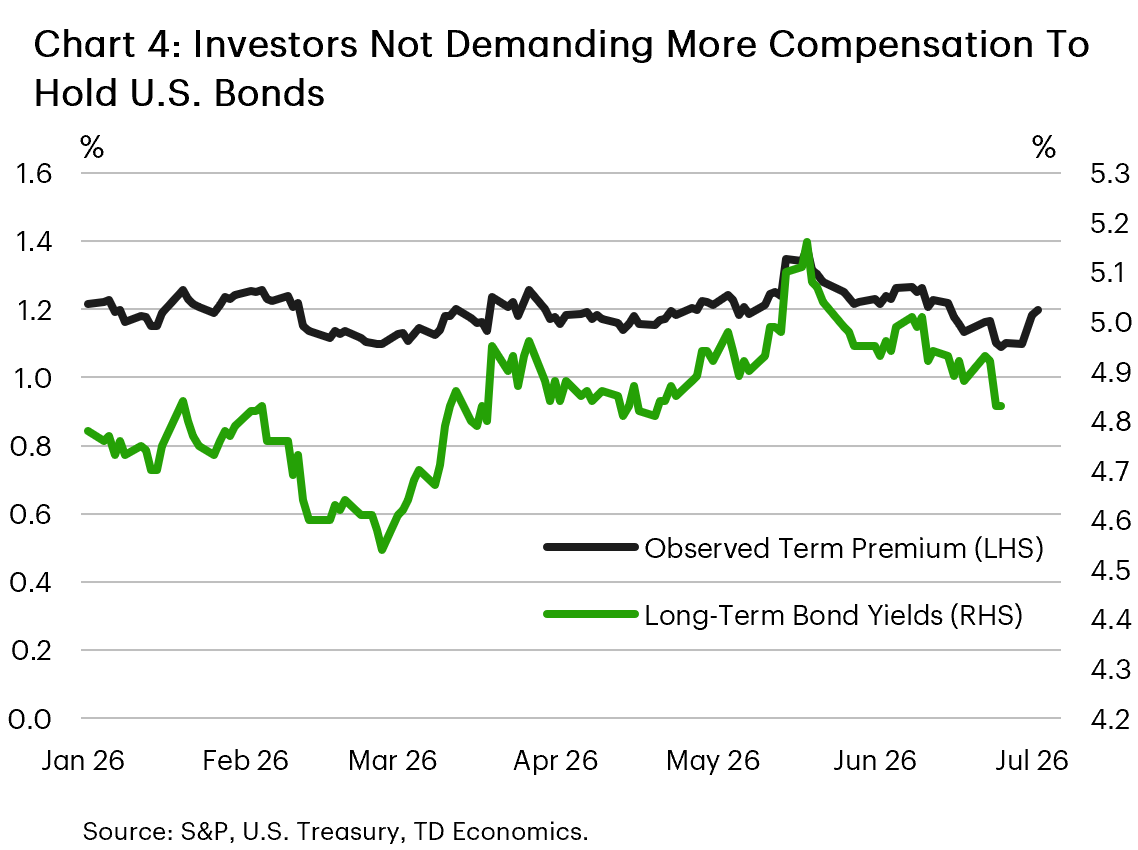
The bond market tells a similar story (Chart 4). Since mid-May, long-term Treasury yields and the observed term premium have moved lower, consistent with renewed demand for U.S. duration and a stronger preference for USD assets. Taken together, the equity and bond signals suggest that the market regime shifted from broad risk repair into a more dollar-centric phase, where investors were willing to take risk but preferred to do so through U.S. assets.
Limited Evidence of a Flight to Safety
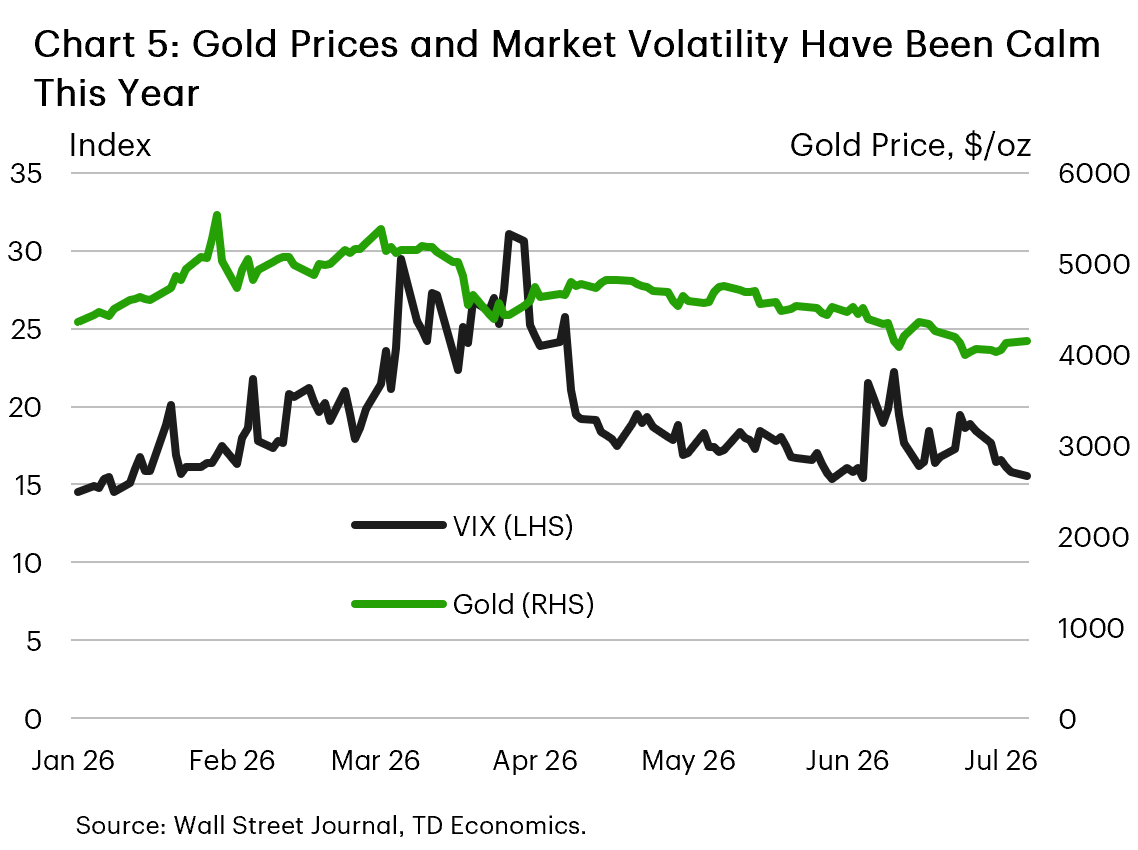
That distinction is important because the evidence for a classic flight-to-safety move is not especially convincing. If investors were simply rushing into safe havens, we would expect to see more persistent stress signals across markets. Instead, as shown in Chart 5, the VIX has retraced its earlier spike and gold prices have fallen over this period, weakening the case that CAD weakness is mainly being driven by generalized risk aversion. Other usual safe-haven currencies such as the euro, Swiss franc, and yen have also depreciated against the U.S. dollar this year. The cleaner interpretation is that investors have not abandoned risk altogether; they have become more selective, with U.S. assets and the dollar standing out as the preferred destination.
That leads naturally to the next driver: interest-rate differentials. The preference for USD assets and widening rate differentials are mutually reinforcing: stronger demand for U.S. exposure helps explain the direction of the move, while the growing U.S. rate advantage has made that preference more durable and intensified the pressure on currencies like the loonie.
Interest Rate Differentials
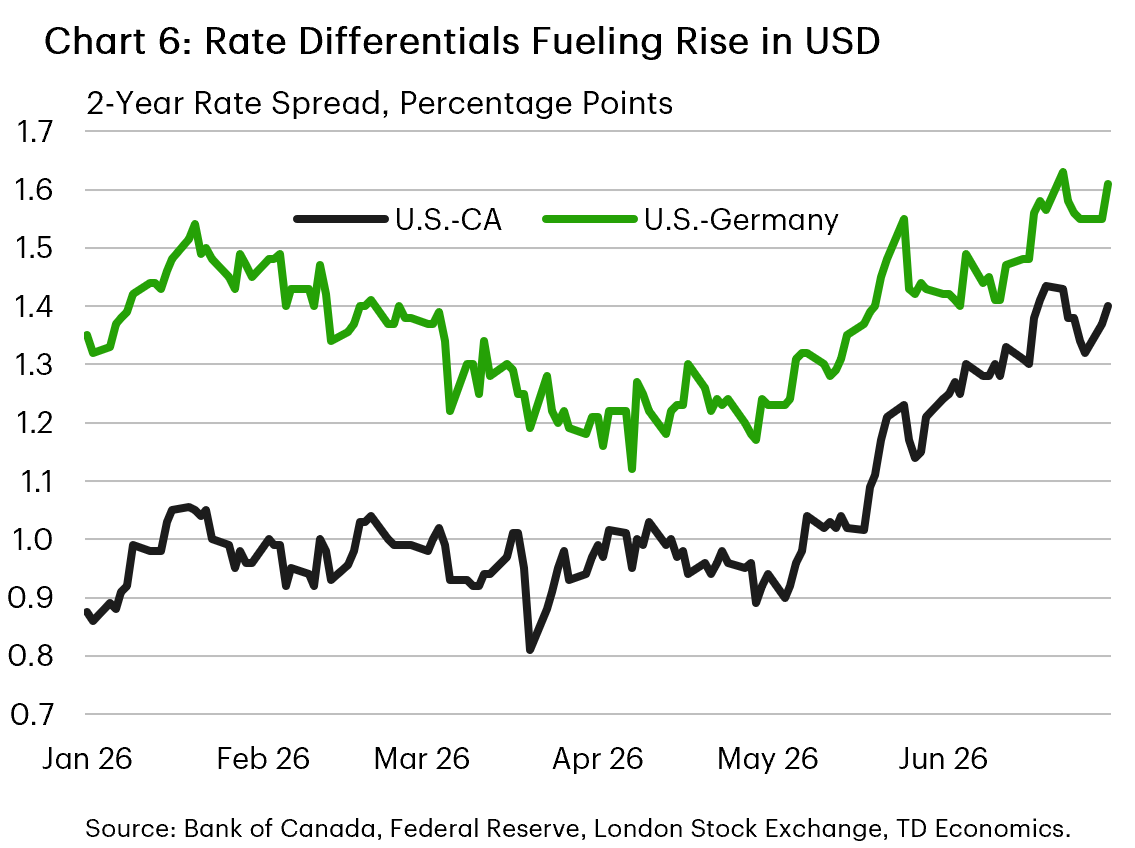
With the start of the war in the Middle East and the push higher on inflation, market expectations for Fed policy changed sharply, pricing in the possibility of Fed rate hikes. This was a sharp reversal from the prevailing sentiment prior to the conflict that the Fed was going to be the lone central bank reducing interest rates in 2026. The means the prior expectation for spreads on borrowing costs between the U.S. and other countries to narrow quickly reversed. The shift is most evident in short-term interest rate spreads between the U.S. and Canada and Germany (Chart 6).
The result of the policy divergence is that spreads vis-à-vis the U.S. on two-year government debt have widened by 25 basis points (bps) and 40 bps for Germany and Canada in the first half of 2026, respectively. The relatively smaller change in Germany is courtesy of a recent hike from the European Central Bank, whereas a dovish Bank of Canada has opted to stay on the sidelines. The widening premium to hold U.S. assets over other countries has helped to lift demand for the dollar, at the expense of other advanced economy currencies like the loonie and euro.
The Path Forward, the Productivity Wildcard and the Loonie
The outlook for the loonie now turns on whether those interest-rate gaps begin to narrow. Our baseline remains that U.S. inflation and growth will moderate in the coming months, allowing the Fed to gradually reduce the fed funds rate to 3.25% in 2027. That would take some pressure off the CAD by lowering the relative return on U.S. dollar assets.
The main risk is that the U.S. economy proves strong enough to keep those rate differentials wider for longer. There are two ways this could happen. The first is a more cyclical scenario, where the energy shock fades but U.S. demand remains firm enough to leave the economy in excess demand. In that case, the Fed would have less room to cut rates without risking renewed inflation pressure.
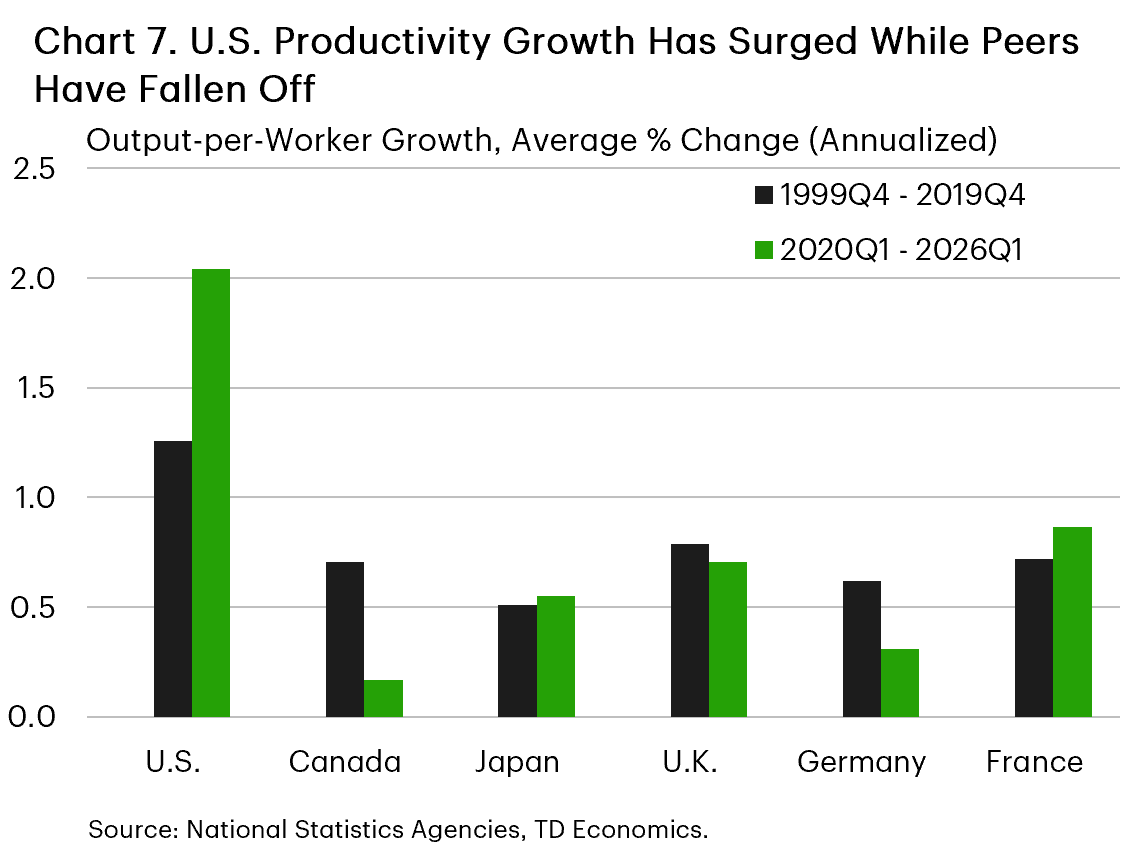
The second, more structural risk is that the productivity gap between the U.S. and its peers does not narrow back toward historical norms. This matters because stronger productivity growth can allow the U.S. economy to sustain faster growth and higher real rates without generating the same inflation pressure. If that advantage persists, the neutral rate in the U.S. could settle higher than in Canada and other advanced economies.
The recent data point in that direction. Since 2020Q1, U.S. output per worker has grown by 2.0% annualized, compared with 1.3% in the 20 years before the pandemic. Canada and other G7 economies have fallen further behind, held back by a mix of weaker capital deepening, softer business investment, and other structural headwinds (Chart 7). Stronger U.S. productivity growth helps explain how the economy has continued to outperform despite materially higher interest rates.
The implication for CAD is straightforward. If stronger U.S. productivity keeps the neutral rate higher, the Fed may not need to deliver as much rate relief as markets currently expect. U.S. short-term rates would remain elevated relative to Canada, preserving the yield advantage that has already helped pull capital toward U.S. assets.
That would leave the loonie vulnerable even if domestic conditions unfold broadly as expected. The baseline still points to some CAD recovery as U.S. rates eventually move lower, but a sustained U.S. productivity advantage would delay that adjustment by keeping rate and growth differentials tilted in favour of the dollar.
Under that scenario, the appreciation expected through the rest of 2026 and into 2027 would likely fail to materialize. Instead, CAD could remain stuck in the 71-72 U.S. cent range into mid-2027, as wider rate and growth differentials continue to make U.S. assets relatively more attractive.