
In the US market on the 18th, $Invesco QQQ Trust (QQQ.US)$ fell about 1.7%, $SPDR S&P 500 ETF (SPY.US)$ dropped roughly 0.7%, $iShares Russell 2000 ETF (IWM.US)$ and declined by approximately 1.3%.
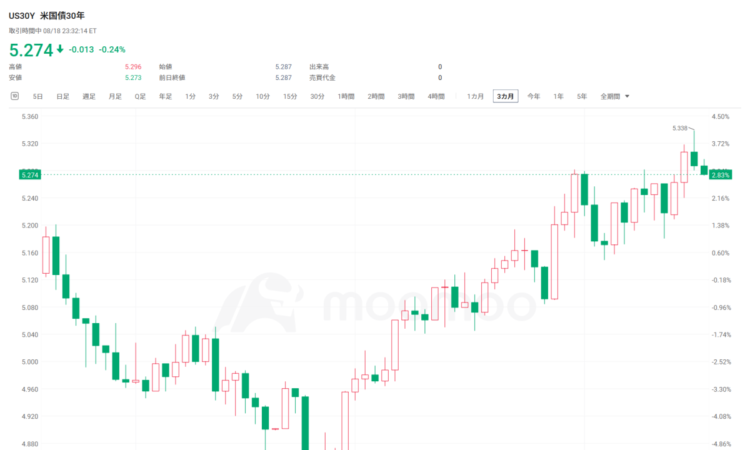
![Market Trends and Catalysts In the US market on the 18th, $Invesco QQQ Trust (QQQ.US)$ fell about 1.7%, $SPDR S&P 500 ETF (SPY.US)$ dropped about 0.7%, $iShares Russell 2000 ETF (IWM.US)$ and declined about 1.3%. Underlying this is the fact that $U.S. 30-Year Treasury Bonds Yield (US30Y.BD)$ The yield on [US 10-Year Treasury Notes] rose to around 5.34% on August 17, reaching its highest level since 2007. On the 18th, it hovered around 5.27–5.30%. Additionally, amid tensions between the US and Iran and growing caution regarding the situation in the Strait of Hormuz, $Brent Last Day Financial Futures (DEC6) (BZmain.US)$ crude oil prices temporarily exceeded $88 per barrel, strengthening concerns about a reacceleration of inflation through energy prices. The market remained mindful that such inflationary pressures could narrow the Fed's room for rate cuts. The next focus is on the FOMC meeting minutes from the July 28–29 session, scheduled for release at 14:00 ET on August 19. At that meeting, while the policy rate was held steady at 3.50–3.75%, three regional Federal Reserve Bank presidents...](https://sgsnsimg.moomoo.com/sns_client_feed/181000010/20260819/web-1787110347258-lLHVOLxP0e.png/big?area=105&is_public=true&imageMogr2/ignore-error/1/format/webp)
The next focus is the FOMC meeting minutes from the July 28–29 session, scheduled for release at 14:00 ET on August 19. At that meeting, while the policy rate was held steady at 3.50–3.75%, three regional Fed presidents voted against the decision, advocating for a rate hike. If the minutes reaffirm a hawkish stance, upward pressure on long-term interest rates may persist, potentially weighing on the stock market.
It is important to note that while the macro factors driving the three indices are common, their sensitivity to interest rates differs.
$Invesco QQQ Trust (QQQ.US)$ In the options market, implied volatility (IV) is rising, primarily centered on large-cap tech stocks that are sensitive to increases in discount rates.
Constant Maturity IV rose from approximately 21.67% to 22.84%, an increase of about 1.17 points from the previous day. The simultaneous rise in IV alongside falling stock prices indicates heightened market caution. However, future direction cannot be determined solely by the combination of falling stock prices and rising IV.
The IV Rank is approximately 34, and the IV Percentile is around 43%, placing it in the middle of its historical range. The 30-day Historical Volatility (HV) is also near 23.47%, close to the current IV. At present, it is difficult to argue that IV is significantly overpriced relative to realized volatility.
![Market Trends and Catalysts In the US market on the 18th, $Invesco QQQ Trust (QQQ.US)$ fell about 1.7%, $SPDR S&P 500 ETF (SPY.US)$ dropped about 0.7%, $iShares Russell 2000 ETF (IWM.US)$ and declined about 1.3%. Underlying this is the fact that $U.S. 30-Year Treasury Bonds Yield (US30Y.BD)$ The yield on [US 10-Year Treasury Notes] rose to around 5.34% on August 17, reaching its highest level since 2007. On the 18th, it hovered around 5.27–5.30%. Additionally, amid tensions between the US and Iran and growing caution regarding the situation in the Strait of Hormuz, $Brent Last Day Financial Futures (DEC6) (BZmain.US)$ crude oil prices temporarily exceeded $88 per barrel, strengthening concerns about a reacceleration of inflation through energy prices. The market remained mindful that such inflationary pressures could narrow the Fed's room for rate cuts. The next focus is on the FOMC meeting minutes from the July 28–29 session, scheduled for release at 14:00 ET on August 19. At that meeting, while the policy rate was held steady at 3.50–3.75%, three regional Federal Reserve Bank presidents...](https://sgsnsimg.moomoo.com/sns_client_feed/181000010/20260819/web-1787110951630-g2q4FJrYVa.png/big?area=105&is_public=true&imageMogr2/ignore-error/1/format/webp)
The term structure is in a gentle contango. ATM IVs are approximately 19.52% for the August 21 expiration, 19.89% for September 18, and 20.80% for October 16, resulting in a difference of about -0.37 points between the near-term and mid-term expirations.
Ahead of the FOMC meeting minutes, event premiums are not concentrated solely on the near-term; volatility is also priced in for the mid-term and beyond, including the period following the event.
![Market Trends and Catalysts In the US market on the 18th, $Invesco QQQ Trust (QQQ.US)$ fell about 1.7%, $SPDR S&P 500 ETF (SPY.US)$ dropped about 0.7%, $iShares Russell 2000 ETF (IWM.US)$ and declined about 1.3%. Underlying this is the fact that $U.S. 30-Year Treasury Bonds Yield (US30Y.BD)$ The yield on [US 10-Year Treasury Notes] rose to around 5.34% on August 17, reaching its highest level since 2007. On the 18th, it hovered around 5.27–5.30%. Additionally, amid tensions between the US and Iran and growing caution regarding the situation in the Strait of Hormuz, $Brent Last Day Financial Futures (DEC6) (BZmain.US)$ crude oil prices temporarily exceeded $88 per barrel, strengthening concerns about a reacceleration of inflation through energy prices. The market remained mindful that such inflationary pressures could narrow the Fed's room for rate cuts. The next focus is on the FOMC meeting minutes from the July 28–29 session, scheduled for release at 14:00 ET on August 19. At that meeting, while the policy rate was held steady at 3.50–3.75%, three regional Federal Reserve Bank presidents...](https://sgsnsimg.moomoo.com/sns_client_feed/181000010/20260819/web-1787110975365-0sxaJxRlFR.png/big?area=105&is_public=true&imageMogr2/ignore-error/1/format/webp)
The volume-based put/call ratio was approximately 1.14. While there is a slight bias toward puts, the skew is small, making it the most neutral among the three major indices.
![Market Trends and Catalysts In the US market on the 18th, $Invesco QQQ Trust (QQQ.US)$ fell about 1.7%, $SPDR S&P 500 ETF (SPY.US)$ dropped about 0.7%, $iShares Russell 2000 ETF (IWM.US)$ and declined about 1.3%. Underlying this is the fact that $U.S. 30-Year Treasury Bonds Yield (US30Y.BD)$ The yield on [US 10-Year Treasury Notes] rose to around 5.34% on August 17, reaching its highest level since 2007. On the 18th, it hovered around 5.27–5.30%. Additionally, amid tensions between the US and Iran and growing caution regarding the situation in the Strait of Hormuz, $Brent Last Day Financial Futures (DEC6) (BZmain.US)$ crude oil prices temporarily exceeded $88 per barrel, strengthening concerns about a reacceleration of inflation through energy prices. The market remained mindful that such inflationary pressures could narrow the Fed's room for rate cuts. The next focus is on the FOMC meeting minutes from the July 28–29 session, scheduled for release at 14:00 ET on August 19. At that meeting, while the policy rate was held steady at 3.50–3.75%, three regional Federal Reserve Bank presidents...](https://sgsnsimg.moomoo.com/sns_client_feed/181000010/20260819/web-1787110992058-K9d4WuEN3H.png/big?area=105&is_public=true&imageMogr2/ignore-error/1/format/webp)
Open interest is also relatively balanced. As of the finalized open interest on August 17, the put/call ratio was approximately 1.22, indicating a slight excess of puts. Both volume and open interest lean slightly toward the put side, but trading direction cannot be judged based on open interest alone.
![Market Trends and Catalysts In the US market on the 18th, $Invesco QQQ Trust (QQQ.US)$ fell about 1.7%, $SPDR S&P 500 ETF (SPY.US)$ dropped about 0.7%, $iShares Russell 2000 ETF (IWM.US)$ and declined about 1.3%. Underlying this is the fact that $U.S. 30-Year Treasury Bonds Yield (US30Y.BD)$ The yield on [US 10-Year Treasury Notes] rose to around 5.34% on August 17, reaching its highest level since 2007. On the 18th, it hovered around 5.27–5.30%. Additionally, amid tensions between the US and Iran and growing caution regarding the situation in the Strait of Hormuz, $Brent Last Day Financial Futures (DEC6) (BZmain.US)$ crude oil prices temporarily exceeded $88 per barrel, strengthening concerns about a reacceleration of inflation through energy prices. The market remained mindful that such inflationary pressures could narrow the Fed's room for rate cuts. The next focus is on the FOMC meeting minutes from the July 28–29 session, scheduled for release at 14:00 ET on August 19. At that meeting, while the policy rate was held steady at 3.50–3.75%, three regional Federal Reserve Bank presidents...](https://sgsnsimg.moomoo.com/sns_client_feed/181000010/20260819/web-1787111013108-67pC2ldH5C.png/big?area=105&is_public=true&imageMogr2/ignore-error/1/format/webp)
The 25-delta risk reversals were approximately -3.75 points for the August 21 expiration, -5.19 points for September 18, and -5.57 points for October 16.
Although the downward skew, where put IV exceeds call IV, persists, the near-term expiration shows the smallest negative magnitude among the three major indices.
![Market Trends and Catalysts In the US market on the 18th, $Invesco QQQ Trust (QQQ.US)$ fell about 1.7%, $SPDR S&P 500 ETF (SPY.US)$ dropped about 0.7%, $iShares Russell 2000 ETF (IWM.US)$ and declined about 1.3%. Underlying this is the fact that $U.S. 30-Year Treasury Bonds Yield (US30Y.BD)$ The yield on [US 10-Year Treasury Notes] rose to around 5.34% on August 17, reaching its highest level since 2007. On the 18th, it hovered around 5.27–5.30%. Additionally, amid tensions between the US and Iran and growing caution regarding the situation in the Strait of Hormuz, $Brent Last Day Financial Futures (DEC6) (BZmain.US)$ crude oil prices temporarily exceeded $88 per barrel, strengthening concerns about a reacceleration of inflation through energy prices. The market remained mindful that such inflationary pressures could narrow the Fed's room for rate cuts. The next focus is on the FOMC meeting minutes from the July 28–29 session, scheduled for release at 14:00 ET on August 19. At that meeting, while the policy rate was held steady at 3.50–3.75%, three regional Federal Reserve Bank presidents...](https://sgsnsimg.moomoo.com/sns_client_feed/181000010/20260819/web-1787111026125-C6yrQn6G4E.png/big?area=105&is_public=true&imageMogr2/ignore-error/1/format/webp)
In block trades, several near-term put purchases and bearish call sales were observed, while mixed bullish and bearish trades were seen prior to this. However, as we have not distinguished between structured trades and single-leg trades, the overall block flow should not be definitively labeled as bearish. Instead, it should be viewed as a trend within the visible trade samples. The confidence level is low to medium.
![Market Trends and Catalysts In the US market on the 18th, $Invesco QQQ Trust (QQQ.US)$ fell about 1.7%, $SPDR S&P 500 ETF (SPY.US)$ dropped about 0.7%, $iShares Russell 2000 ETF (IWM.US)$ and declined about 1.3%. Underlying this is the fact that $U.S. 30-Year Treasury Bonds Yield (US30Y.BD)$ The yield on [US 10-Year Treasury Notes] rose to around 5.34% on August 17, reaching its highest level since 2007. On the 18th, it hovered around 5.27–5.30%. Additionally, amid tensions between the US and Iran and growing caution regarding the situation in the Strait of Hormuz, $Brent Last Day Financial Futures (DEC6) (BZmain.US)$ crude oil prices temporarily exceeded $88 per barrel, strengthening concerns about a reacceleration of inflation through energy prices. The market remained mindful that such inflationary pressures could narrow the Fed's room for rate cuts. The next focus is on the FOMC meeting minutes from the July 28–29 session, scheduled for release at 14:00 ET on August 19. At that meeting, while the policy rate was held steady at 3.50–3.75%, three regional Federal Reserve Bank presidents...](https://sgsnsimg.moomoo.com/sns_client_feed/181000010/20260819/web-1787111051904-7dCOnUhkKF.png/big?area=105&is_public=true&imageMogr2/ignore-error/1/format/webp)
※ For QQQ, implied volatility (IV) has risen against the backdrop of a risk reassessment for large-cap tech stocks following the increase in long-term interest rates. Meanwhile, volume and open interest are the most balanced among the three indices, and the negative spread of risk reversals is relatively small. The key focus after the release of the FOMC minutes will be whether the downside skew deepens to levels comparable to SPY or IWM, or if hawkish sentiment remains limited, leading to a decline in near-term IV.
$SPDR S&P 500 ETF (SPY.US)$ While SPY has the lowest IV level among the three indices, the put ratio in existing open interest is exceptionally high. This reflects hedging demand against macro risks for overall equity portfolios in the options market.
IV stands at approximately 16.06%, up about 0.68 points from the previous day. The IV Rank is around 17, and the IV Percentile is approximately 29%, both low within the historical range. However, the 30-day historical volatility (HV) remains around 13.22%, meaning IV is slightly above realized volatility.
In other words, while IV is low compared to its historical range, it carries a certain volatility premium relative to current realized volatility. Since perceptions differ depending on the evaluation metric, it is difficult to simply judge IV as ‘cheap’ or ‘expensive’ at this time.
![Market Trends and Catalysts In the US market on the 18th, $Invesco QQQ Trust (QQQ.US)$ fell about 1.7%, $SPDR S&P 500 ETF (SPY.US)$ dropped about 0.7%, $iShares Russell 2000 ETF (IWM.US)$ and declined about 1.3%. Underlying this is the fact that $U.S. 30-Year Treasury Bonds Yield (US30Y.BD)$ The yield on [US 10-Year Treasury Notes] rose to around 5.34% on August 17, reaching its highest level since 2007. On the 18th, it hovered around 5.27–5.30%. Additionally, amid tensions between the US and Iran and growing caution regarding the situation in the Strait of Hormuz, $Brent Last Day Financial Futures (DEC6) (BZmain.US)$ crude oil prices temporarily exceeded $88 per barrel, strengthening concerns about a reacceleration of inflation through energy prices. The market remained mindful that such inflationary pressures could narrow the Fed's room for rate cuts. The next focus is on the FOMC meeting minutes from the July 28–29 session, scheduled for release at 14:00 ET on August 19. At that meeting, while the policy rate was held steady at 3.50–3.75%, three regional Federal Reserve Bank presidents...](https://sgsnsimg.moomoo.com/sns_client_feed/181000010/20260819/web-1787111107110-uhsyAgl2Di.png/big?area=105&is_public=true&imageMogr2/ignore-error/1/format/webp)
The term structure is in contango. ATM IV is approximately 11.91% for the August 21 expiry, 13.25% for September 18, and 13.90% for October 16, with a difference of about -1.34 points between the near-term and mid-term expiries.
Near-term IV is not disproportionately elevated specifically for the FOMC minutes themselves; rather, IV is gradually rising in anticipation of macro risks over the subsequent few weeks.
![Market Trends and Catalysts In the US market on the 18th, $Invesco QQQ Trust (QQQ.US)$ fell about 1.7%, $SPDR S&P 500 ETF (SPY.US)$ dropped about 0.7%, $iShares Russell 2000 ETF (IWM.US)$ and declined about 1.3%. Underlying this is the fact that $U.S. 30-Year Treasury Bonds Yield (US30Y.BD)$ The yield on [US 10-Year Treasury Notes] rose to around 5.34% on August 17, reaching its highest level since 2007. On the 18th, it hovered around 5.27–5.30%. Additionally, amid tensions between the US and Iran and growing caution regarding the situation in the Strait of Hormuz, $Brent Last Day Financial Futures (DEC6) (BZmain.US)$ crude oil prices temporarily exceeded $88 per barrel, strengthening concerns about a reacceleration of inflation through energy prices. The market remained mindful that such inflationary pressures could narrow the Fed's room for rate cuts. The next focus is on the FOMC meeting minutes from the July 28–29 session, scheduled for release at 14:00 ET on August 19. At that meeting, while the policy rate was held steady at 3.50–3.75%, three regional Federal Reserve Bank presidents...](https://sgsnsimg.moomoo.com/sns_client_feed/181000010/20260819/web-1787111124470-6tP0cSSHqc.png/big?area=105&is_public=true&imageMogr2/ignore-error/1/format/webp)
The volume-based put/call ratio is approximately 1.42, indicating a clear dominance of put trading on the day.
![Market Trends and Catalysts In the US market on the 18th, $Invesco QQQ Trust (QQQ.US)$ fell about 1.7%, $SPDR S&P 500 ETF (SPY.US)$ dropped about 0.7%, $iShares Russell 2000 ETF (IWM.US)$ and declined about 1.3%. Underlying this is the fact that $U.S. 30-Year Treasury Bonds Yield (US30Y.BD)$ The yield on [US 10-Year Treasury Notes] rose to around 5.34% on August 17, reaching its highest level since 2007. On the 18th, it hovered around 5.27–5.30%. Additionally, amid tensions between the US and Iran and growing caution regarding the situation in the Strait of Hormuz, $Brent Last Day Financial Futures (DEC6) (BZmain.US)$ crude oil prices temporarily exceeded $88 per barrel, strengthening concerns about a reacceleration of inflation through energy prices. The market remained mindful that such inflationary pressures could narrow the Fed's room for rate cuts. The next focus is on the FOMC meeting minutes from the July 28–29 session, scheduled for release at 14:00 ET on August 19. At that meeting, while the policy rate was held steady at 3.50–3.75%, three regional Federal Reserve Bank presidents...](https://sgsnsimg.moomoo.com/sns_client_feed/181000010/20260819/web-1787111153232-4a3Il6bzDk.png/big?area=105&is_public=true&imageMogr2/ignore-error/1/format/webp)
This tendency is even more pronounced in open interest. As of August 17, the put/call ratio for confirmed open interest was approximately 2.53, reflecting a significant accumulation of put positions.
This likely reflects hedging demand across broad portfolios. However, since open interest comprises a mix of new buys, sells, and residual existing positions, this alone cannot be viewed as a bearish signal.
![Market Trends and Catalysts In the US market on the 18th, $Invesco QQQ Trust (QQQ.US)$ fell about 1.7%, $SPDR S&P 500 ETF (SPY.US)$ dropped about 0.7%, $iShares Russell 2000 ETF (IWM.US)$ and declined about 1.3%. Underlying this is the fact that $U.S. 30-Year Treasury Bonds Yield (US30Y.BD)$ The yield on [US 10-Year Treasury Notes] rose to around 5.34% on August 17, reaching its highest level since 2007. On the 18th, it hovered around 5.27–5.30%. Additionally, amid tensions between the US and Iran and growing caution regarding the situation in the Strait of Hormuz, $Brent Last Day Financial Futures (DEC6) (BZmain.US)$ crude oil prices temporarily exceeded $88 per barrel, strengthening concerns about a reacceleration of inflation through energy prices. The market remained mindful that such inflationary pressures could narrow the Fed's room for rate cuts. The next focus is on the FOMC meeting minutes from the July 28–29 session, scheduled for release at 14:00 ET on August 19. At that meeting, while the policy rate was held steady at 3.50–3.75%, three regional Federal Reserve Bank presidents...](https://sgsnsimg.moomoo.com/sns_client_feed/181000010/20260819/web-1787111190394-ax70L0B58V.png/big?area=105&is_public=true&imageMogr2/ignore-error/1/format/webp)
The 25-delta risk reversal stood at approximately -2.35 points for the August 21 expiry, -4.91 points for the September 18 expiry, and -5.59 points for the October 16 expiry.
The downward skew strengthens with longer tenors, indicating that put demand reflecting medium-term macro risks is more heavily priced in.
![Market Trends and Catalysts In the US market on the 18th, $Invesco QQQ Trust (QQQ.US)$ fell about 1.7%, $SPDR S&P 500 ETF (SPY.US)$ dropped about 0.7%, $iShares Russell 2000 ETF (IWM.US)$ and declined about 1.3%. Underlying this is the fact that $U.S. 30-Year Treasury Bonds Yield (US30Y.BD)$ The yield on [US 10-Year Treasury Notes] rose to around 5.34% on August 17, reaching its highest level since 2007. On the 18th, it hovered around 5.27–5.30%. Additionally, amid tensions between the US and Iran and growing caution regarding the situation in the Strait of Hormuz, $Brent Last Day Financial Futures (DEC6) (BZmain.US)$ crude oil prices temporarily exceeded $88 per barrel, strengthening concerns about a reacceleration of inflation through energy prices. The market remained mindful that such inflationary pressures could narrow the Fed's room for rate cuts. The next focus is on the FOMC meeting minutes from the July 28–29 session, scheduled for release at 14:00 ET on August 19. At that meeting, while the policy rate was held steady at 3.50–3.75%, three regional Federal Reserve Bank presidents...](https://sgsnsimg.moomoo.com/sns_client_feed/181000010/20260819/web-1787111212268-r3o48HyLz5.png/big?area=105&is_public=true&imageMogr2/ignore-error/1/format/webp)
In block trades, transactions resembling put buying and call selling were prominent, particularly centered on the September expiry. However, since structured trades are not separated from single-leg trades, any bias toward hedging should be viewed as a reference signal with low-to-medium confidence.
![Market Trends and Catalysts In the US market on the 18th, $Invesco QQQ Trust (QQQ.US)$ fell about 1.7%, $SPDR S&P 500 ETF (SPY.US)$ dropped about 0.7%, $iShares Russell 2000 ETF (IWM.US)$ and declined about 1.3%. Underlying this is the fact that $U.S. 30-Year Treasury Bonds Yield (US30Y.BD)$ The yield on [US 10-Year Treasury Notes] rose to around 5.34% on August 17, reaching its highest level since 2007. On the 18th, it hovered around 5.27–5.30%. Additionally, amid tensions between the US and Iran and growing caution regarding the situation in the Strait of Hormuz, $Brent Last Day Financial Futures (DEC6) (BZmain.US)$ crude oil prices temporarily exceeded $88 per barrel, strengthening concerns about a reacceleration of inflation through energy prices. The market remained mindful that such inflationary pressures could narrow the Fed's room for rate cuts. The next focus is on the FOMC meeting minutes from the July 28–29 session, scheduled for release at 14:00 ET on August 19. At that meeting, while the policy rate was held steady at 3.50–3.75%, three regional Federal Reserve Bank presidents...](https://sgsnsimg.moomoo.com/sns_client_feed/181000010/20260819/web-1787111223216-6dSgObEmrA.png/big?area=105&is_public=true&imageMogr2/ignore-error/1/format/webp)
*For SPY, while IV levels are the lowest among the three indices, put open interest has accumulated significantly, and the downward skew strengthens with longer tenors. The combination of low IV levels and substantial put open interest suggests demand for tail-risk hedging across entire portfolios rather than simple bearish positioning. After the FOMC meeting minutes, the focus will be on whether the risk reversals for the September–October expiries expand further into negative territory or if existing put open interest declines.
$iShares Russell 2000 ETF (IWM.US)$ Among the three indices, supply and demand imbalances are most pronounced here. Small-cap stocks are highly sensitive to funding costs and long-term interest rates; despite IV being near the bottom of its historical range, the options market is showing the strongest demand for downside hedging.
IV rose by approximately 0.82 points from the previous day to about 19.62%. Meanwhile, the IV Rank is around 10 and the IV Percentile is around 7%, both at extremely low levels relative to the historical range. The 30-day historical volatility (HV) is hovering around 15.38%, meaning IV remains above realized volatility.
As with SPY, while IV is low compared to its historical range, a certain premium remains relative to current realized volatility. Therefore, it is not a situation where IV can be definitively labeled as simply cheap or expensive.
![Market Trends and Catalysts In the US market on the 18th, $Invesco QQQ Trust (QQQ.US)$ fell about 1.7%, $SPDR S&P 500 ETF (SPY.US)$ dropped about 0.7%, $iShares Russell 2000 ETF (IWM.US)$ and declined about 1.3%. Underlying this is the fact that $U.S. 30-Year Treasury Bonds Yield (US30Y.BD)$ The yield on [US 10-Year Treasury Notes] rose to around 5.34% on August 17, reaching its highest level since 2007. On the 18th, it hovered around 5.27–5.30%. Additionally, amid tensions between the US and Iran and growing caution regarding the situation in the Strait of Hormuz, $Brent Last Day Financial Futures (DEC6) (BZmain.US)$ crude oil prices temporarily exceeded $88 per barrel, strengthening concerns about a reacceleration of inflation through energy prices. The market remained mindful that such inflationary pressures could narrow the Fed's room for rate cuts. The next focus is on the FOMC meeting minutes from the July 28–29 session, scheduled for release at 14:00 ET on August 19. At that meeting, while the policy rate was held steady at 3.50–3.75%, three regional Federal Reserve Bank presidents...](https://sgsnsimg.moomoo.com/sns_client_feed/181000010/20260819/web-1787111304290-cRUyAQEGHB.png/big?area=105&is_public=true&imageMogr2/ignore-error/1/format/webp)
The term structure is in contango, with ATM IV at approximately 16.90% for the August 21 expiry, 17.40% for the September 18 expiry, and 18.33% for the October 16 expiry. The difference between the near-term and mid-term expiries is approximately -0.50 points.
Rather than near-term IV swelling ahead of specific events, volatility is rising gradually toward longer-dated expiries.
![Market Trends and Catalysts In the US market on the 18th, $Invesco QQQ Trust (QQQ.US)$ fell about 1.7%, $SPDR S&P 500 ETF (SPY.US)$ dropped about 0.7%, $iShares Russell 2000 ETF (IWM.US)$ and declined about 1.3%. Underlying this is the fact that $U.S. 30-Year Treasury Bonds Yield (US30Y.BD)$ The yield on [US 10-Year Treasury Notes] rose to around 5.34% on August 17, reaching its highest level since 2007. On the 18th, it hovered around 5.27–5.30%. Additionally, amid tensions between the US and Iran and growing caution regarding the situation in the Strait of Hormuz, $Brent Last Day Financial Futures (DEC6) (BZmain.US)$ crude oil prices temporarily exceeded $88 per barrel, strengthening concerns about a reacceleration of inflation through energy prices. The market remained mindful that such inflationary pressures could narrow the Fed's room for rate cuts. The next focus is on the FOMC meeting minutes from the July 28–29 session, scheduled for release at 14:00 ET on August 19. At that meeting, while the policy rate was held steady at 3.50–3.75%, three regional Federal Reserve Bank presidents...](https://sgsnsimg.moomoo.com/sns_client_feed/181000010/20260819/web-1787111320834-3uXTvvBIr6.png/big?area=105&is_public=true&imageMogr2/ignore-error/1/format/webp)
The volume-based put/call ratio stood at approximately 2.63, significantly higher than the other two indices. Put options clearly dominated trading activity for the day.
![Market Trends and Catalysts In the US market on the 18th, $Invesco QQQ Trust (QQQ.US)$ fell about 1.7%, $SPDR S&P 500 ETF (SPY.US)$ dropped about 0.7%, $iShares Russell 2000 ETF (IWM.US)$ and declined about 1.3%. Underlying this is the fact that $U.S. 30-Year Treasury Bonds Yield (US30Y.BD)$ The yield on [US 10-Year Treasury Notes] rose to around 5.34% on August 17, reaching its highest level since 2007. On the 18th, it hovered around 5.27–5.30%. Additionally, amid tensions between the US and Iran and growing caution regarding the situation in the Strait of Hormuz, $Brent Last Day Financial Futures (DEC6) (BZmain.US)$ crude oil prices temporarily exceeded $88 per barrel, strengthening concerns about a reacceleration of inflation through energy prices. The market remained mindful that such inflationary pressures could narrow the Fed's room for rate cuts. The next focus is on the FOMC meeting minutes from the July 28–29 session, scheduled for release at 14:00 ET on August 19. At that meeting, while the policy rate was held steady at 3.50–3.75%, three regional Federal Reserve Bank presidents...](https://sgsnsimg.moomoo.com/sns_client_feed/181000010/20260819/web-1787111339744-sHK8gwZybf.png/big?area=105&is_public=true&imageMogr2/ignore-error/1/format/webp)
Open interest shows a similar trend. As of August 18, the confirmed open interest put/call ratio was approximately 2.72, also the highest among the three indices.
Both volume and open interest are heavily skewed toward puts. However, it is not possible to determine the direction of position trading solely from open interest data.
![Market Trends and Catalysts In the US market on the 18th, $Invesco QQQ Trust (QQQ.US)$ fell about 1.7%, $SPDR S&P 500 ETF (SPY.US)$ dropped about 0.7%, $iShares Russell 2000 ETF (IWM.US)$ and declined about 1.3%. Underlying this is the fact that $U.S. 30-Year Treasury Bonds Yield (US30Y.BD)$ The yield on [US 10-Year Treasury Notes] rose to around 5.34% on August 17, reaching its highest level since 2007. On the 18th, it hovered around 5.27–5.30%. Additionally, amid tensions between the US and Iran and growing caution regarding the situation in the Strait of Hormuz, $Brent Last Day Financial Futures (DEC6) (BZmain.US)$ crude oil prices temporarily exceeded $88 per barrel, strengthening concerns about a reacceleration of inflation through energy prices. The market remained mindful that such inflationary pressures could narrow the Fed's room for rate cuts. The next focus is on the FOMC meeting minutes from the July 28–29 session, scheduled for release at 14:00 ET on August 19. At that meeting, while the policy rate was held steady at 3.50–3.75%, three regional Federal Reserve Bank presidents...](https://sgsnsimg.moomoo.com/sns_client_feed/181000010/20260819/web-1787111362486-hvRBFI3z5H.png/big?area=105&is_public=true&imageMogr2/ignore-error/1/format/webp)
The 25-delta risk reversals were approximately -2.74 points for the August 21 expiry, -6.15 points for the September 18 expiry, and -5.85 points for the October 16 expiry.
Notably, the -6.15 points for the September expiry represented the largest negative deviation among all three indices and across all expiries, indicating that the downward skew was most pronounced in the September contract.
![Market Trends and Catalysts In the US market on the 18th, $Invesco QQQ Trust (QQQ.US)$ fell about 1.7%, $SPDR S&P 500 ETF (SPY.US)$ dropped about 0.7%, $iShares Russell 2000 ETF (IWM.US)$ and declined about 1.3%. Underlying this is the fact that $U.S. 30-Year Treasury Bonds Yield (US30Y.BD)$ The yield on [US 10-Year Treasury Notes] rose to around 5.34% on August 17, reaching its highest level since 2007. On the 18th, it hovered around 5.27–5.30%. Additionally, amid tensions between the US and Iran and growing caution regarding the situation in the Strait of Hormuz, $Brent Last Day Financial Futures (DEC6) (BZmain.US)$ crude oil prices temporarily exceeded $88 per barrel, strengthening concerns about a reacceleration of inflation through energy prices. The market remained mindful that such inflationary pressures could narrow the Fed's room for rate cuts. The next focus is on the FOMC meeting minutes from the July 28–29 session, scheduled for release at 14:00 ET on August 19. At that meeting, while the policy rate was held steady at 3.50–3.75%, three regional Federal Reserve Bank presidents...](https://sgsnsimg.moomoo.com/sns_client_feed/181000010/20260819/web-1787111378079-geXUtbfx2S.png/big?area=105&is_public=true&imageMogr2/ignore-error/1/format/webp)
Put options accounted for the majority of block trades as well, with a mix of put buying and selling centered on the September expiry. However, since structured trades and single-leg trades are not separated in this analysis, while we can confirm a put-heavy flow, we cannot definitively conclude that there is a one-sided bearish position. The confidence level is low to medium.
![Market Trends and Catalysts In the US market on the 18th, $Invesco QQQ Trust (QQQ.US)$ fell about 1.7%, $SPDR S&P 500 ETF (SPY.US)$ dropped about 0.7%, $iShares Russell 2000 ETF (IWM.US)$ and declined about 1.3%. Underlying this is the fact that $U.S. 30-Year Treasury Bonds Yield (US30Y.BD)$ The yield on [US 10-Year Treasury Notes] rose to around 5.34% on August 17, reaching its highest level since 2007. On the 18th, it hovered around 5.27–5.30%. Additionally, amid tensions between the US and Iran and growing caution regarding the situation in the Strait of Hormuz, $Brent Last Day Financial Futures (DEC6) (BZmain.US)$ crude oil prices temporarily exceeded $88 per barrel, strengthening concerns about a reacceleration of inflation through energy prices. The market remained mindful that such inflationary pressures could narrow the Fed's room for rate cuts. The next focus is on the FOMC meeting minutes from the July 28–29 session, scheduled for release at 14:00 ET on August 19. At that meeting, while the policy rate was held steady at 3.50–3.75%, three regional Federal Reserve Bank presidents...](https://sgsnsimg.moomoo.com/sns_client_feed/181000010/20260819/web-1787111386965-bXA3wTsJbZ.png/big?area=105&is_public=true&imageMogr2/ignore-error/1/format/webp)
*For IWM, demand for downside hedging against small-cap stocks, which are highly sensitive to interest rates, was the strongest. Both volume and open interest were put-dominated, and the risk reversal for the September expiry showed the largest negative deviation among the three indices. Nevertheless, the IV percentile remains near the lower bound of its historical range. Rather than a ‘panic market accompanied by a surge in IV,’ the current structure can be described as one where ‘downside hedging demand is strongly biased under low IV conditions.’ Going forward, the key focus will be whether the downward skew for the September expiry deepens further or whether the IV percentile rebounds from its low levels.
Based on moomoo’s “Probability Analysis,” looking at the expected price range within ±1σ (68.27% probability) by September 18,$Invesco QQQ Trust (QQQ.US)$ is approximately ±6.6%,
![Market Trends and Catalysts In the US market on the 18th, $Invesco QQQ Trust (QQQ.US)$ fell about 1.7%, $SPDR S&P 500 ETF (SPY.US)$ dropped about 0.7%, $iShares Russell 2000 ETF (IWM.US)$ and declined about 1.3%. Underlying this is the fact that $U.S. 30-Year Treasury Bonds Yield (US30Y.BD)$ The yield on [US 10-Year Treasury Notes] rose to around 5.34% on August 17, reaching its highest level since 2007. On the 18th, it hovered around 5.27–5.30%. Additionally, amid tensions between the US and Iran and growing caution regarding the situation in the Strait of Hormuz, $Brent Last Day Financial Futures (DEC6) (BZmain.US)$ crude oil prices temporarily exceeded $88 per barrel, strengthening concerns about a reacceleration of inflation through energy prices. The market remained mindful that such inflationary pressures could narrow the Fed's room for rate cuts. The next focus is on the FOMC meeting minutes from the July 28–29 session, scheduled for release at 14:00 ET on August 19. At that meeting, while the policy rate was held steady at 3.50–3.75%, three regional Federal Reserve Bank presidents...](https://sgsnsimg.moomoo.com/sns_client_feed/181000010/20260819/web-1787111083472-jLEKPIqICO.png/big?area=105&is_public=true&imageMogr2/ignore-error/1/format/webp)
![Market Trends and Catalysts In the US market on the 18th, $Invesco QQQ Trust (QQQ.US)$ fell about 1.7%, $SPDR S&P 500 ETF (SPY.US)$ dropped about 0.7%, $iShares Russell 2000 ETF (IWM.US)$ and declined about 1.3%. Underlying this is the fact that $U.S. 30-Year Treasury Bonds Yield (US30Y.BD)$ The yield on [US 10-Year Treasury Notes] rose to around 5.34% on August 17, reaching its highest level since 2007. On the 18th, it hovered around 5.27–5.30%. Additionally, amid tensions between the US and Iran and growing caution regarding the situation in the Strait of Hormuz, $Brent Last Day Financial Futures (DEC6) (BZmain.US)$ crude oil prices temporarily exceeded $88 per barrel, strengthening concerns about a reacceleration of inflation through energy prices. The market remained mindful that such inflationary pressures could narrow the Fed's room for rate cuts. The next focus is on the FOMC meeting minutes from the July 28–29 session, scheduled for release at 14:00 ET on August 19. At that meeting, while the policy rate was held steady at 3.50–3.75%, three regional Federal Reserve Bank presidents...](https://sgsnsimg.moomoo.com/sns_client_feed/181000010/20260819/web-1787111407397-rHMlJYgSKr.png/big?area=105&is_public=true&imageMogr2/ignore-error/1/format/webp)
![Market Trends and Catalysts In the US market on the 18th, $Invesco QQQ Trust (QQQ.US)$ fell about 1.7%, $SPDR S&P 500 ETF (SPY.US)$ dropped about 0.7%, $iShares Russell 2000 ETF (IWM.US)$ and declined about 1.3%. Underlying this is the fact that $U.S. 30-Year Treasury Bonds Yield (US30Y.BD)$ The yield on [US 10-Year Treasury Notes] rose to around 5.34% on August 17, reaching its highest level since 2007. On the 18th, it hovered around 5.27–5.30%. Additionally, amid tensions between the US and Iran and growing caution regarding the situation in the Strait of Hormuz, $Brent Last Day Financial Futures (DEC6) (BZmain.US)$ crude oil prices temporarily exceeded $88 per barrel, strengthening concerns about a reacceleration of inflation through energy prices. The market remained mindful that such inflationary pressures could narrow the Fed's room for rate cuts. The next focus is on the FOMC meeting minutes from the July 28–29 session, scheduled for release at 14:00 ET on August 19. At that meeting, while the policy rate was held steady at 3.50–3.75%, three regional Federal Reserve Bank presidents...](https://sgsnsimg.moomoo.com/sns_client_feed/181000010/20260819/web-1787111278292-u1fKgEtk76.png/big?area=105&is_public=true&imageMogr2/ignore-error/1/format/webp)
Among the three indices, QQQ shows the largest movement, while SPY shows the smallest. The IV levels of each ETF are generally consistent with these movements.
Since all are index ETFs and do not involve individual corporate earnings reports, there is no expected volatility range specific to earnings events. The key date event this time is the FOMC meeting minutes, and its risk is priced in through the slope of the term structure and the put skew in the September–October expiries, rather than as a steep near-term premium ahead of a single event.
Therefore, even under the same rise in long-term interest rates, there are clear differences in the risk structures indicated by the options markets for the three indices.
The next confirmation factor will be tonight’s FOMC meeting minutes. If a hawkish stance is strongly perceived, forward-dated risk reversals may expand further into negative territory, and contango in the term structure could strengthen. On the other hand, if the hawkish tone is not as strong as expected, the focus will shift to whether near-term IV will drop off.
-moomoo News Kingsley
This document is prepared solely for informational purposes and does not constitute a recommendation to invest in or trade any specific financial instrument. Investors are solely responsible for their own final investment decisions and the resulting outcomes. Financial instruments carry risks including price volatility, credit risk, and liquidity risk. Principal is not guaranteed and losses may occur. The company assumes no liability whatsoever for any damages arising from the use of this document or from investment decisions made based on its content. Option trading involves the risk of losses exceeding the initial investment. Please be sure to review all key documentation—including the Contract Pre-Conclusion Document, Subscription Agreement, and other materials—covering important matters such as risks and fees, and trade only at your own discretion.


