
 Regional and local property market performance is becoming increasingly varied the further you drill down into the figures. While regional data provides a useful overview of how different parts of the country are performing, this analysis shows that individual cities can tell a very different story – particularly when performance is measured over different periods.
Regional picture
Unlike the average price rises by country, which have been pretty similar since last year, regional price rises/falls have changed quite a bit, and as you can see since April 2025, the comparison is quite stark.
Apart from price changes in the East, South West and Midlands, property price rises have fallen back in all the other regions – especially the North East.
The hope was to see the property market recover far more than it has this year, but this shows the true impact of the Iran/US war, which has definitely held back performance this year and is likely to impact for the rest of the year. That is, unless we see some more positivity from the Prime Minister and less rumours which slow the market further, now that the budget has been announced for 28th October.
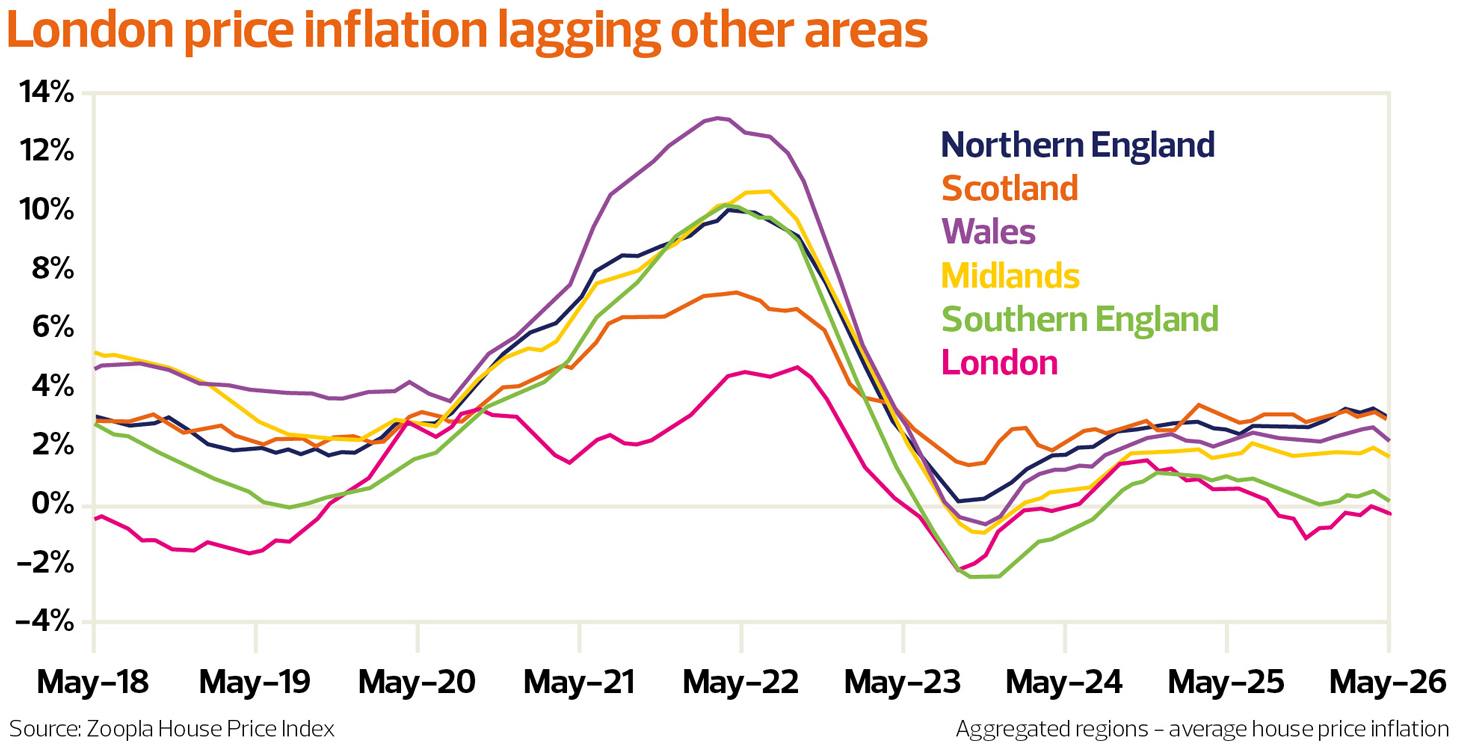
– Asking prices rose across the board this month, with all eleven regions in positive territory. The pattern of recent years persists: the more affordable markets of the North, Wales and Scotland are setting the pace, while the higher-value South and the capital lag behind.
– Over five years the North West (+22.1%), Wales (+19.2%) and the North East (+18.9%) lead the field, while Greater London has effectively flatlined (-0.1%).
– Average prices in Northern England (comprising North, North West, Yorkshire & The Humber, East Midlands and West Midlands) were up 3.1% year on year, with the North West (which includes areas such as Cheshire, Lancashire & Greater Manchester) remaining the top performing region in England – with prices up 3.9% year on year.
– Average house price growth in Southern England (South West, Outer South East, Outer Metropolitan, London and East Anglia) was broadly stable at 0.7%. London remained the strongest southern region, albeit with a modest annual price rise of 1.6%. Meanwhile, the surrounding Outer Metropolitan and Outer South East regions recorded even more modest rises of 0.3% and 0.1% respectively.

Lloyds
– In England, stronger price growth remains concentrated in northern regions. The North East saw prices rise +2.8 % over the year to £ 181,133, while the North West recorded annual growth of + 2.4 %, with the average property now costing £ 248,218.
– By contrast, southern markets continue to see prices fall. The South East led declines, with prices down -2.0 % year -on -year to £ 381,654 , while London saw average values fall by -1.1% to £ 534,831 .
Town and city tracker
But regional averages only tell part of the story. Looking at individual cities reveals an even more varied picture, with performance changing considerably depending on the period being measured.
We track over 30 cities each month to see how each are performing back as far as 2000. Having done this for some time, we find that each city tends to perform differently – depending on when you measure the market from, so some can go from a top city performer to the worst one, depending on when the market is measured!
Some perform well over time, some perform better in the last year. Here’s our summary of how the performance of cities varies substantially.
– The cities which have seen the biggest increase since the height of the market in 2007/8 prior to the credit crunch is: Bristol, followed by London and Manchester.
– The cities which have seen the lowest increases since the height of the market in 2007/8 prior to the credit crunch is: Aberdeen, followed by Belfast and Newcastle.
– The cities which have performed best since 2022 prior to the market falling post the Liz Truss era: Belfast, followed by Bradford and Liverpool.
– The cities which have struggled most since 2022 prior to the market falling post the Liz Truss era: Cambridge, Brighton and Hove and Newcastle.
– Year-on-year highest increases are: Belfast, followed by Norwich and Bradford.
– Year-on-year falls/lowest increases are: Aberdeen, Reading and Cambridge.


