Upcoming Investments

A $10,000 Investment in SCHD at Launch Now Pays This Much Every Single Year Without You Adding a Dime

Quick Read

  • SCHD’s per-share payout surged from $0.12 to $1.01 annualized since 2011, leaving VIG behind on yield-on-cost despite both funds posting similar total price returns.

  • SCHD’s annual reconstitution acts as a hidden dividend-growth ratchet, continuously rotating toward companies still raising payouts and compounding income for long-term holders.

  • VYM delivers higher current income for retirees spending now, while VIG’s four-basis-point fee and strict growth screen make it the anchor choice for accumulation-phase investors.

  • Read More: Learn 7 ways to generate income with a $1,000,000+ portfolio (sponsor)

When Schwab U.S. Dividend Equity ETF (NYSEARCA:SCHD) opened for trading on October 20, 2011, at a split-adjusted $5.22 per share, dividend ETF investors already had Vanguard Dividend Appreciation ETF (NYSEARCA:VIG) and Vanguard High Dividend Yield ETF (NYSEARCA:VYM) as the incumbent choices. Schwab’s newcomer entered a category Vanguard had defined.

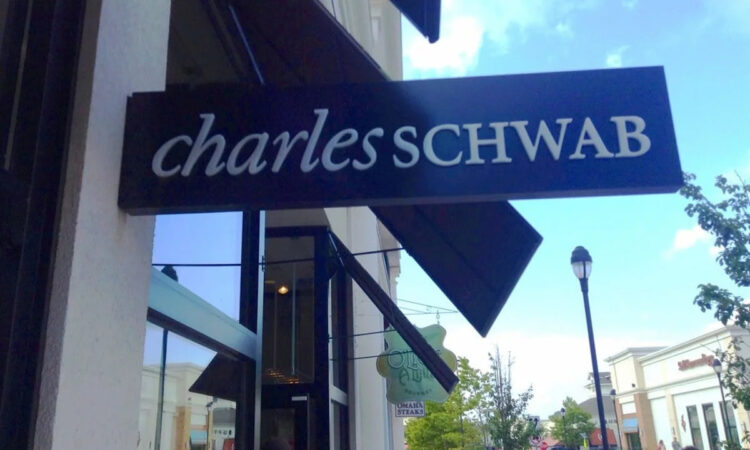
Charles Schwab
JeepersMedia / BY 2.0

Nearly fifteen years later, an untouched $10,000 stake in SCHD from launch day now throws off a yield on cost that no fresh dividend purchase can realistically approach. Shares recently changed hands near $35, a 567% cumulative price return before counting a single reinvested distribution. Per-share payouts have climbed from $0.1217 at the first quarterly payment to a $1.01 annualized forward rate. That progression is what this article is really about.

What SCHD Actually Owns Today

SCHD tracks the Dow Jones U.S. Dividend 100 Index, a screen that filters for consistent dividend payers with strong quality metrics and then weights them by a blend of cash flow, yield, and payout coverage. The output is a book of large, cash-generative businesses without the yield-trap problem that plagues pure high-yield indexes.

Current positioning reflects that discipline. QUALCOMM sits at the top at 6.7% of net assets, followed by Texas Instruments at 5.9% and UnitedHealth Group at 5.1%. Staples anchors like Coca-Cola, Procter & Gamble, and PepsiCo sit alongside energy majors Chevron and ConocoPhillips, mixing defensive cash flows with cyclical dividend growers. Fund assets sit near $94.9 billion, placing SCHD among the largest dividend ETFs by scale.

A $1,000,000 Income Portfolio

If you’ve saved over $1,000,000, this guide is for you. The last thing you want in retirement is to run out of money, you want your money to generate lasting income while you enjoy your life.

Now you can learn the strategies wealthy retirees use to fund their retirement with The Definitive Guide to Retirement Income from Fisher Investments. Download the guide today! (sponsor)

Two features separate this fund from just a generic income screen. The quality overlay filters out companies with weak balance sheets or shaky dividend histories. Annual reconstitution then forces turnover toward names still raising payouts, creating a hidden dividend-growth ratchet that benefits long-term holders.

VIG: Dividend Growth Without a Yield Trap

[stock_chart ticker=”VIG”]

VIG takes a stricter approach. It tracks the S&P U.S. Dividend Growers Index, which requires ten consecutive years of dividend increases and deliberately excludes the top 25% of yielders. That last filter is significant, as VIG will not hold a stock simply because it pays a lot today (because an unusually high yield often signals underlying distress).

The tradeoff is a lower starting yield in exchange for smoother payout growth. An early holder saw quarterly distributions rise from $0.6939 in early 2022 and, going further back, from levels in the $0.30s in 2011, to a $3.9952 annualized forward rate. Total price return since the SCHD launch sits at 524%, close to SCHD, but the muted starting yield makes the yield-on-cost story less dramatic.

VIG also carries a four-basis-point expense ratio, tied for the lowest in the category. For investors who want dividend growth as the primary engine, with less concern about immediate income, VIG functions as an anchor position rather than a complement.

VYM: Higher Starting Yield, Slower Ratchet

[stock_chart ticker=”VYM”]

VYM tracks the FTSE High Dividend Yield Index and takes essentially the opposite approach to VIG. It screens for above-median yields and weights by market cap, producing a heavier tilt toward mature, slower-growing payers and a larger allocation to financials and energy than VIG carries.

The visible portfolio shows the yield tilt clearly, with Broadcom leading at 8.0% of net assets, followed by Exxon Mobil at 2.7% and Johnson & Johnson at 2.3%. Quarterly distributions have climbed from $0.272 in early 2011 to a $3.918 annualized forward rate, and the fund has returned 501% on price since October 2011.

The catch is dividend growth velocity. VYM’s per-share payout has grown more slowly than SCHD’s on a normalized basis, because a high-yield screen naturally selects for companies already distributing most of their earnings and therefore with less headroom to raise. For investors who want spending income today rather than compounded income later, VYM screens ahead of either alternative.

Why SCHD Wins the Yield-on-Cost Race

Reinvesting distributions along the way changes the arithmetic further. SCHD’s per-share payout has expanded many times over since inception, and every reinvested payment bought additional shares that then paid their own rising dividends. That is the flywheel dividend-growth investors are actually paying for.

The reason SCHD outran both Vanguard funds on yield-on-cost is structural. Its methodology sits between VIG and VYM, demanding meaningful yield at purchase (unlike VIG, which caps out the top yielders) while also enforcing quality and growth (unlike VYM, which chases yield without a growth screen). That middle path captures the highest starting income compatible with durable dividend increases.

How to Choose Between the Three

The right fund depends on time horizon and cash-flow needs. For accumulation-phase investors with a decade or more before drawdown, SCHD offers a respectable starting yield combined with aggressive dividend growth, producing the steepest yield-on-cost curve. Reinvestment compounds the effect further.

Investors who want the cleanest bet on rising dividends, and who can accept a lower current yield, tend to find VIG the closest fit. The dividend-growers screen is the most conservative construction in the category, and the four-basis-point fee is hard to argue with.

Retirees or near-retirees who prioritize current spending income often find VYM the closer fit. Its higher starting yield shortens the waiting period for the compounding math to matter, though the growth trajectory is shallower and the sector concentration in financials and energy runs hotter.

The launch-era SCHD holder who did nothing for almost fifteen years is now collecting an income stream that a fresh buyer of any dividend ETF today cannot match on the same dollars. That outcome reflects what dividend-growth compounding does when it is left alone.

A $1,000,000 Income Portfolio

If you’ve saved over $1,000,000, this guide is for you. The last thing you want in retirement is to run out of money, you want your money to generate lasting income while you enjoy your life.

Now you can learn the strategies wealthy retirees use to fund their retirement with The Definitive Guide to Retirement Income from Fisher Investments. Download the guide today! (sponsor)

Contact editorial@247wallst.com for any questions or corrections.


Source link

Leave a Response