

Key Takeaways
- Investors increasingly use gold as a store of value and a hedge against the erosion of purchasing power caused by long-term currency debasement and systemic financial risks.
- The more hawkish Federal Reserve projections released in June 2026 under the new Fed Chair, Kevin Warsh, stand in contrast to President Trump’s more dovish, growth-oriented policy agenda, which has generally been seen as supportive of gold.
- Geopolitical tensions, concerns about the long-term status of the US dollar, the rapid expansion of US public debt – which surpassed $38 trillion by mid-2026 and continued central bank gold purchases remain key drivers of the gold market.
- Despite the sharp correction seen in the first half of the year, major Wall Street institutions maintain a constructive 2026 outlook for gold, with year-end price targets generally ranging between $5,400 and $6,300 per ounce.
What Is Gold as an Investment and Why Do People Buy It?
Gold is a physical asset people buy to store value and protect wealth, not to earn income. Unlike stocks or bonds, it pays no dividends, interest, or earnings – its value comes from scarcity, industrial demand, and its long history as a monetary store of value. That means the main reason to own gold is wealth protection rather than fast growth. For investors considering gold, knowing how to invest in gold can be just as important as recognizing why it may belong in a portfolio.
A primary reason investors ask should I invest in gold is safe-haven demand during macroeconomic stress: when geopolitical instability rises or trust in central bank policy weakens, capital rotates from paper assets into physical gold. This flight to safety provides a structural floor under spot prices, especially during equity market drawdowns or sovereign debt expansions. Gold’s above-ground supply typically expands by only 1.5% to 2% annually, making it one of the world’s scarcest monetary assets. While this constrained supply has historically helped gold preserve purchasing power over the long run, its performance remains heavily influenced by real interest rates, investor sentiment, and broader macroeconomic conditions.
Furthermore, long-term portfolio builders frequently analyse the asset class to determine: is it worth investing in gold as a pure portfolio diversifier? Historical correlations show that gold often moves independently of corporate bonds and broad equity indices like the S&P 500 or Nasdaq 100. By maintaining a small strategic allocation, investors can reduce the overall volatility of their broader net worth. This diversification benefit is amplified by ongoing official sector accumulation, as global central banks continue to buy massive quantities of bullion to reduce their reliance on foreign debt reserves.
|
|
How Has Gold Performed Historically? Returns, Drawdowns and Cycles
Long-term historical data show gold has delivered roughly 8 to 10% annualized returns over multi-decade horizons, but those returns have been highly uneven. The World Gold Council states that gold’s price in US dollars has increased by about 8% annualized since 1971, following the end of the Bretton Woods system. Another World Gold Council study puts gold’s compound annual return at 7.6% and its average annual return at 10.4% since 1971, depending on the methodology used.
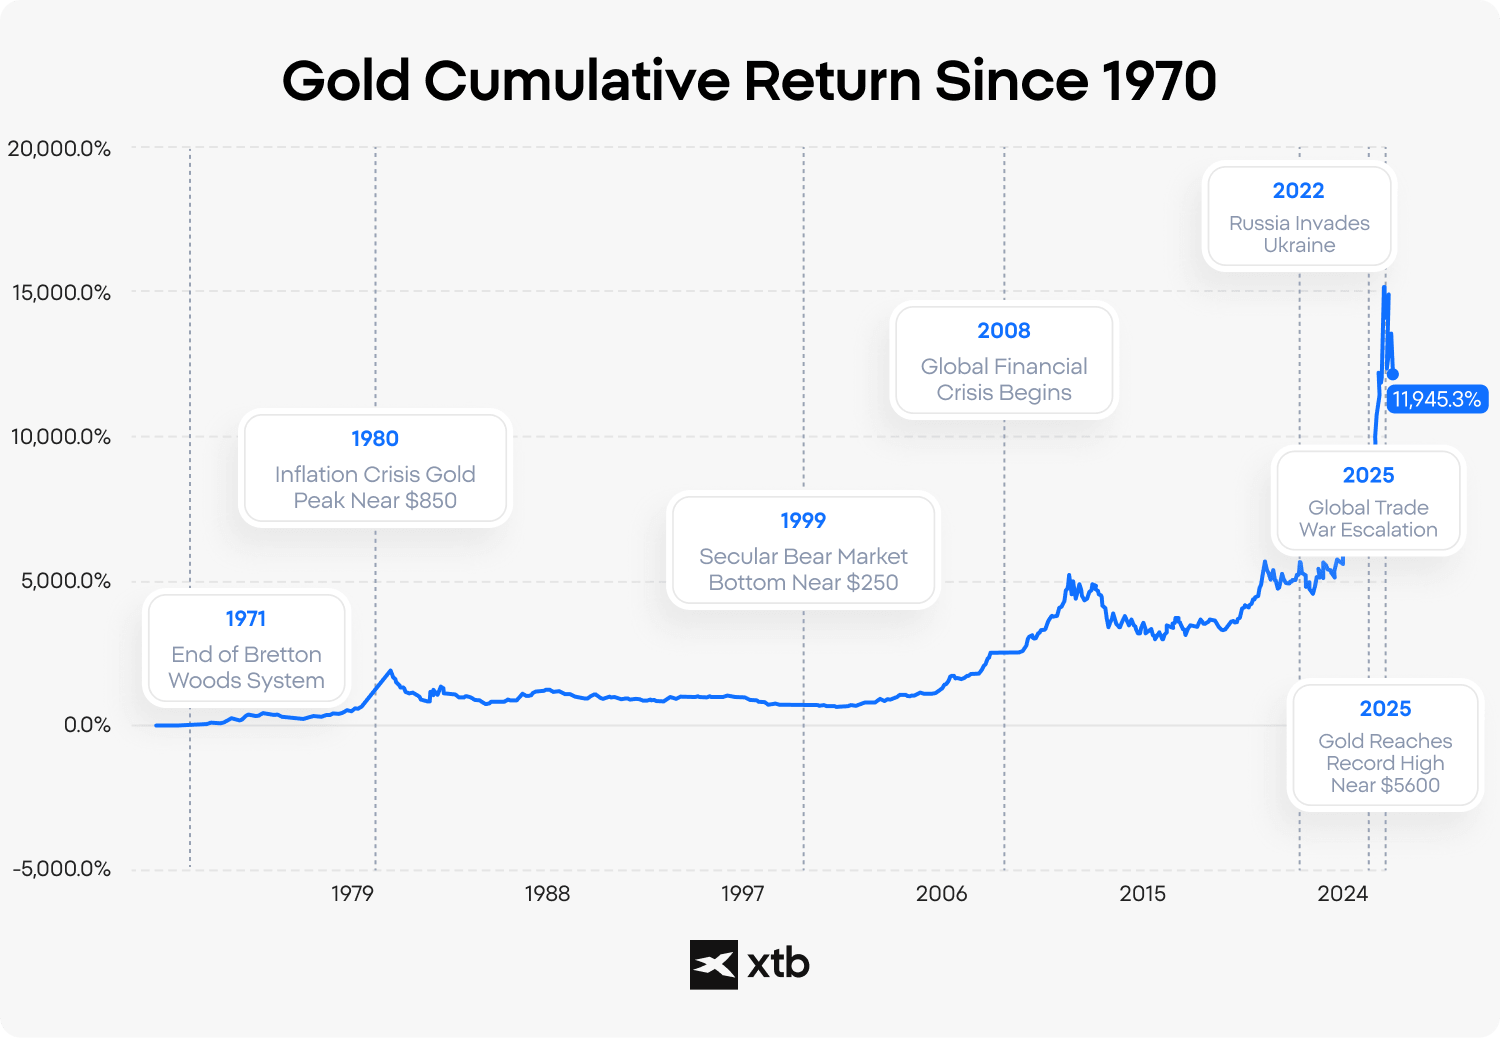
Remember, past performance is not an indicator of future results.
Over shorter horizons, however, performance has varied widely; for example, J.P. Morgan notes annualized returns of approximately 12% over the 20 years ending in 2025, while other studies show much lower returns depending on the starting point. Anyone asking “should I buy gold” must therefore study past performance cycles to avoid unrealistic expectations. Gold’s long-term record has been marked by severe short-term volatility, deep drawdowns, and multi-year flat periods. Key historical patterns include:
- After the end of the gold standard in 1971, the metal experienced an explosive bull run that peaked in 1980 near $850 per ounce.
- That spectacular surge was followed by a long secular bear market in which prices fell sharply and remained stagnant for many years, creating significant opportunity costs compared with the strong equity-market performance of the 1990s.
- A similar pattern appeared after the 2011 peak, when gold suffered a roughly 40% drawdown between 2011 and 2015 and required nearly a decade to fully recover.
- The modern era of gold performance was reshaped during the global financial crisis of 2008, which revived institutional interest in hard assets and monetary hedges.
- Aggressive quantitative easing by Western central banks helped push gold from below $800 per ounce in 2008 to above $1,900 per ounce by 2011.
- A comparable cyclical pattern appeared during the 2020 pandemic and the post-2022 inflation shock, when gold repeatedly challenged or broke previous psychological price ceilings as inflation concerns intensified.
- These episodes suggest that gold tends to perform best when real, inflation-adjusted bond yields fall, reducing the opportunity cost of holding a non-yielding asset.
Multi-decade data shows that gold functions more like a reactive insurance asset than a consistent wealth generator. Over very long periods, it has helped preserve purchasing power against currency debasement and systemic financial stress, but it has not always outpaced the compounded total returns of high-quality dividend-paying equities during long peacetime expansions. Therefore, evaluating gold’s historical performance requires separating its defensive role from short-term speculative price moves. Gold can be a powerful portfolio stabilizer in periods of monetary stress, but its history also shows that investors must be prepared for long periods of stagnation, sharp corrections, and returns that depend heavily on the chosen starting date.
|
|
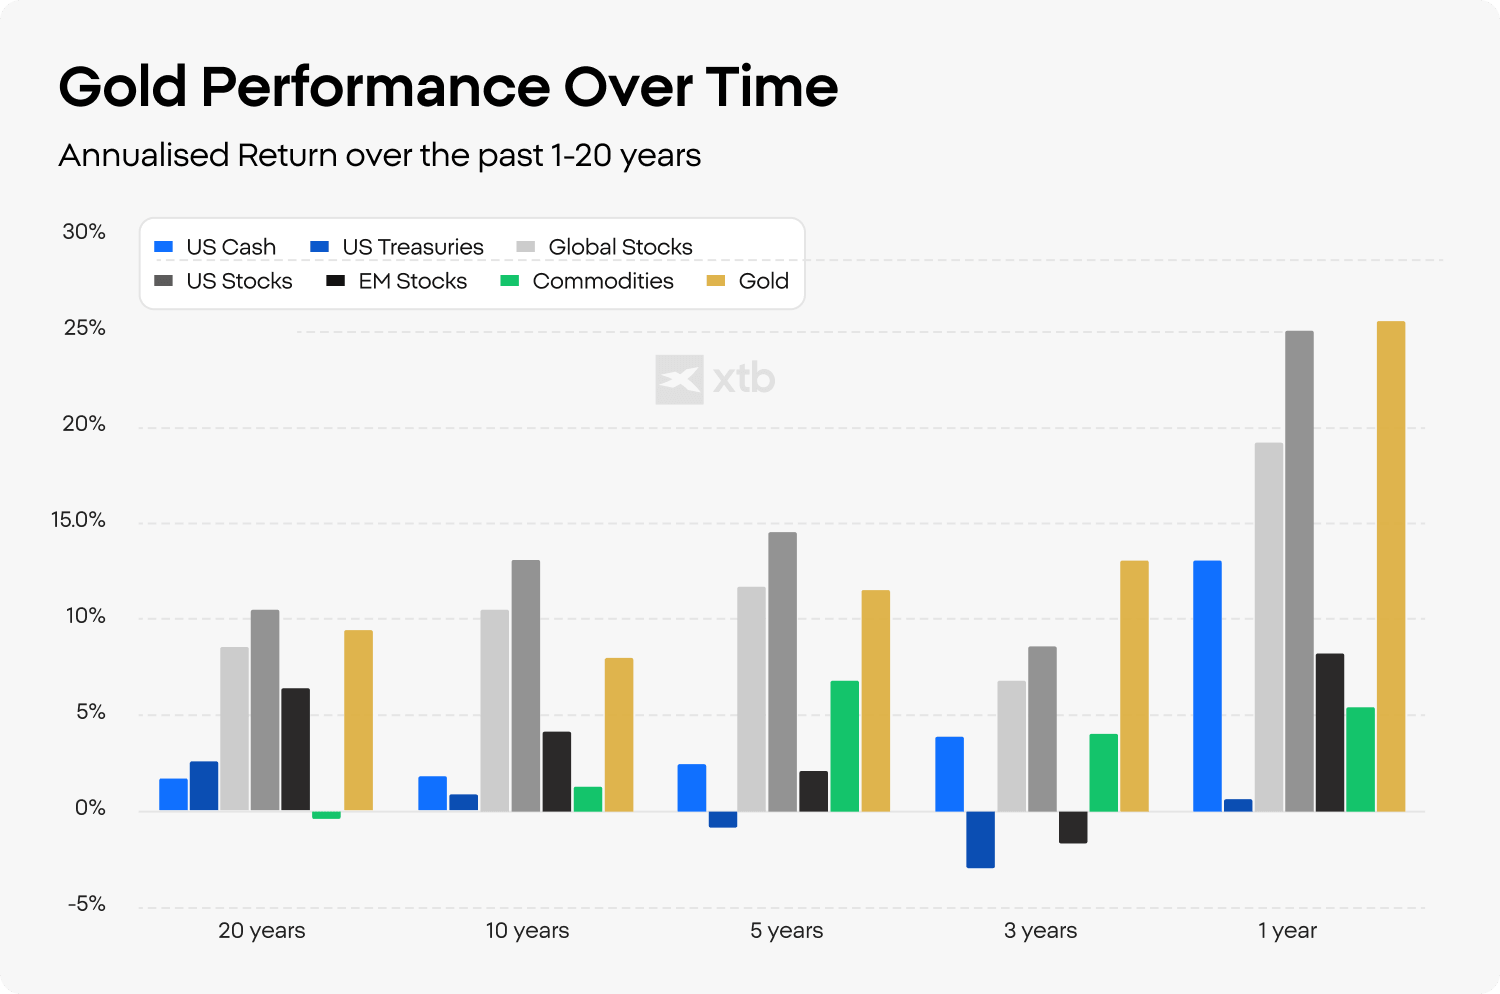
Source: Bloomberg, ICE Benchmark Administration, World Gold Council
Gold has performed well, despite the bull run on Wall Street and “risk-on” sentiments on global markets. The chart shows annualised return over the past 1, 3, 5, 10 and 20 years (from 31 December 2004 to 31 December 2024). Remember, past performance is not an indicator of future results.
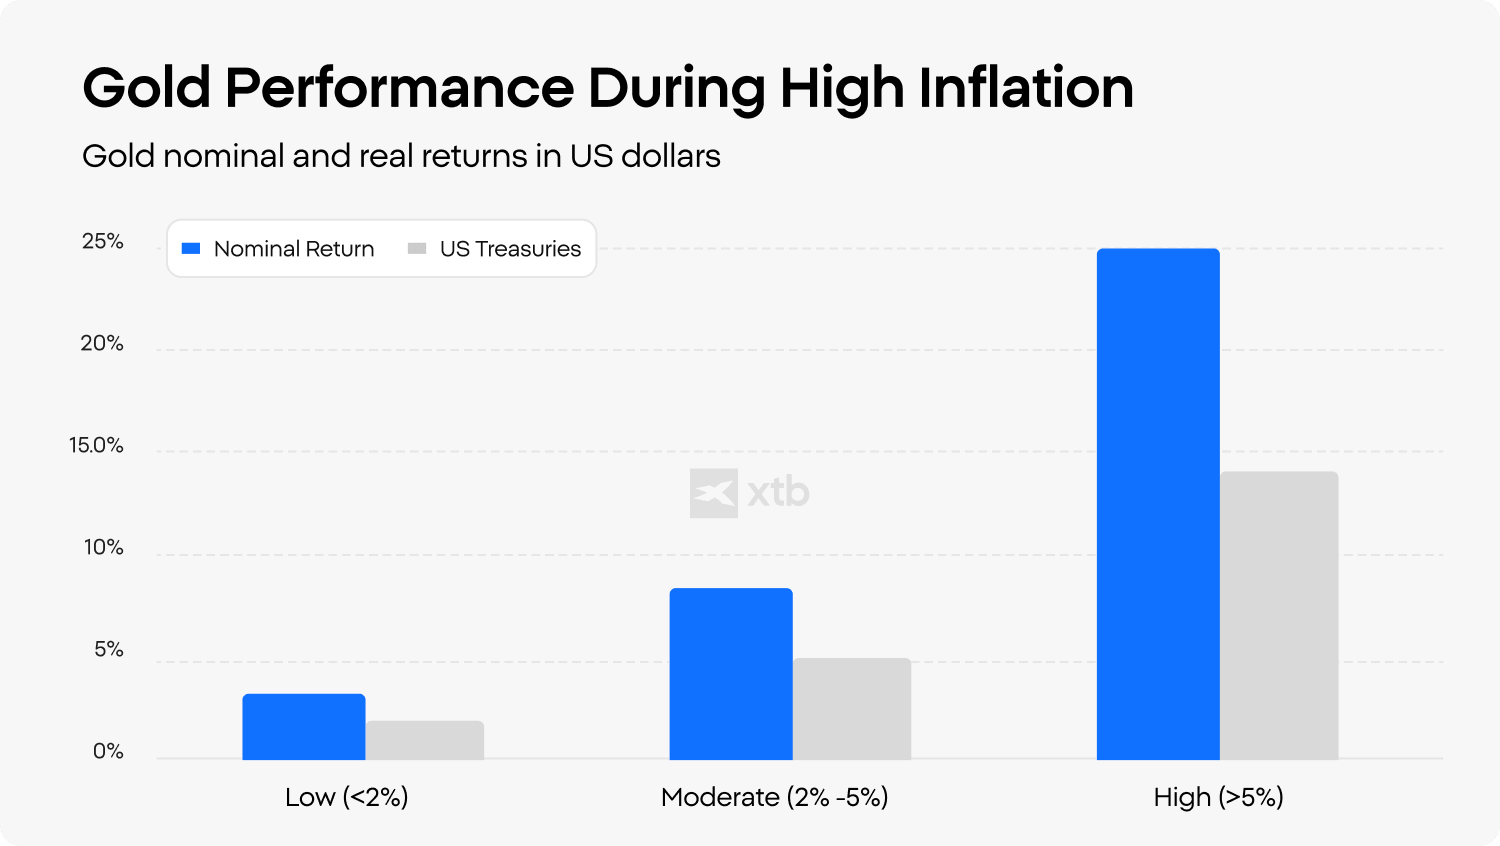
Source: Bloomberg, ICE Benchmark Administration, World Gold Council
Historically gold gains during the high inflation. The chart shows Gold nominal and real returns in US dollars as a function of annual inflation. Based on yearly change in US dollars for ‘gold’: LBMA Gold Price PM and ‘inflation’: US CPI since January 1971. Data as of 31 December 2024. Remember that past performance is not an indicator of future results.
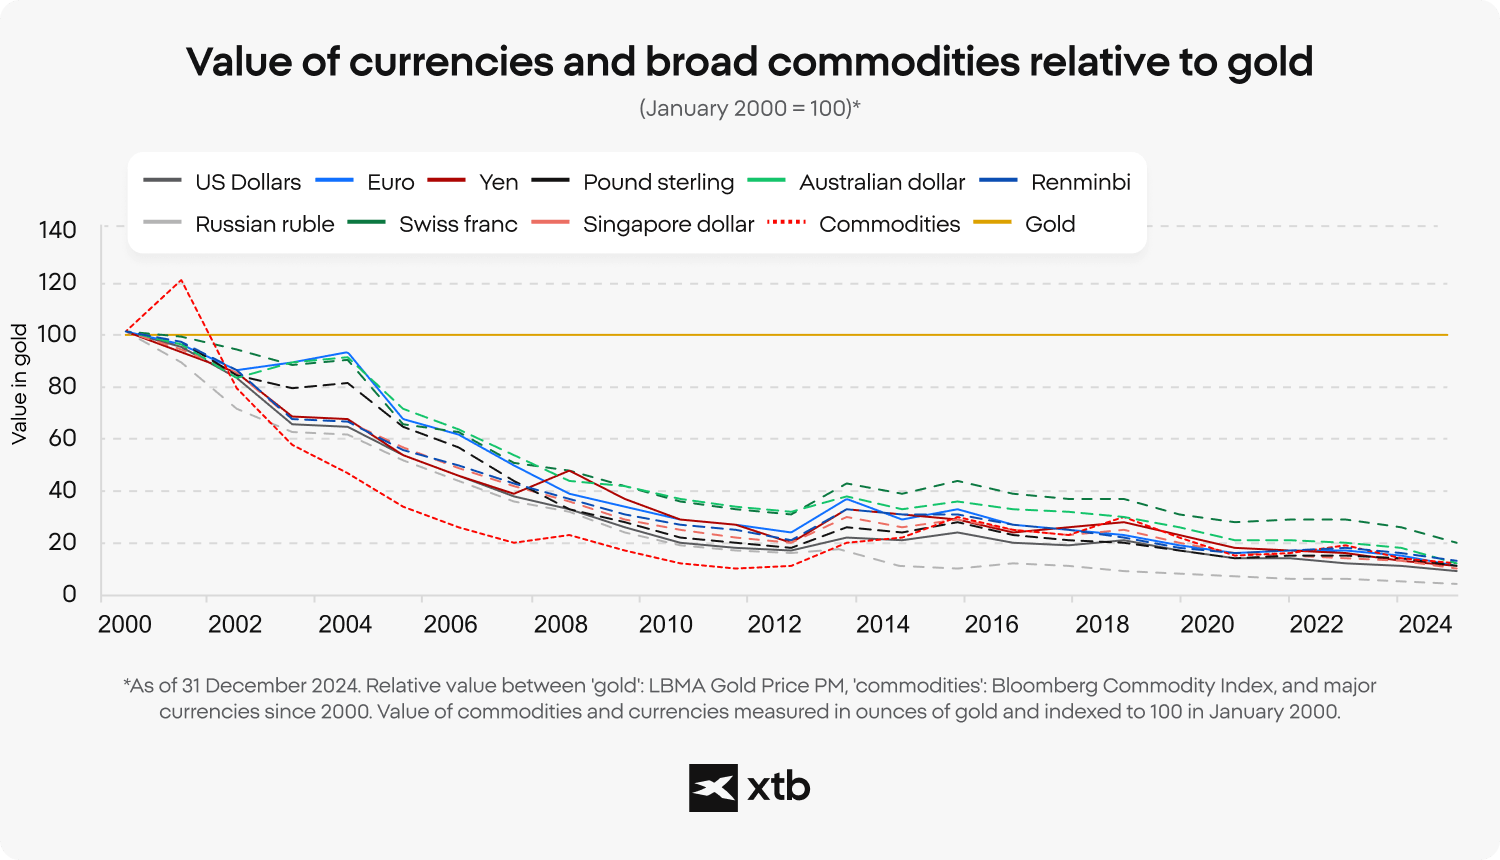
Source: Bloomberg, ICE Benchmark Administration, World Gold Council
The purchasing power of major currencies and commodities has significantly eroded relative to gold. The chart above shows value of currencies and broad commodities relative to gold (January 2000 = 100). Data as of 31 December 2024. Remember that past performance is not an indicator of future results.
Relative value between ‘gold’: LBMA Gold Price PM, ‘commodities’: Bloomberg Commodity Index, and major currencies since 2000. Value of commodities and currencies measured in ounces of gold and indexed to 100 in January 2000.
What are the Pros and Cons of Investing in Gold?
Financial instruments and physical bullion each present distinct trade-offs for different types of investors, contrasting immediate liquidity against ongoing storage fees. Understanding the specific disadvantages of investing in gold is vital before altering your portfolio allocation. The most apparent drawbacks include the complete absence of passive income generation, the presence of ongoing insurance fees for physical storage, and the high transaction spreads charged by retail bullion dealers. Furthermore, during aggressive equity market expansions, holding an over-allocated position in gold can severely drag down overall portfolio performance.
To determine how much I should invest in gold, an individual must carefully weigh five core exposure structures: physical bullion, exchange-traded funds (ETFs/ETCs), mutual investment funds, gold mining stocks and derivative contracts. Physical ownership provides total independence from the banking system and eliminates counterparty risk, but it requires secure vaulting and transport. Conversely, exchange-traded funds offer institutional liquidity and minimal entry costs on modern digital platforms, but they introduce management expense ratios and institutional credit risks.
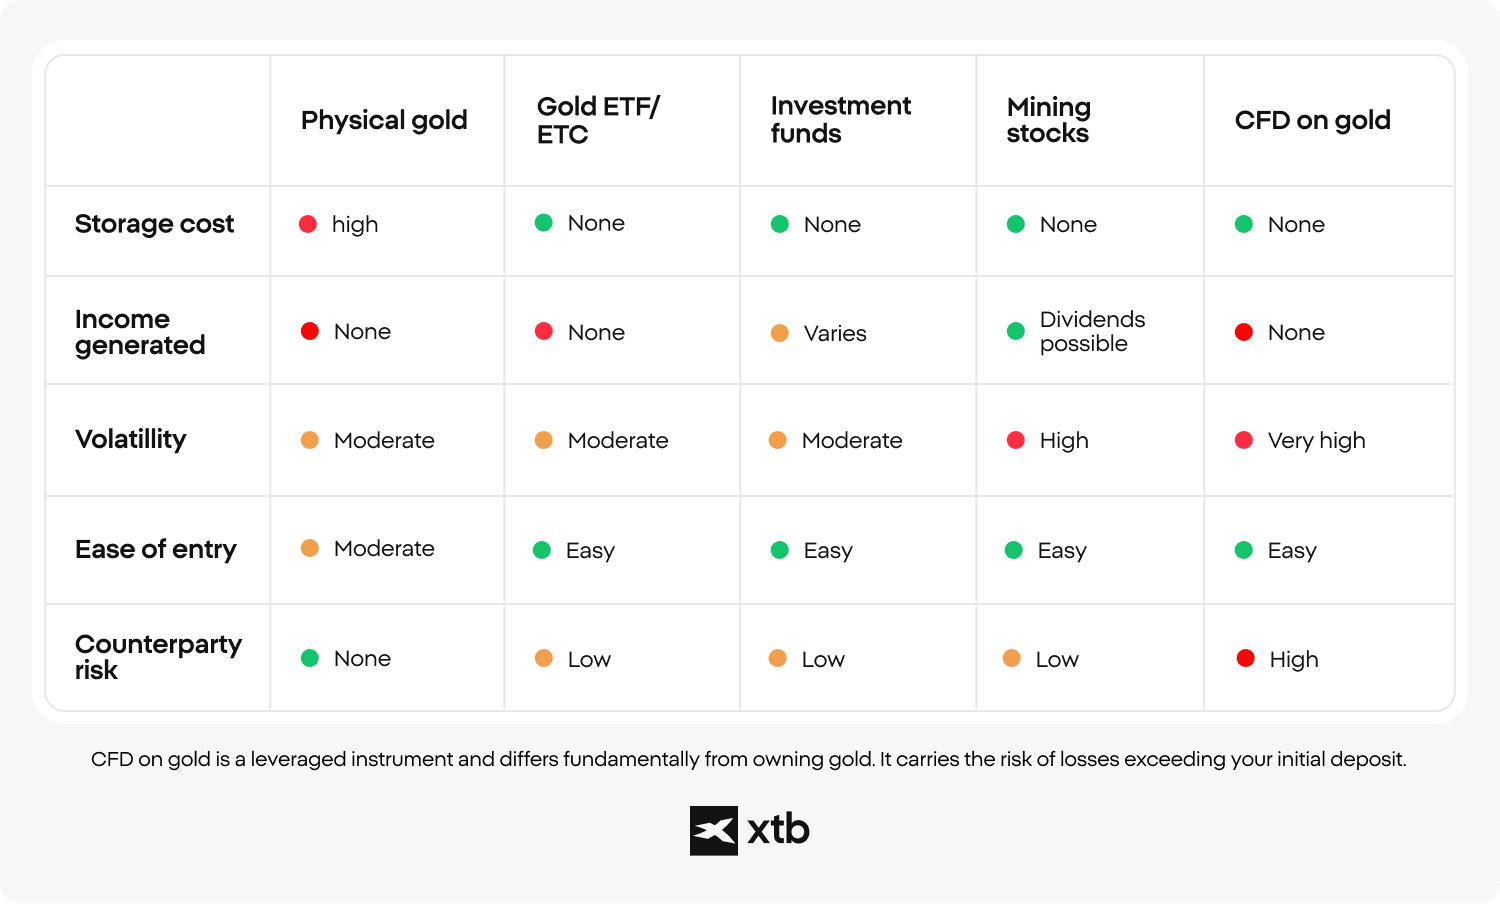
Alternative methods like mining equities provide a leveraged play on the spot price of the metal, as corporate profit margins expand rapidly when gold prices climb. However, mining stocks also expose investors to localized operational issues, environmental regulations, and corporate mismanagement. Short-term derivative instruments offer high capital efficiency via leverage, but they incur ongoing financing costs and are explicitly poorly suited for multi-year buy-and-hold strategies.
|
|
Gold in 2026: Price Performance, Correction, and Institutional Forecasts
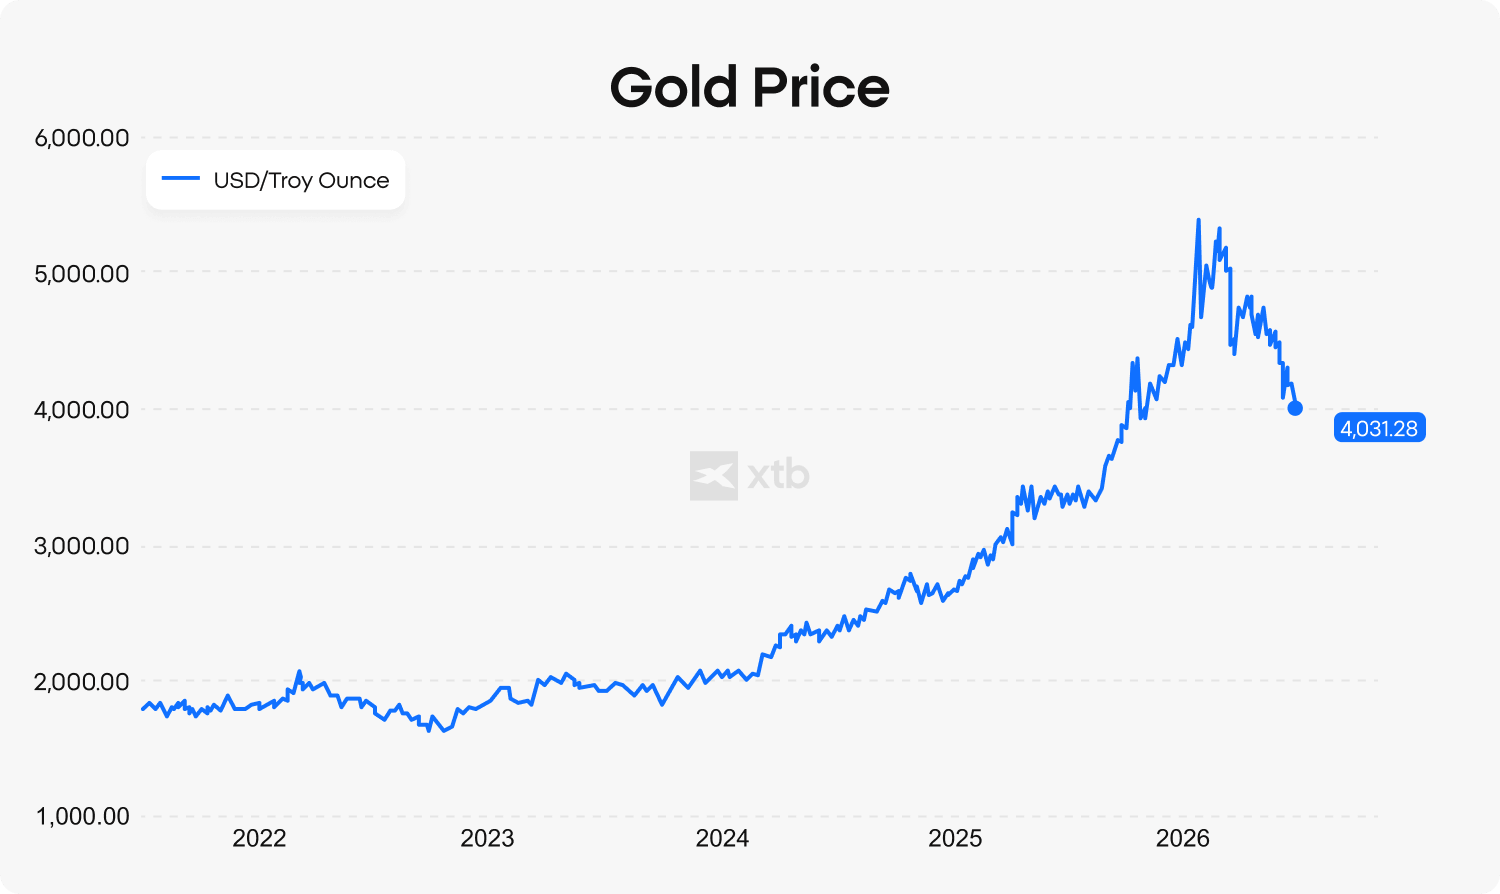
The spot price of gold experienced extreme cyclical volatility in the first half of 2026, surging to an all-time high of $5,589.38 on January 28 before retracing toward the $4000 level by mid-July. This violent 22% correction from the January peak was driven by a temporary easing of geopolitical tensions in the Middle East, a stronger US dollar, and a macro environment where the Federal Reserve delayed expected interest rate cuts, while the European Central Bank increased interest rates by 25 bps. Even the most well-established defensive commodities can experience severe near-term price corrections when speculative institutional capital flows reverse.
- J.P. Morgan Global Research revised its 2026 gold price forecast to $4,300 per ounce, while cuttinga year-end target of $4,500 per ounce, down from $6000 expected in May, amid weaker demand from key gold buyers.
- Wells Fargo Investment Institute raised its outlook significantly and now forecasts gold to end 2026 in a range of $6,100–$6,300 per ounce.
- UBS expects gold to finish the year at approximately $5,900 per ounce, supported by continued central bank purchases.
- Goldman Sachs maintains a year-end 2026 target of $5,400 per ounce, arguing that the long-term bull case is driven by reserve diversification among emerging-market central banks and concerns about debt debasement rather than short-term Fed policy.
- Morgan Stanley remains the most cautious among major institutions, projecting gold at $5,200 per ounce by the fourth quarter of 2026, citing expectations of moderating momentum following the strong rally of previous years.
Despite the recent price drop, major institutional research desks maintain a highly constructive outlook for the remainder of the year, pointing to strong structural support lines. Remember that such forecasts are not a reliable indicator of future performance.
Source: XTB Research, Macrobond
Gold prices since July 2021 to July 2026 doubled, rising from almost $2000 per ounce to $4000, with the historic peak well above $5000. Remember, past performance is not an indicator of future results.
Is Gold Still Worth It in 2026? It Depends on Who You Are
A strategic allocation to gold can remain an effective risk-management decision in 2026, especially for investors focused on capital preservation rather than aggressive short-term growth. Ray Dalio, the billionaire investor and co-founder of Bridgewater Associates, has suggested that gold may deserve a 5% to 15% allocation in a diversified “all-weather” portfolio built around assets that do not move in the same direction. In this context, gold should be viewed less as a conventional growth asset and more as an alternative currency stabilizer that can help protect purchasing power during periods of financial stress, currency debasement, or rising public-debt concerns.
Gold may make practical sense for investors approaching retirement, those seeking protection against banking-system fragility, or those looking for a counterweight to high government deficits and paper-based financial assets. However, it may be less suitable for investors whose primary goal is fast compounding over a short horizon, regular monthly income, or low short-term volatility. Gold does not pay dividends or interest, and it can experience sharp corrections as well as multi-year consolidation periods, even when the long-term macro case remains intact.
Before allocating capital to gold, investors should assess their time horizon, liquidity needs, risk tolerance, and existing exposure to equities, bonds, cash, and other paper assets. The decision should not be driven by short-term headlines or fear-based market narratives, but by a structural portfolio plan. Used appropriately, gold can strengthen long-term financial resilience; used without a clear purpose, it can become another volatile asset that adds uncertainty rather than protection. In 2026 investors know what affect gold prices, but the main question is, will gold be driven by rising deficits, uncertainty and public debt or crushed by surprisingly hawkish Fed.
This content has been created by XTB S.A. This service is provided by XTB S.A., with its registered office in Warsaw, at Prosta 67, 00-838 Warsaw, Poland, entered in the register of entrepreneurs of the National Court Register (Krajowy Rejestr Sądowy) conducted by District Court for the Capital City of Warsaw, XII Commercial Division of the National Court Register under KRS number 0000217580, REGON number 015803782 and Tax Identification Number (NIP) 527-24-43-955, with the fully paid up share capital in the amount of PLN 5.869.181,75. XTB S.A. conducts brokerage activities on the basis of the license granted by Polish Securities and Exchange Commission on 8th November 2005 No. DDM-M-4021-57-1/2005 and is supervised by Polish Supervision Authority.


