
The Stock Market Is Doing Something for Only the 3rd Time in 156 Years, and History Is Clear a Crash May be Hiding in Plain Sight

The S&P 500 (^GSPC +0.33%) has been on an impressive run since the bear market of 2022. Since hitting a bottom in October 2022, the index has more than doubled, gaining approximately 115%. This translates into an annualized return of roughly 21% over four years, more than twice its historical average of approximately 10% annually, including dividends.
Here’s the catch: Stock prices do not outperform their long-term averages indefinitely. Eventually, markets experience mean reversion, a process in which unusually strong returns are followed by periods of weaker performance. While this doesn’t guarantee a crash is imminent, one particular valuation indicator is flashing a warning investors should not ignore.
Today’s Change
(0.33%) +25.12
Index Level
7,744.06
Key Data Points
Day’s Range
7,669.66 – 7,754.15
52wk Range
6,316.91 – 7,844.52
The S&P 500 CAPE ratio is entering dangerous territory
The cyclically adjusted price-to-earnings ratio (CAPE) measures the S&P 500’s price relative to its average inflation-adjusted earnings over the last 10 years. The point is to smooth out temporary earnings fluctuations, providing a more balanced perspective on whether stocks are expensive or fairly valued.
Historically, the CAPE ratio has averaged around 17.8. But as of October 2026, readings are hovering around 41. To appreciate how unusual this is, consider some history.
Before the 1929 stock market crash, the CAPE ratio approached 33. The Dow Jones Industrial Average (^DJI +1.08%) subsequently lost 89% of its value between 1929 and 1932.
In more recent history, the CAPE ratio exceeded 40 in 1999 and peaked near 44 before the dot-com bubble collapse. From March 2000 through October 2002, the S&P 500 declined 49%, while the Nasdaq Composite (^IXIC +0.08%) plunged 77%.
Today’s CAPE reading above 40 puts stock valuations in rare territory, suggesting the current market is historically expensive. Much like the internet revolution, generative AI promises to transform entire industries, leading investors to pay premiums for companies expected to dominate the future. But I see one important difference between today’s AI boom and the dot-com bubble.

Image source: Getty Images.
Today’s AI leaders actually have earnings
During the late 1990s, investors poured unprecedented sums into speculative technology companies with little revenue, no profits, and untested business models. Today’s AI leaders are considerably different.
Nvidia (NVDA -1.84%) sells the graphics processing units (GPUs) that power much of the AI revolution. Despite its stock price appreciation over the last few years, Nvidia’s earnings have also expanded as demand for its chips continues to accelerate.
Meanwhile, Micron Technology (MU +1.87%) is benefiting from soaring demand for high bandwidth memory (HBM) and advanced DRAM solutions. Alphabet (GOOGL +0.45%) (GOOG +0.37%) has combined an established, highly profitable advertising business with an expanding cloud infrastructure and AI services ecosystem.
These businesses aren’t selling investors a vision of the future. They’re actually generating consistent AI-driven revenue and profits today. This is why their forward price-to-earnings (P/E) ratios look reasonable relative to what the broader market’s CAPE ratio might suggest.
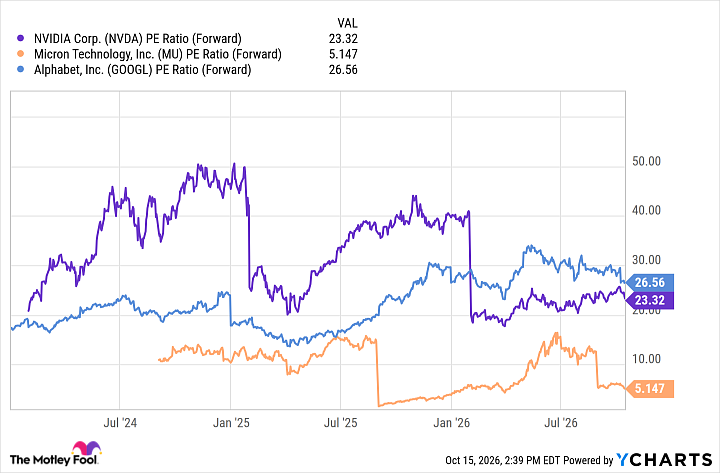
NVDA PE Ratio (Forward) data by YCharts
The crack I see is that future growth in the AI landscape hinges on the overarching assumption that big tech will continue spending at historical levels on AI infrastructure. According to Morgan Stanley, capital expenditures (capex) among the five major hyperscalers — Microsoft, Amazon, Alphabet, Meta Platforms, and Oracle — are projected to approach $800 billion in 2026, climb to $1.2 trillion in 2027, and reach $1.4 trillion in 2028.
Those investments are an enormous opportunity for Nvidia, Micron, and other semiconductor suppliers. But they also create a financial opportunity cost. Every dollar AI hyperscalers spend building data centers is one that cannot also be used to fund share repurchases or dividend increases. If AI infrastructure investments fail to deliver attractive returns on aggressive timelines, Wall Street could eventually question whether these budgets were justified.
Is now a good time to sell stocks?
The combination of outsize gains over the last four years fueling historically elevated valuations suggests the market has less room for disappointment. This is why taking some profits right now could make sense. In particular, for investors whose portfolios have become heavily concentrated in AI-related technology stocks, trimming some of your biggest winners could prove wise.
Of course, selling everything would be a questionable decision. Instead, I’d consider maintaining exposure to AI through a more diversified cohort of businesses. Industrial companies stand to benefit from data center construction, electrical equipment, and automation, while energy companies can profit from rising demand for electricity and natural gas. Meanwhile, utilities should benefit from investments in power generation and transmission infrastructure.
The biggest mistake investors can make right now is assuming that historically expensive valuations mean a crash is right around the corner. The CAPE ratio is a useful indicator of long-term expected returns, but it does not have a track record of predicting precisely when corrections will occur.


