
Midterm Elections Are Shaping Up as a Worst-Case Scenario for the Stock Market, but This Isn’t the Full Story

In less than two weeks, on Nov. 3, Americans across the country will make their voices heard by heading to the polls or mailing in their ballots.
Though President Donald Trump still has a little over two years left in his second non-consecutive term, the makeup of Congress during the second half of his term could be markedly different. While the Dow Jones Industrial Average (^DJI +0.69%), S&P 500 (^GSPC +0.58%), and Nasdaq Composite (^IXIC +1.05%) have thrived since Trump’s January 2025 inauguration, the midterm elections could halt this party in its tracks.
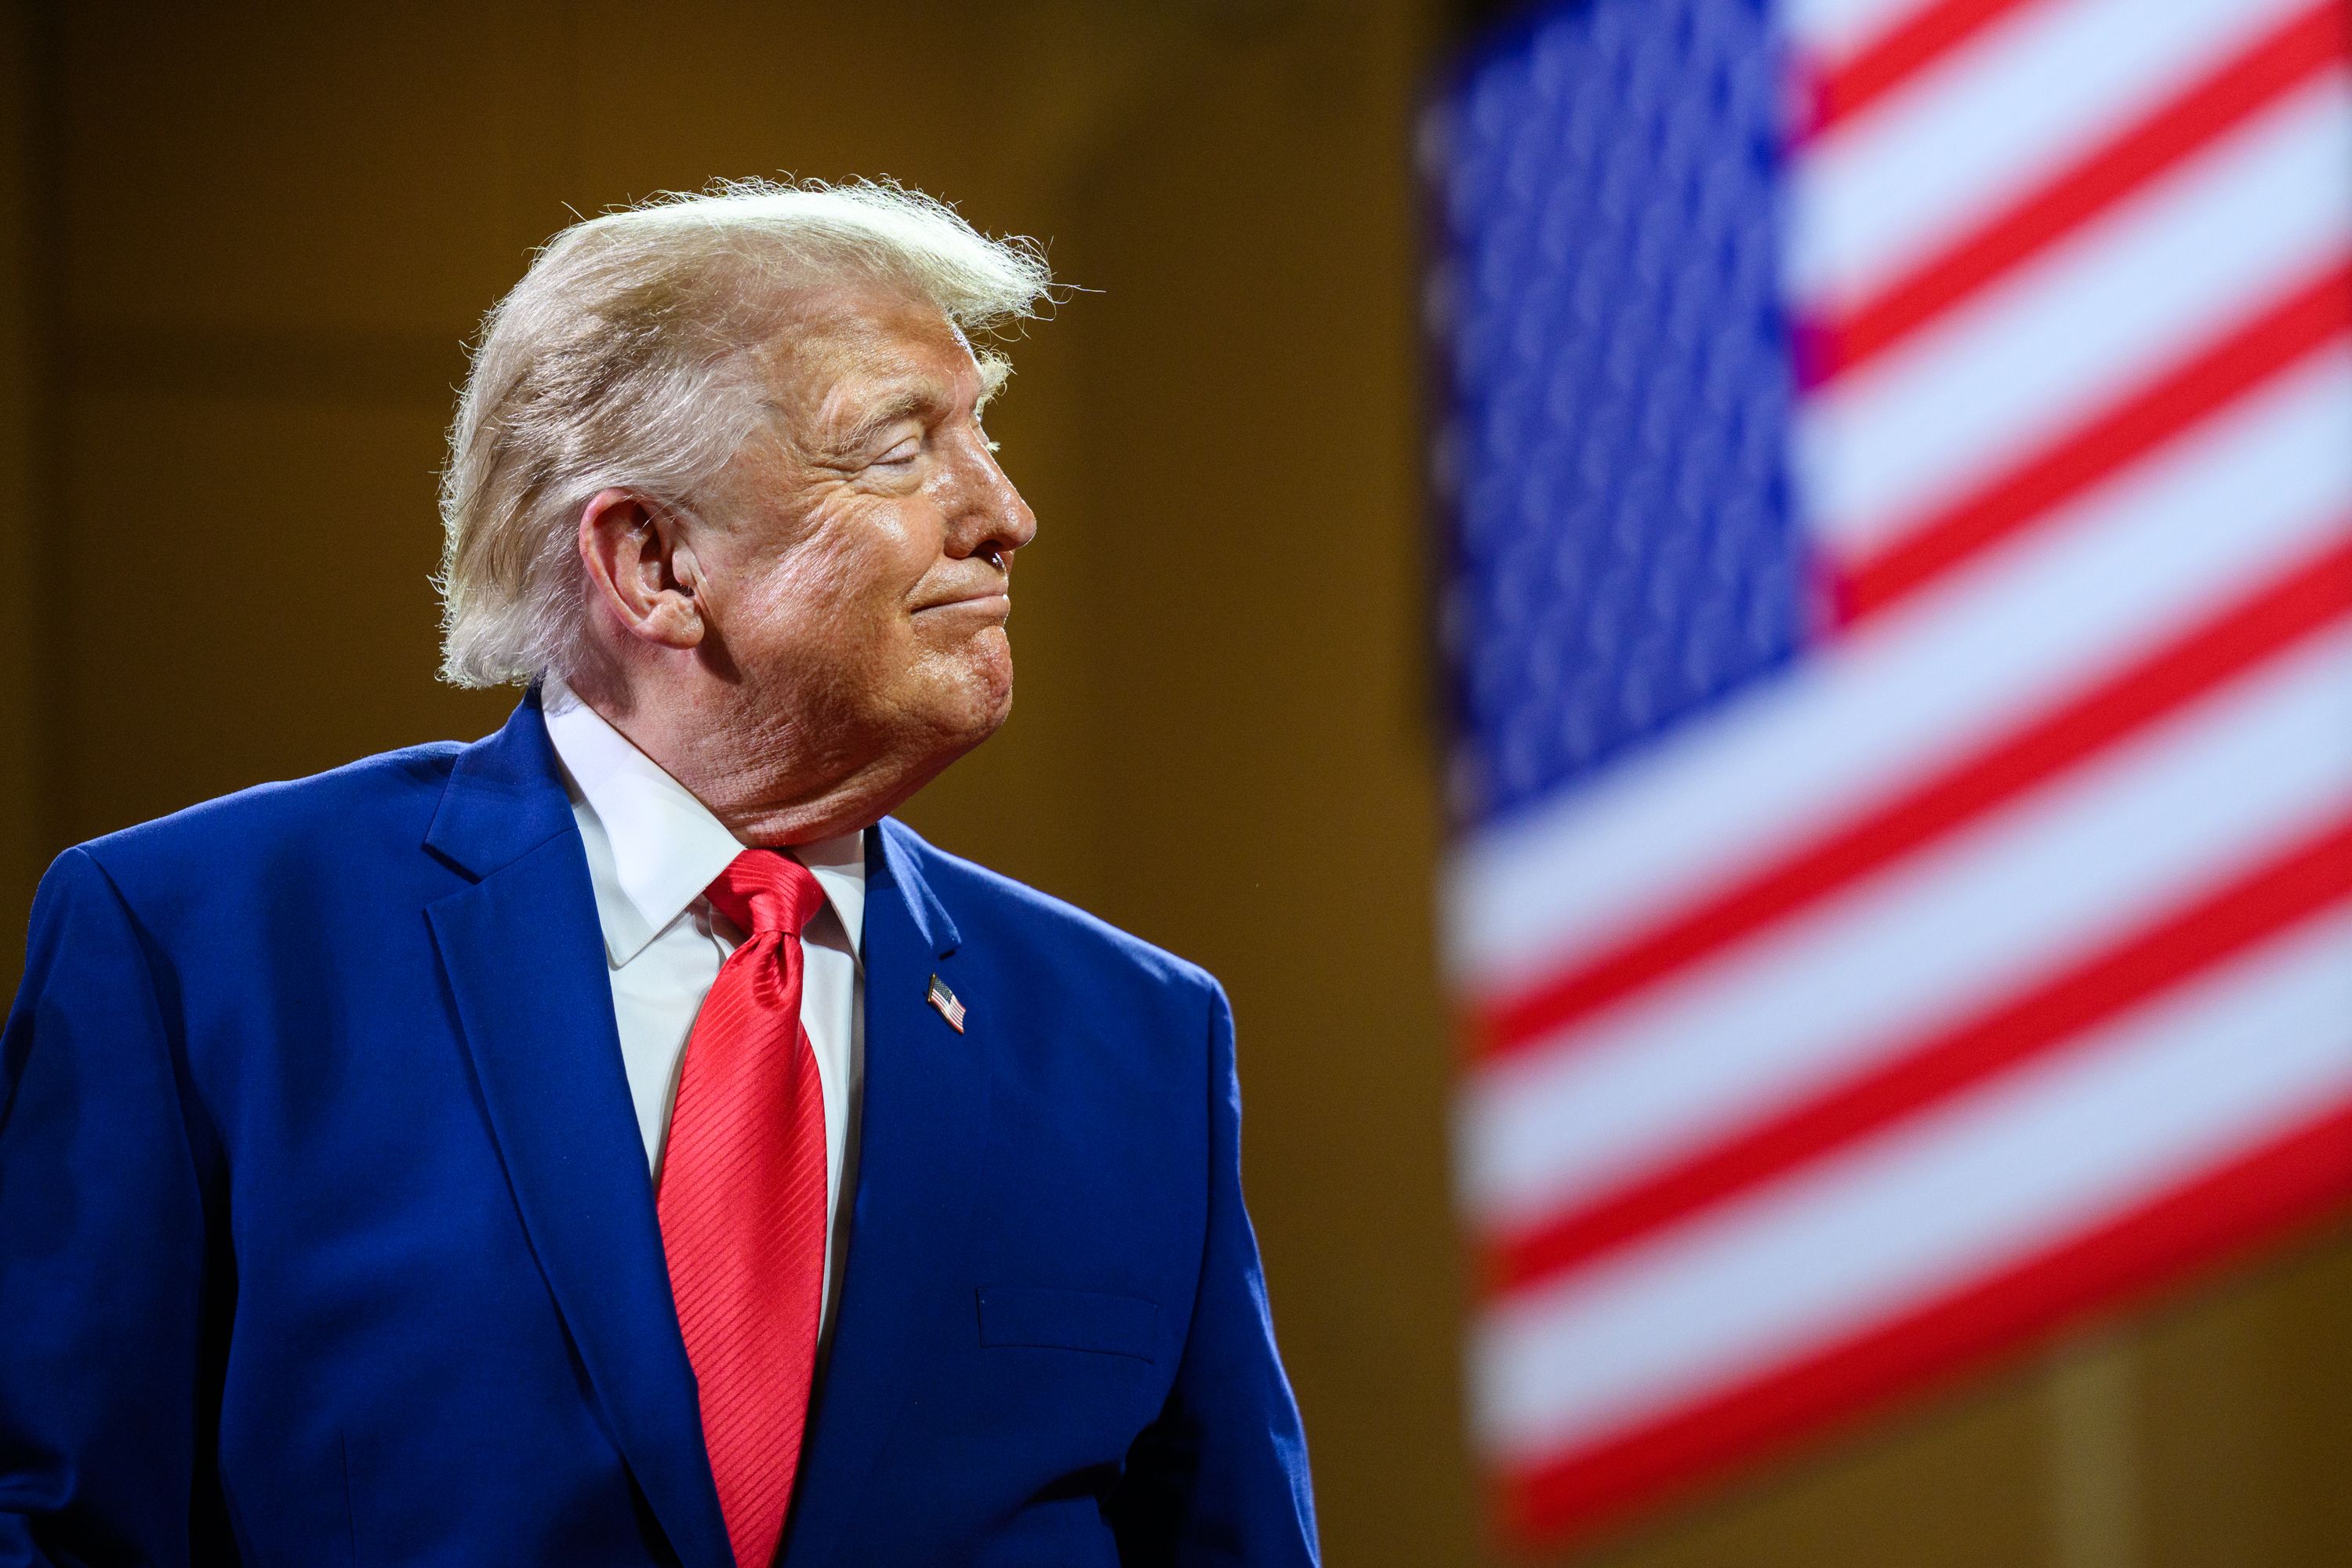
Democrats are expected to retake one or both houses of Congress on Nov. 3. Image source: Official White House Photo by Molly Riley.
According to nearly a century of historical data, a worst-case scenario is shaping up for the stock market on Nov. 3.
Change is widely expected on Capitol Hill, and that’s historically bad news for Wall Street
Although not every law passed on Capitol Hill has a bearing on Wall Street, our elected officials are responsible for crafting fiscal policy that can directly affect corporate America and, in turn, the stock market.
Heading into the midterm elections. Republicans hold a slim majority in the House of Representatives (218 of 435 seats) and the Senate (53 of 100 seats).
According to prediction market Polymarket, as of the very early morning hours of Oct. 20, traders predict a 63% chance of Democrats retaking the House and Senate on Nov. 3. Traders also assign a 29% chance that Republicans retain the Senate and lose the House to Democrats. Either way, the odds are overwhelming that Congress will be divided beginning in January 2027.
PolyMap Midterms Senate Outlook:
Senate Control: 🔵 DEM 60%
Projected: 🔵 52 – 🔴 48🔵 Not up for election: 34
🔵 Safe DEM: 12
🔵 Likely DEM: 1 (MN)
🔵 Lean DEM: 3 (AK, MI, TX)
🟡 Toss-up: 3 (IA, OH, ME)
🔴 Lean GOP: 2 (NE, KS)
🔴 Likely GOP: 1 (SC)
🔴 Safe GOP: 13
🔴 Not up for election: 31🔄 Projected flips to DEM: NC, AK, TX, OH, ME
🔗 https://t.co/k6FIk3TENM
— Polymarket (@Polymarket) October 13, 2026
Historically speaking, a Republican president overseeing a divided Congress is the stock market’s worst-case scenario. Online retirement planning platform Retirement Researcher examined the average annual return of the S&P 500 under four political situations from 1926 through 2023 and found only one outlier:
- Democratic president with a divided Congress (15 years): 16.63% average annual return
- Unified Republican (13 years): 14.52% average annual return
- Unified Democrat (36 years): 14.01% average annual return
- Republican president with a divided Congress (34 years): 7.33% average annual return
If the scenario widely expected to play out comes to fruition, stock market returns could be far below average over the coming two years.

Image source: Getty Images.
Perspective provides the full story
Although history has a knack for forecasting the future on Wall Street, perspective can provide investors with the full story.
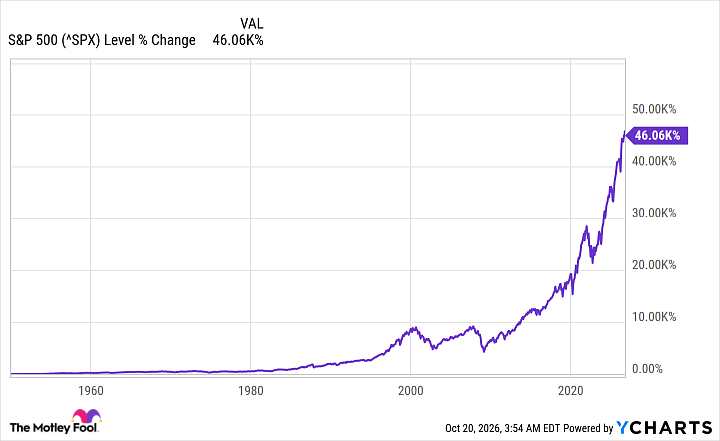
While a 7.33% average annual return for the benchmark S&P 500 is notably lower than all other political situations that Retirement Researcher analyzed, taking a step back and examining the big picture shows that stock returns are still superior to other asset classes (bonds, commodities, and real estate) over the long term.
Additionally, political gridlock can be a positive, in certain situations, for the stock market. A divided Congress makes it unlikely that major legislation will be signed into law. Though a divided Congress can make future debt-ceiling negotiations challenging, the legislative stalemate on most other issues leads to a sense of predictability that investors tend to appreciate.
No matter how the political puzzle pieces have been arranged in the past, the stock market has always managed to march higher in the long run.


