
If a Stock Market Crash Is Coming, History Says This 1 Investing Move Has Never Once Failed

Key Points
-
Multiple metrics suggest the stock market could be overvalued.
-
Not all stocks will survive a downturn, so choosing investments wisely is key right now.
-
A long-term outlook is key to building substantial wealth in the stock market.
After a year of record-breaking gains, the stock market is wobbling. The S&P 500 (SNPINDEX:^GSPC) and Dow Jones Industrial Average (DJINDICES:^DJI) are each down around 3% from their October highs, while the tech-heavy Nasdaq Composite (NASDAQINDEX:^IXIC) has fallen by nearly 9%.
Investors are also feeling uneasy about the future. The Fear and Greed Index — which measures investor sentiment on a scale of 0 to 100 — sits at just 24, as of this writing, edging into the “extreme fear” category.
Missed Nvidia in 2009? This Rare Signal Is Flashing Again. In 2009, a “Double Down” signal flashed for a little-known chipmaker called Nvidia. For the first time in years, that same “Total Conviction” signal is flashing for a company 1/100th the size of Nvidia. Continue »
The unfortunate news for investors is that multiple market metrics suggest more volatility could be looming. However, history says the right strategy can set your portfolio up for long-term success.
The market could be in bubble territory
The S&P 500 Shiller Cyclically Adjusted Price-to-Earnings (CAPE) Ratio is one market metric that has been sounding the alarm over the last several months. This metric measures the S&P 500’s long-term inflation-adjusted earnings to track the index’s valuation over time.
A higher figure suggests the S&P 500 may be overvalued, and eventually, the market tends to correct itself with a pullback.
In 1929, for instance, this ratio spiked ahead of the Great Depression. It surged again in 1999, at the height of the dot-com bubble. Now, it’s currently at its second-highest level in history.
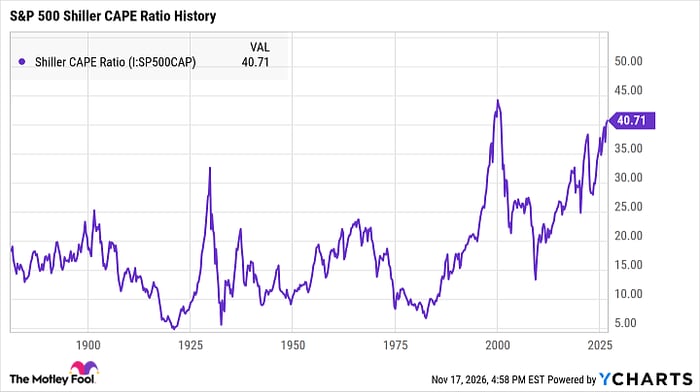
Shiller CAPE Ratio data by YCharts
The Shiller CAPE Ratio isn’t the only metric warning about valuations, however, as the Buffett indicator is also in record-breaking territory.
This indicator measures the relationship between the total value of U.S. stocks and GDP, with a higher percentage indicating richer valuations. It was named after Warren Buffett, who popularized it during the dot-com bubble, noting that when this percentage nears 200%, investors are “playing with fire.” As of this writing, it sits at around 227%.
History says this move has never failed
Investing in quality stocks and holding them for the long term is the historically proven best way to protect your portfolio against market crashes or recessions.
Many stocks can thrive during strong economic times, but those with weak underlying business fundamentals may not survive a bear market. The dot-com bubble is perhaps the clearest recent example of this, as countless tech stocks ballooned to record valuations, only to crash just a few years later when the industry collapsed.
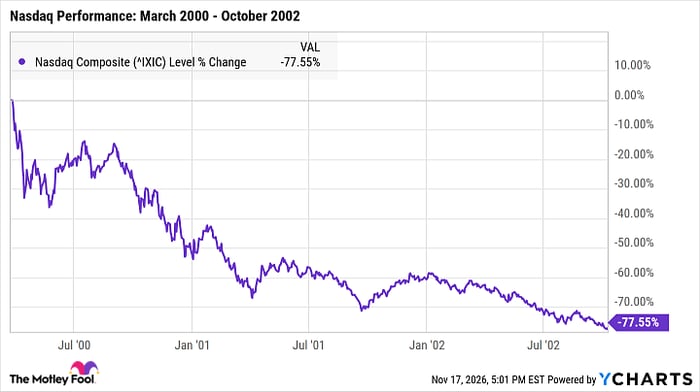
That said, many tech companies from that era not only survived the bubble burst, but went on to become industry leaders.
The stocks most likely to pull through are those with a strong foundation, such as a durable competitive advantage, healthy financials, and a sustainable business model. While they’ll still likely experience short-term volatility, they’re your best bet for earning positive long-term returns.
In the last two decades, we’ve experienced multiple historic downturns — from the dot-com bubble to the Great Recession to the COVID-19 crash and the 2022 bear market. Since January 2000, however, the S&P 500 has earned total returns of nearly 724%.
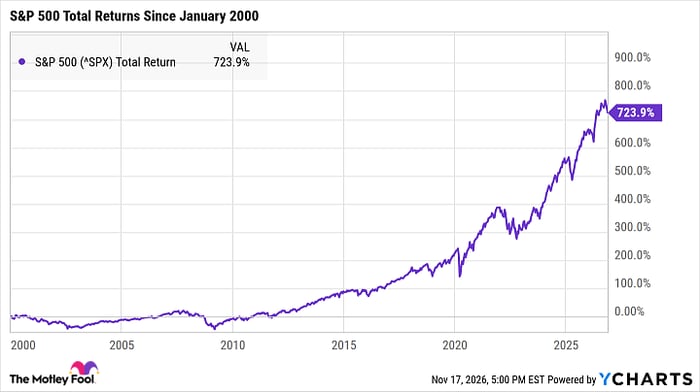
This isn’t just a recent trend, either. Since 1919, the S&P 500 has ended every single rolling 20-year period with positive total returns, according to analysis from Crestmont Research.
No matter how severe the short-term volatility may be, healthy stocks have always thrived over time. By loading up on these investments now, you’ll be well-prepared for whatever may be coming.
Should you buy stock in S&P 500 Index right now?
Before you buy stock in S&P 500 Index, consider this:
The Motley Fool Stock Advisor analyst team just identified what they believe are the 10 best stocks for investors to buy now… and S&P 500 Index wasn’t one of them. The 10 stocks that made the cut could produce monster returns in the coming years.
Consider when Netflix made this list on December 17, 2004… if you invested $1,000 at the time of our recommendation, you’d have $321,850!* Or when Nvidia made this list on April 15, 2005… if you invested $1,000 at the time of our recommendation, you’d have $955,232!*
Now, it’s worth noting Stock Advisor’s total average return is 793% — a market-crushing outperformance compared to 203% for the S&P 500. Don’t miss the latest top 10 list, available with Stock Advisor, and join an investing community built by individual investors for individual investors.
*Stock Advisor returns as of November 19, 2026.
Katie Brockman has no position in any of the stocks mentioned. The Motley Fool has no position in any of the stocks mentioned. The Motley Fool has a disclosure policy.