Written by Convera’s Market Insights team
CPI seals the deal on a Fed cut
Boris Kovacevic – Global Macro Strategist
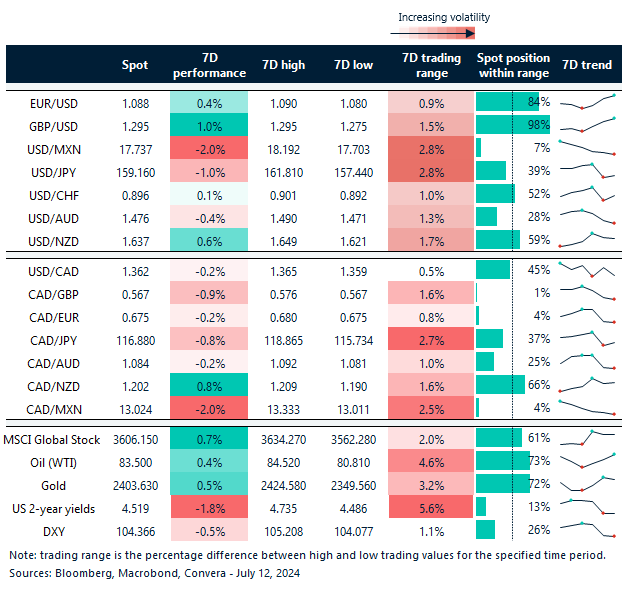
The two-year Treasury yield plunged more than 12 basis points from 4.62% to 4.50% and the US dollar index tumbled to its lowest in five weeks after the US CPI report showed inflation slowed more than expected last month. Earlier in the week, Fed Chair Jerome Powell stated the central bank needed more confidence that inflation was slowing before moving on rates. This print may have given him that. Softer data in recent weeks have further stoked concerns about an abrupt US slowdown as well. Thus, traders are now seeing as much as 60 basis points of rate cuts this year, i.e. definitely two cuts and a possibility of a third. The dollar is naturally under pressure with the 104 handle on the DXY a key support level in focus. If the US 2-year yield holds 4.5%, this could limit further losses, but the bond market is also pricing in more cuts out into 2025, and that could keep the dollar under pressure.
A development that came to a surprise to a lot of investors was the sharp drop of major US equities indices with the Nasdaq shedding 2% of its value and recording its weakest day since mid-April. It is the worst reaction to an inflation disappointment since the Fed started hiking rates in early 2022. One interpretation is that markets already priced in a lot of the good news as it relates to the expected Fed cuts. However, another explanation would be that markets didn’t discount easier policy enough and that inflation has now given the Fed the green light to cut. This has led capital from the overbought tech space into value and small caps, pushing the Russel 2000 to its best week this year so far.
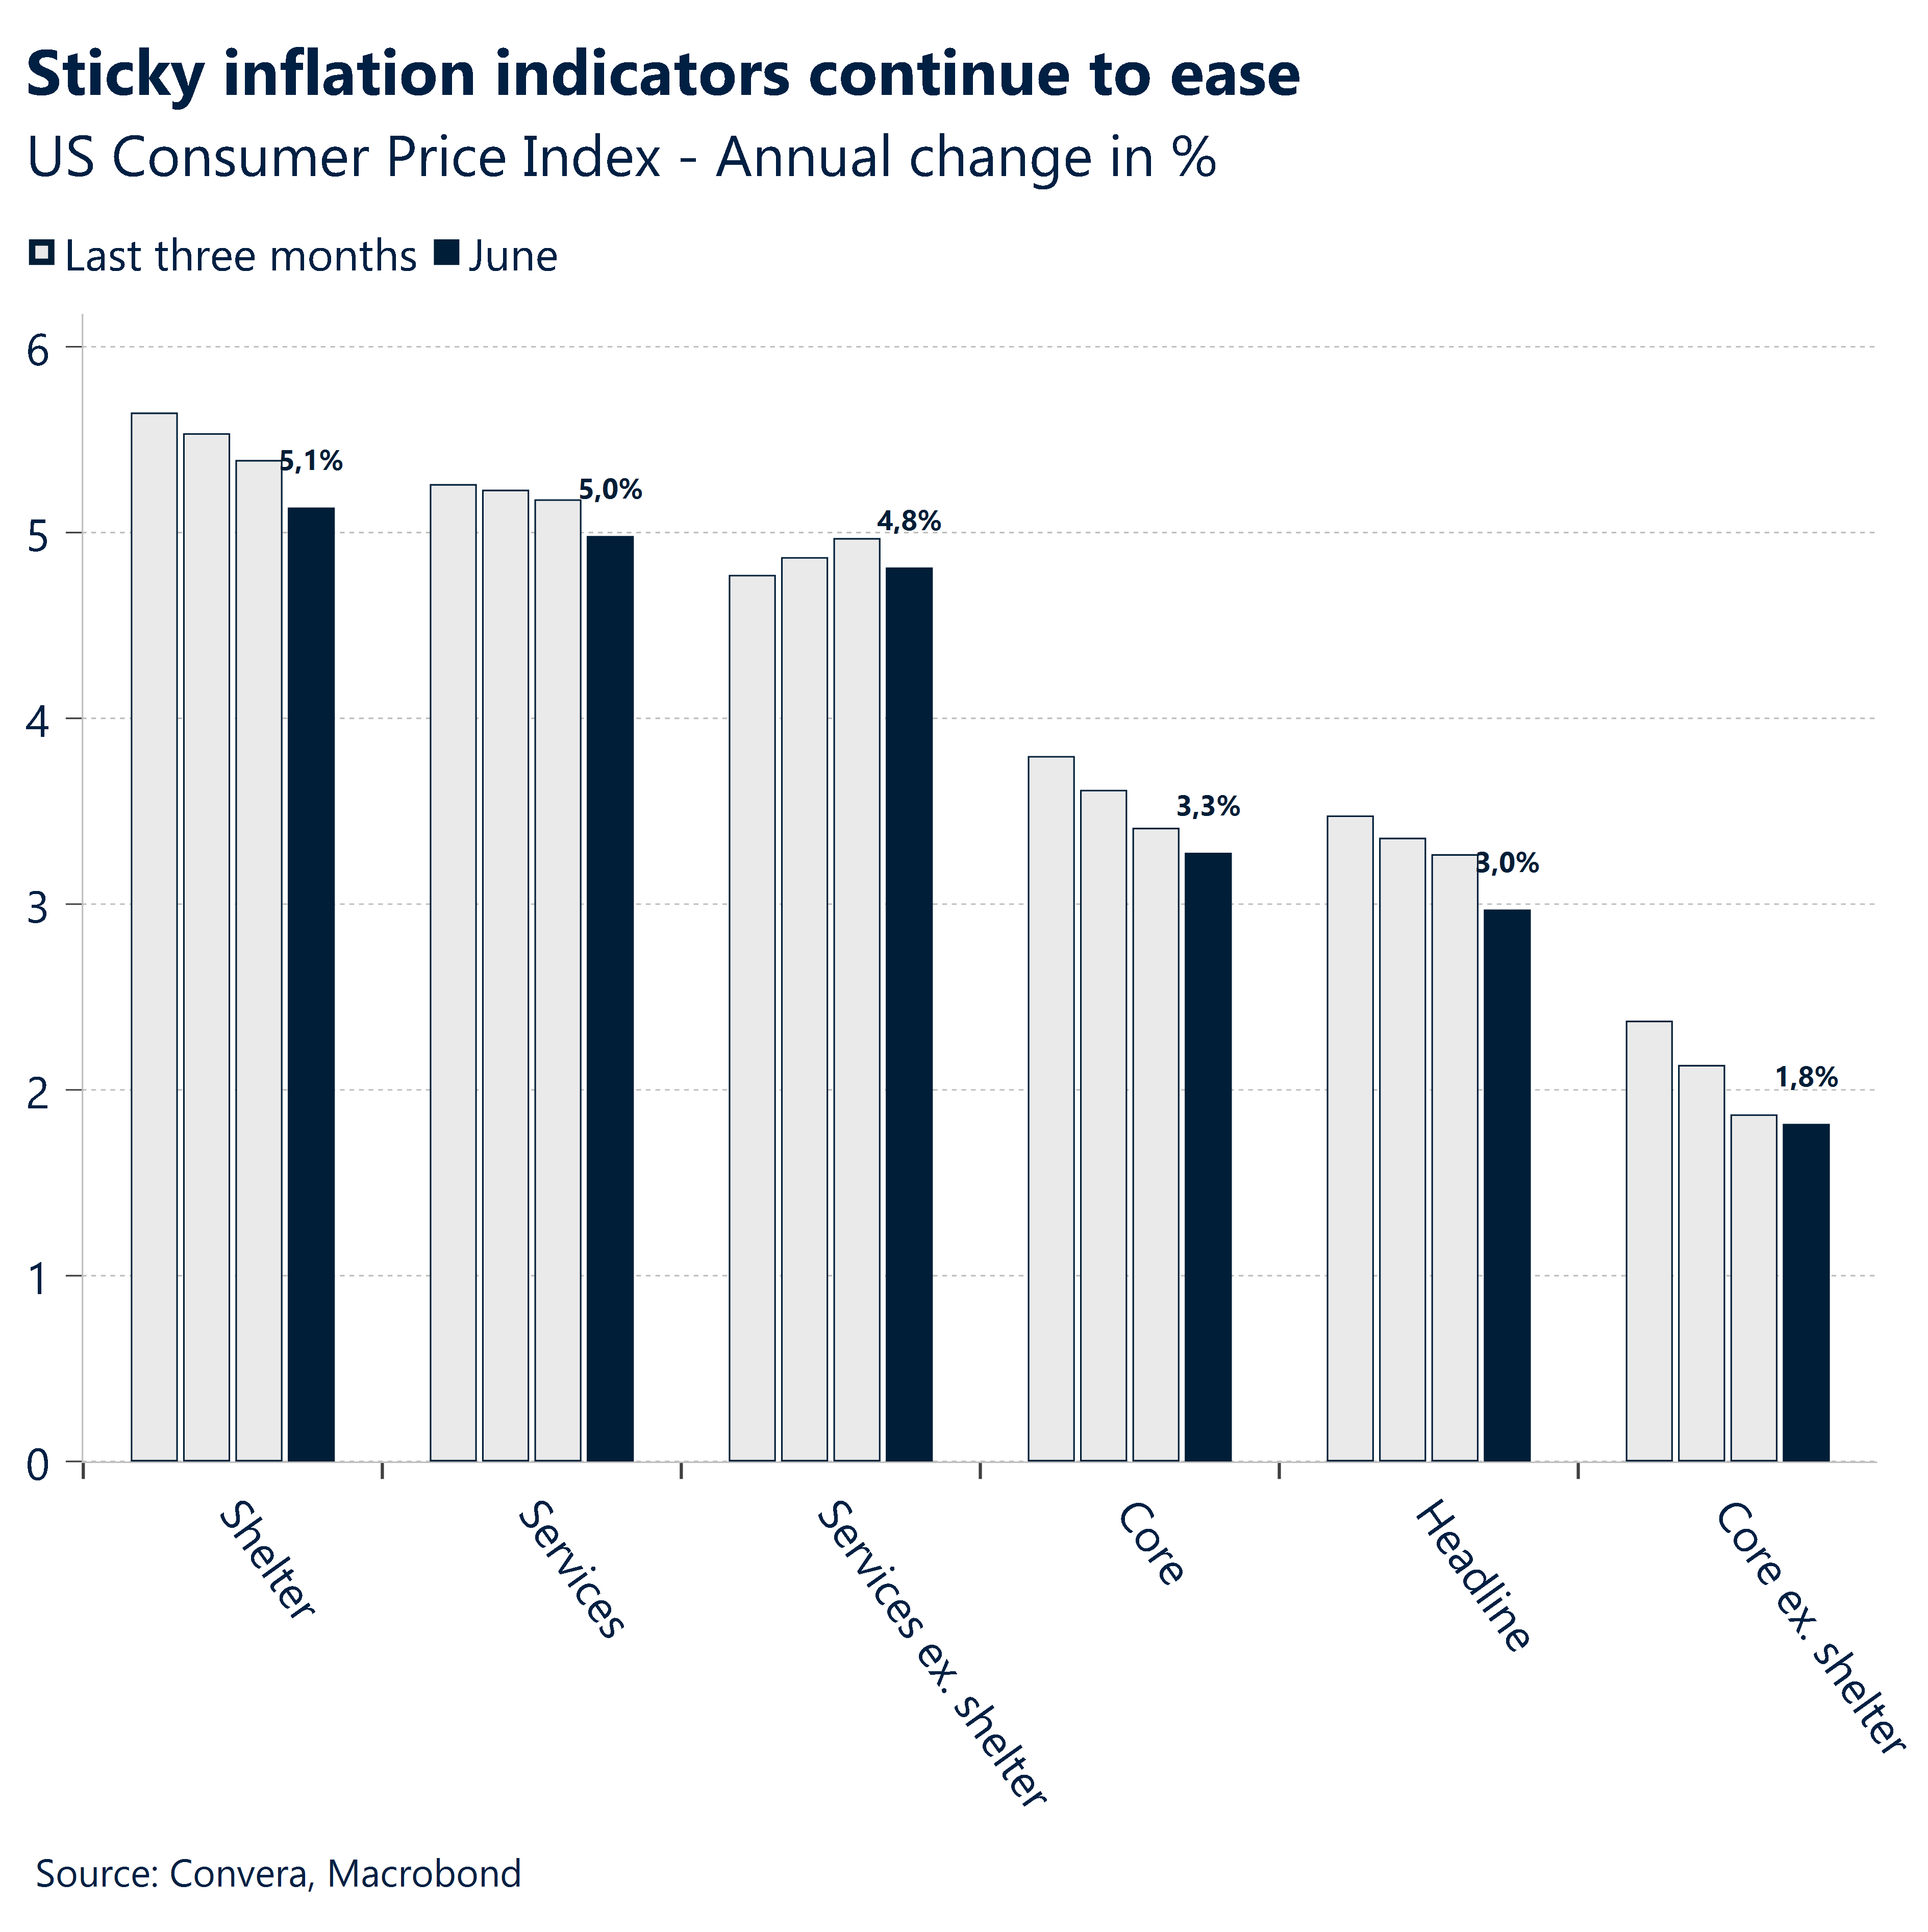
The reason for the capital allocation does not matter too much for our macro thesis and the declining US dollar. Inflation declined on a monthly basis for the first time since the pandemic. Sticky indicators like core, shelter and services inflation continued to ease in June as the headline figure fell to 3.0%. Going into the last day of the week, attention will turn to the producer price index, which is expected to show an increase from 2.2% to 2.3% in June. This is consistent with our assumption of continued disinflation in the consumer space while the reflation in the industrial sector starts building up again. This could become a problem for the Fed down the line. For now, markets cheer and welcome the news of lower inflation.
Pound jumps to 1-year high
George Vessey – Lead FX Strategist
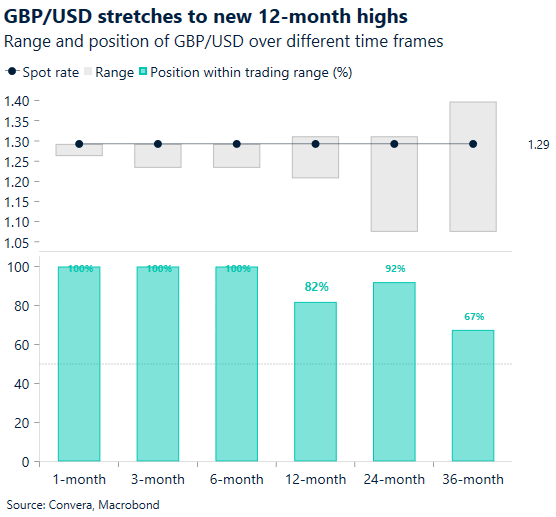
Sterling rose over a cent against the US dollar to $1.2949 yesterday, the highest since July 2023 and taking out its key 200-week moving average ($1.2850), which if it closes the week above, could prompt further upside. Hawkish comments from Bank of England (BoE) policymakers, stronger UK GDP data and a softer US inflation report fuelled the climb.
The pound has outperformed all its major peers this year on expectations the BoE will have to keep interest rates at 16-year highs for longer due to the surprisingly robust economic recovery, and lingering concerns about stubborn services inflation and wage pressures. The UK economy expanded (0.4%) at twice the pace expected in May, putting Britain on course for another solid quarter of expansion after enjoying the strongest GDP growth in the G7 in Q1. While some central banks are already cutting rates, the BoE has hinted an August rate cut may be off the table as inflation is expected to pick-up again as a result. Money markets are currently pricing a roughly 50% chance of a cut in August and 49 basis points of easing in total by the end of the year.
This bodes well for the pound’s outlook, which is also supported by optimism the newly-elected Labour government will bring a period of political calm and a steady approach to the nation’s finances. Turbo-charging the pound’s recent uplift was data showing US inflation cooled last month, boosting bets of more Fed rate cuts this year and next.
Euro rallies after soft US CPI data
Ruta Prieskienyte – Lead FX Strategist
The euro surged to a five-week high, driven by a weakening US dollar on the back of a lower-than-expected US CPI report which reinforced hopes of a Fed rate cut in September. European stocks and bonds trended higher as investors cheered the news. Although largely ignored, German inflation eased to 2.5% in June, confirming earlier data and confirming the possibility of another rate cut by the ECB in September.
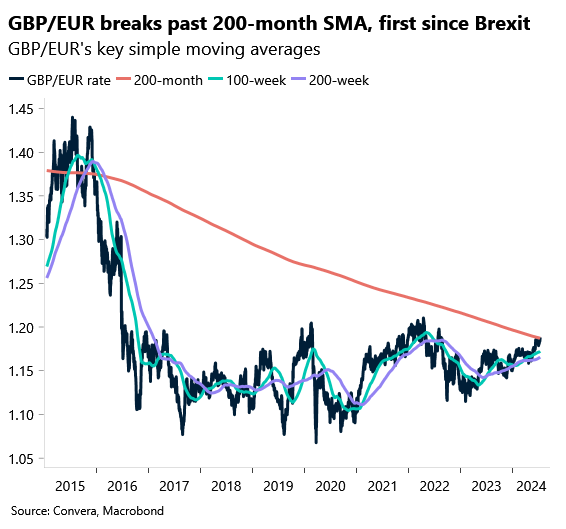
The Euro index, which tracks the performance of the common currency against a basket of leading global currencies, remained broadly unchanged on the day but is on track for its third consecutive weekly rise. The index was mostly weighed down by the severe losses against the Japanese yen. Having touched its highest level since the euro’s launch sheer moments prior to the US CPI release, the EUR/JPY pair oddly plunged by over 1.4% post announcement, fuelling expectations of an intervention by the Japanese officials. Similar sharp moves in JPY spot were also observed against the other majors. EUR/SEK also retreated upon the release of a survey indicating that Swedish long-term inflation expectations edged above the Riksbank’s target of 2%. GBP/EUR broke past the 200-month SMA barrier, a level it has been unable to trade above since 2015.
EUR/USD threatened to break the $1.09 resistance level but was met with fading interest. The rates moves eroded the dollar’s yield advantage over the euro as DE-US 2-year spreads broke resistance near -170bps and hit their tightest since early March. The pair is on track for its third consecutive weekly gain and the increased market confidence that the Fed may be growing more comfortable in moving toward rate cuts may soon put $1.10 on the agenda for the euro. In the options market, 1-week EUR/USD risk reversal skew tightened to -0.128 in favour of euro puts, its least bearish in over a month.
Yen surges post US CPI report
Table: 7-day currency trends and trading ranges
Key global risk events
Calendar: July 08-12
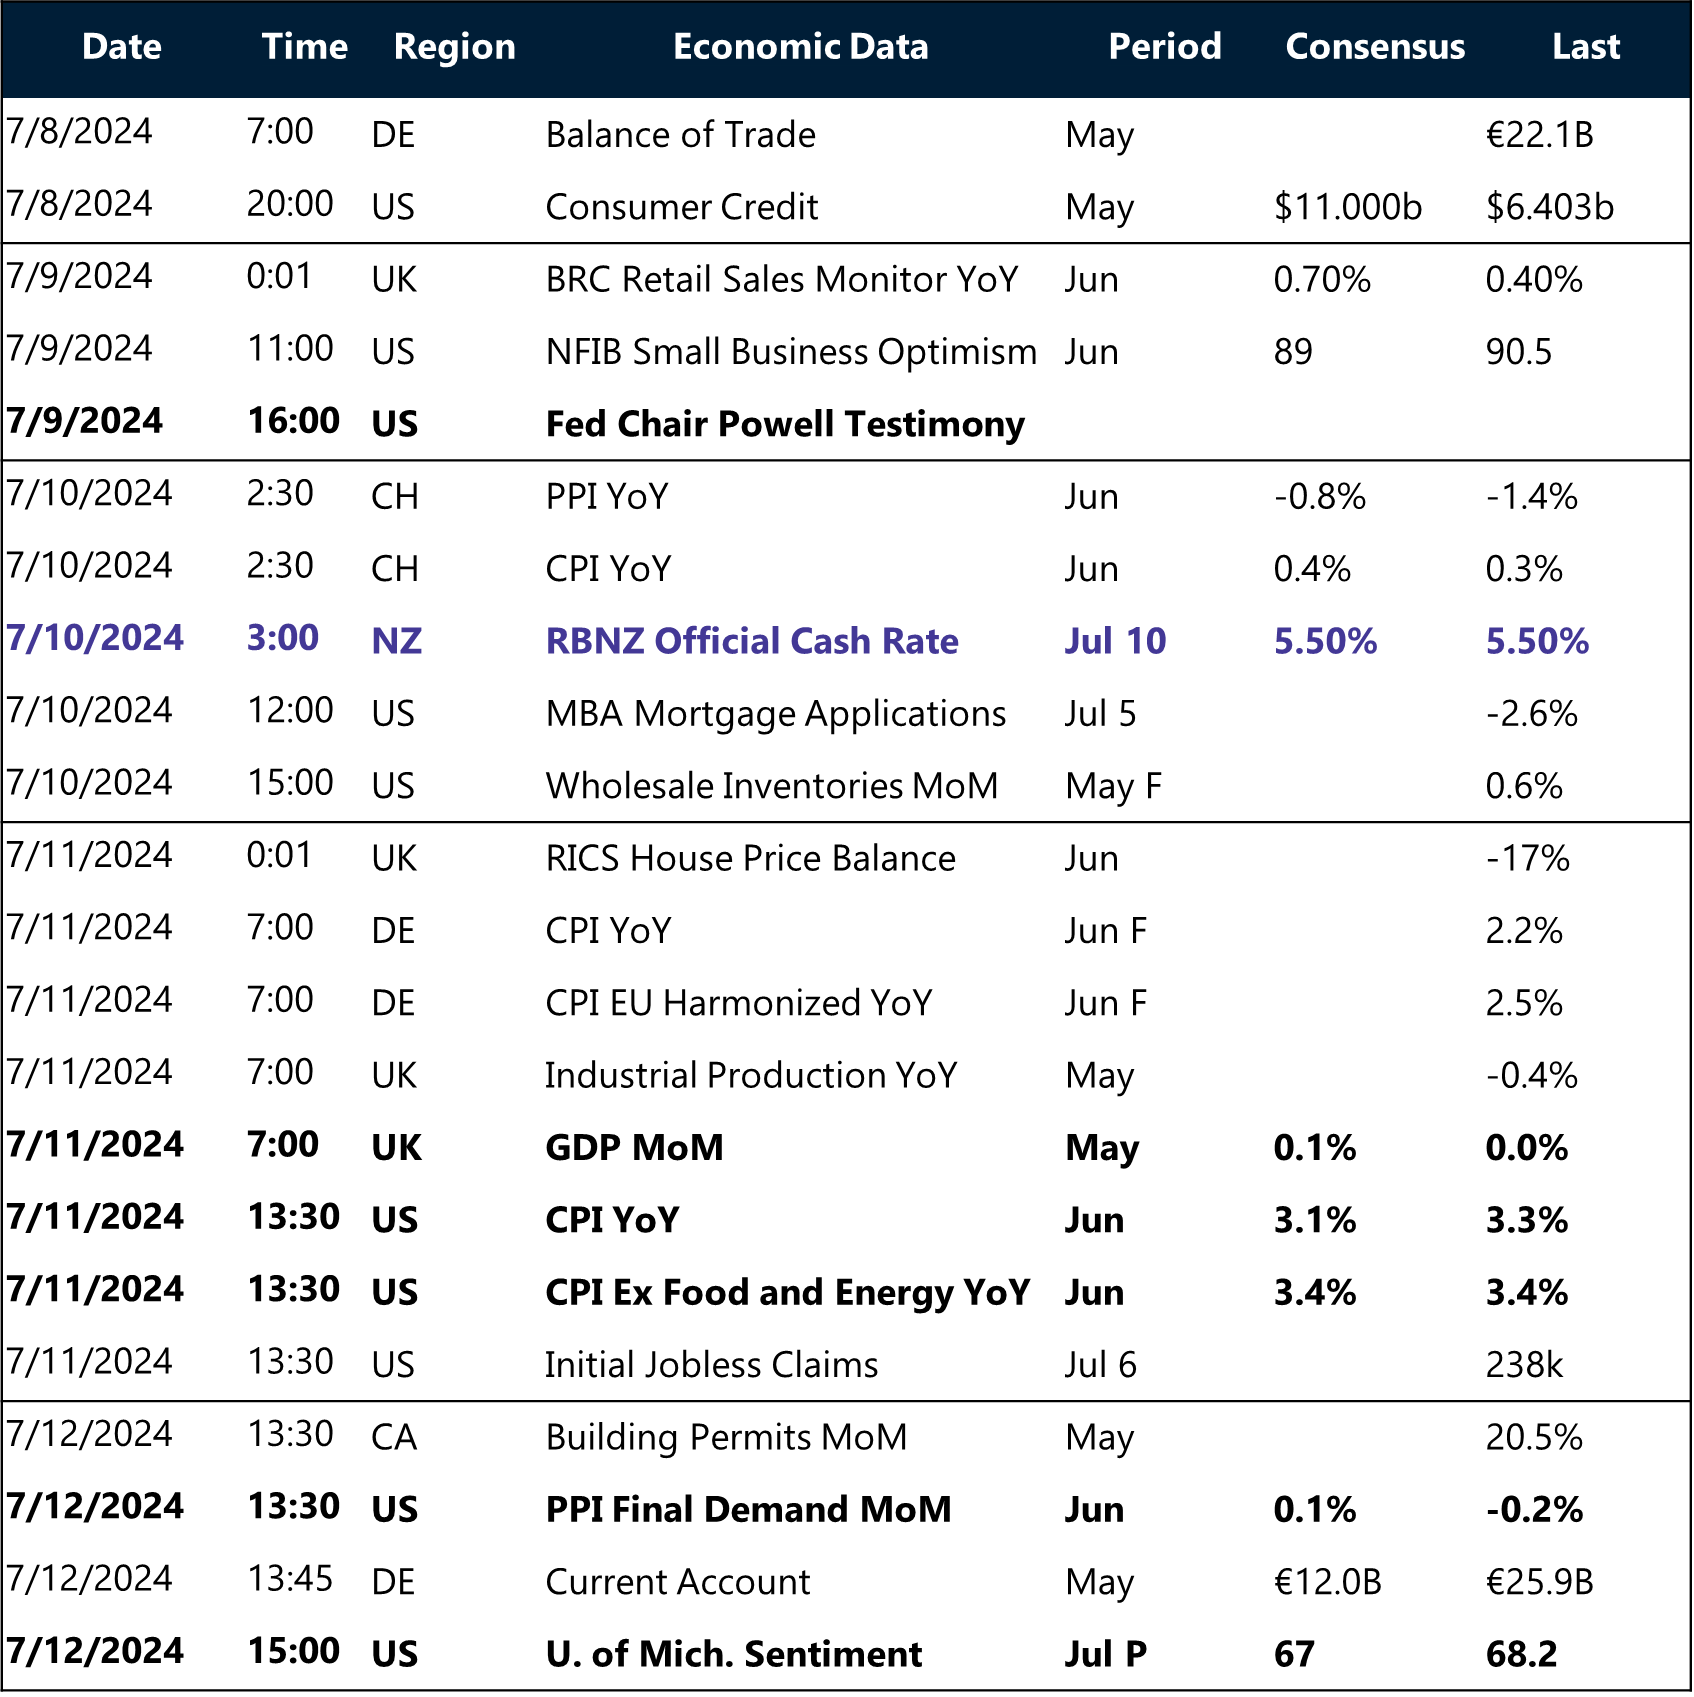
All times are in BST
Have a question? [email protected]
*The FX rates published are provided by Convera’s Market Insights team for research purposes only. The rates have a unique source and may not align to any live exchange rates quoted on other sites. They are not an indication of actual buy/sell rates, or a financial offer.


