
Over the weekend Niti Aayog CEO BVR Subrahmanyam declared that India had overtaken Japan to become the fourth-largest economy in the world. He based this claim on data from the International Monetary Fund (IMF).
This claim reportedly led to two fairly divergent reactions.
First, a wave of self-congratulation among Indians who take this particular detail as a clinching argument that the government of the day has brought about a fundamental improvement in India’s economy.
Second, an examination of the claim and a counter-assertion, again based on IMF data, that India is still the fifth-largest economy, not the fourth.
As it often happens in these days of deeply polarised opinions, the discussion has fast reduced to a dialogue of the deaf.

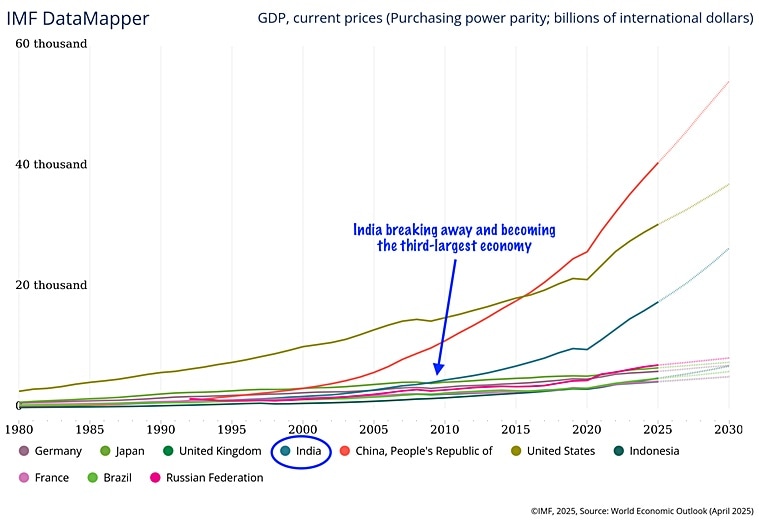
Before answering, let’s broaden the scope of this explainer by making another claim (also based on IMF data): India is the third largest economy in the world, and, the fact is, it has been that way since Prime Minister Manmohan Singh-led UPA days.
Here’s the proof: Look at CHART 1. It shows India’s GDP (dark green line) breaking away from the rest of the bunch. India became the third largest economy in 2009, when it, curiously enough, overtook Japan.
Story continues below this ad
An aside: There is one more pertinent break in this chart: It comes in 2016 when China overtakes the US as the largest economy in the world. The year 2016 is crucial as it was the year when the US first elected Donald Trump and what has followed since is a dedicated US policy to contain China’s growing economic might not just under Trump but also under President Biden.
Anyway, coming back to the status of India’s economy.
Chart 1 should raise at least one of the following two questions.
Those who have been celebrating India’s rise as the fourth-largest economy might wonder how this particular calculation — that shows India becoming the third largest economy as early as 2009 — is done.
Story continues below this ad
And those who have been quibbling over when exactly will India overtake Japan are more likely to wonder why this fact — one that pegs India even higher in terms of GDP — has been ignored by the current government for the past 11 years.
To understand all these issues one has to understand both the economics and the politics of such economic rankings.
The Economics
Suppose you and your classmate both get a similar kind of job, and both get roughly the same salary. You get Rs 50,000 per month and he gets Rs 45,000 per month.
Who is doing better? You, decidedly.
Now let’s add another detail.
Your job is in Mumbai or Bangalore while your friend’s job is in say Patna or Lucknow.
Now, who is doing better now?
Story continues below this ad
If your answer is that your friend is better off then you intuitively grasp the concept of “cost of living”. It is different from “inflation”. The cost of living captures the purchasing power of your salary: What can you buy from the same amount of money?
For instance, the rent of a similar-sized apartment is likely to make a much bigger dent in your Mumbai salary than in your friend’s lower salary in Patna. Of course, prices may not vary for everything — a motorcycle is likely to be similarly priced in both cities but it is quite possible that a motorcycle will not help your commute in Mumbai while it is likely to be enough for your friend in Patna.
Purchasing power changes both over time — recall how your parents or grandparents often reminisce about what all they could buy for say Rs 100 or even Rs 10 in “their time” — and over space — as exhibited from example above.
The point is: How do we know that France or Japan is a bigger and better economy than India?
Story continues below this ad
One approach is to look at the nominal GDP: That is to add up the current market value of all final goods and services produced within the geographical boundaries of an economy in a year. Alternatively, you could add up the current incomes accruing to everyone in the economy.
This variable — nominal GDP — is the one over which the current controversy is based.
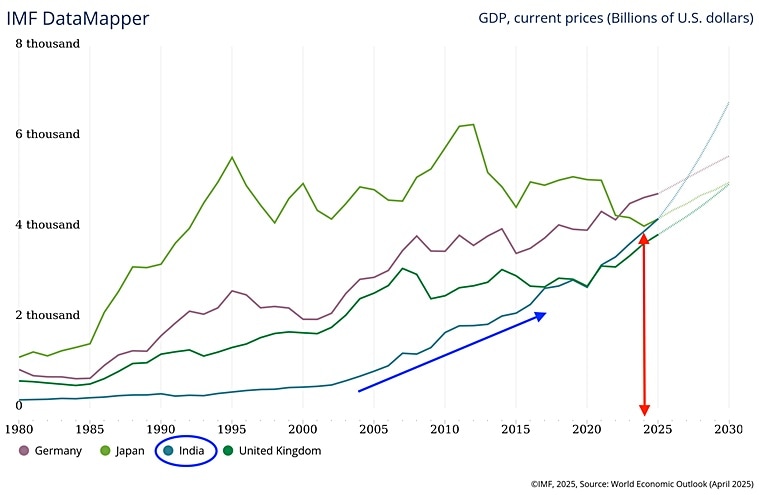
Look at CHART 2.
It shows how India overtook the UK in nominal GDP terms soon after the Covid pandemic. It is noteworthy that at that time Germany was the fourth-largest economy and Japan was the third-largest one.
CHART 2 further shows that as of the 2024 end, India was still behind both Japan and Germany but equally importantly, IMF’s projections (dotted line) show that India overtaking Japan and Germany is just a matter of time.
Story continues below this ad
A crucial thing to remember here is that nominal GDP that is plotted here in CHART 2 is in US dollar terms.
There are two straight problems this creates.
As an earlier edition of ExplainSpeaking explained, India’s GDP, even when it is counted in Indian rupees undergoes several revisions.
Two, converting the Indian GDP from rupees to US dollars requires the exchange rate. This exchange rate has gone up and down over the time.
In other words, if the Indian rupee weakens against the US dollar while the Japanese yen strengthens against the dollar, the relative positions can change even though the underlying GDP of India and Japan may not have changed even by one unit.
Story continues below this ad
But the bigger problem with nominal GDP comparisons is that they are not as meaningful because they miss out on the purchasing power aspect.
It is for this reason that the IMF also calculates GDP based on something called the Purchasing Power Parity.
What is PPP?
Now let’s say the tables are turned and your friend moves from Patna to Paris while your job is still in Delhi. On paper — that is, when you just convert his salary by exchange rate — he earns more than you. But here’s the odd thing: You find that he buys his mobile phones when he visits India, gets a haircut as well as a dental check, buys story books for his children, and sometimes even buys food items from India to carry back to France.
It is perfectly reasonable for him to do that because his purchasing power may not have gone above yours even though his nominal salary (when converted into Indian rupees) is higher than yours.
Story continues below this ad
Here’s another way to understand purchasing power. The cooking and cleaning services provided by maids in Indian cities are priced at a very low amount both in Indian rupees and even more so in euro or dollar terms. To get the same facility, your friend would have to be much richer (think GDP because all individual incomes add up to national GDP) than what you are in India.
To get a meaningful international comparison of GDP, the IMF uses the PPP estimates, provided by the International Comparisons Program (ICP), which is a global statistical initiative that produces internationally comparable Purchasing Power Parity (PPP) estimates.
It is according to those PPP-based GDP estimates that India became the third-largest economy way back in 2009.
The Politics
In nominal GDP terms (CHART 2), the Indian economy has made giant strides in overtaking some of the biggest economies. Of course, the Indian economy gets the credit for growing at around 6% to 7% on an average since 2004.
But to get a complete picture one must also look at the trajectory of the economies India has overtaken or is in the process of overtaking.
Barring the US and China, almost all western developed economies largely stagnated since the Global Financial Crisis of 2008. Japan is an extreme case: Its annual GDP in 2025 is projected to be lower than what it was in 1995 — 30 years ago.
It is much easier for any government to claim credit on nominal GDP terms. But in PPP terms, even though India has improved in its level over the years, its rank or relative position has not changed.
India was the third largest economy long before the current government took charge. Using the PPP metric affords no political mileage.
Upshot
If Indians look beyond petty points-scoring across the political divide, it will become clear that the Indian economy has a long, long way to go before even attempting to fake prosperity.
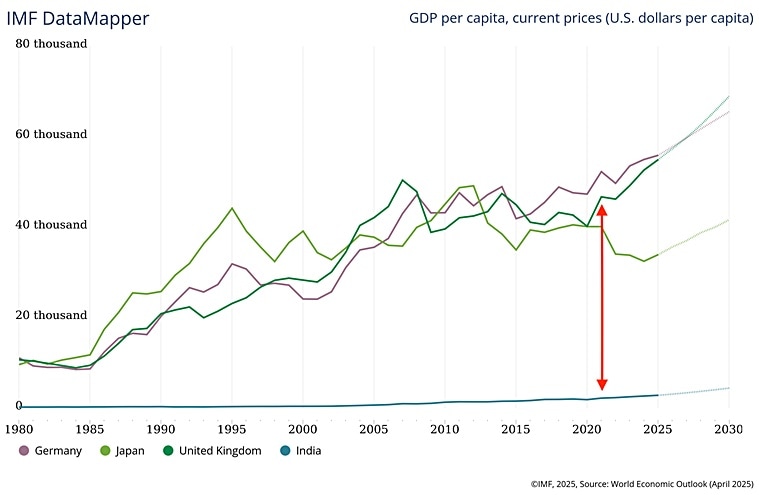
CHART 3 brings this out by mapping the per capita nominal GDP.
India overtook the UK in 2021 in aggregate nominal GDP terms but look at what has happened to per capita GDP.
In 2021, India’s nominal per capita GDP was $2,250 and UK’s per capita GDP was $46,115 — that’s more than 20 times India’s.
Since then India’s overall nominal GDP has been higher than the UK’s every year.
But as of 2025 end (the exact metric used by Subrahmanyam to claim India has overtaken Japan), UK’s nominal per capita GDP would be $54,949 while India’s per capita GDP would have risen to $2,879.
In other words, even as India’s overall nominal GDP is progressively higher than UK’s, per capita incomes in the UK have gone up by over $8,000 (that’s four times India’s actual average GDP) between 2021 and 2025 while India’s has gone up by around $600.
Another number that should provide perspective is that India’s nominal GDP in Indian currency is Rs 2.3 lakh per annum.
Even in terms of per capita GDP based on PPP, India languishes far below the world average. If the world average is 100, India is at 40% in terms of PPP based per capita GDP.
The question then is: When the incomes of an average Indian are so low and their annual growth rate so meagre, how useful is it to quibble over India’s rank on aggregate metrics?
Share your views and queries at udit.misra@expressindia.com
Take care,
Udit

