The Japanese Yen currency has been in a strong selloff for the past 12+ years.
Today we ask: Could the Yen finally be bottoming?
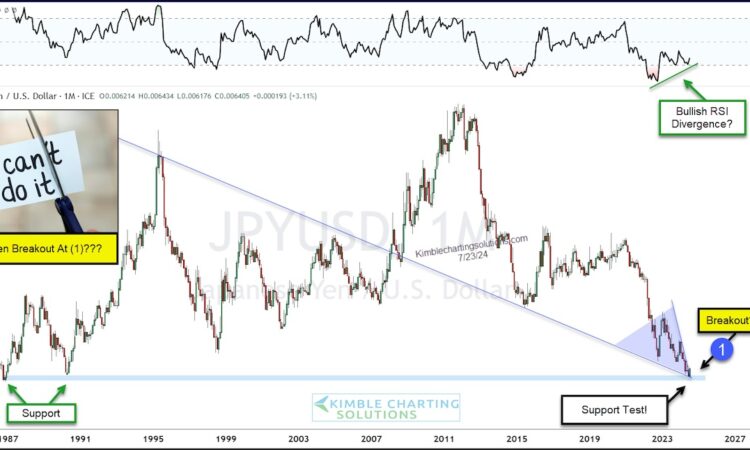
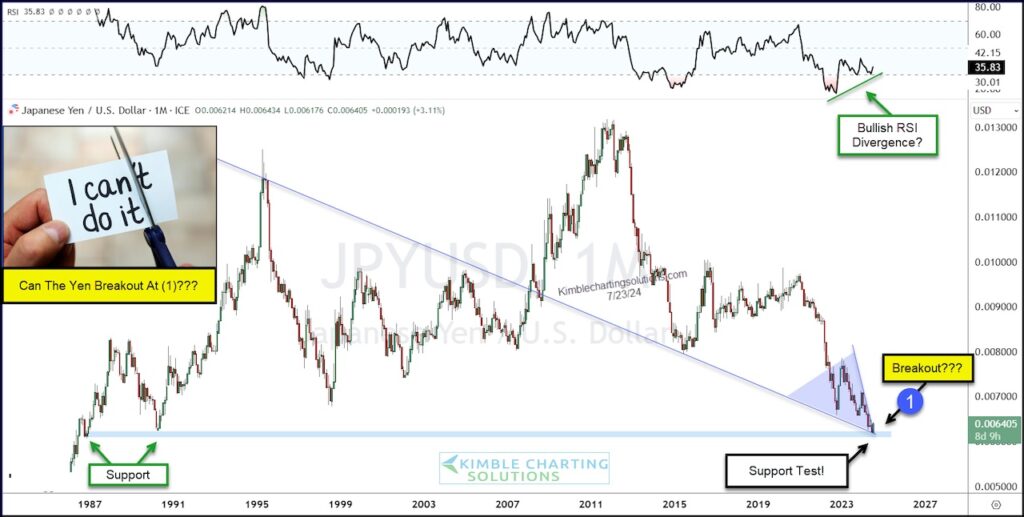
As you can see on the long-term “monthly” chart of the Japanese Yen below, the currency is in need of some bulls.
The latest selloff has the Yen testing its 30 year lows. BUT the current formation is a bullish falling wedge that gains support from a bullish rising RSI divergence.
Most important to note is that a breakout at (1) would be short-term bullish… with implications that could spread to longer term. Stay tuned!
Japanese Yen / U.S. Dollar “monthly” Chart

Note that KimbleCharting is offering a 2 week Free trial to See It Market readers. Just send me an email to services@kimblechartingsolutions.com for details to get set up.
Twitter: @KimbleCharting
The author may have a position in mentioned securities. Any opinions expressed herein are solely those of the author, and do not in any way represent the views or opinions of any other person or entity.
