
- GBP/USD stabilizes near 1.3500 following Tuesday’s bearish action.
- Technical sellers could look to retain control if GBP/USD breaks below 1.3500.
- In the absence of high-tier data releases, markets will focus on FOMC Minutes.
GBP/USD trades in a narrow channel slightly above 1.3500 on Wednesday after closing in negative territory and snapping a six-day winning streak on Tuesday. The pair’s technical outlook is yet to point to a bearish reversal but sellers could take action if the pair flips 1.3500 into resistance.
British Pound PRICE This week
The table below shows the percentage change of British Pound (GBP) against listed major currencies this week. British Pound was the weakest against the US Dollar.
| USD | EUR | GBP | JPY | CAD | AUD | NZD | CHF | |
|---|---|---|---|---|---|---|---|---|
| USD | 0.25% | 0.12% | 1.17% | 0.62% | 0.65% | 0.20% | 0.70% | |
| EUR | -0.25% | -0.12% | 0.96% | 0.36% | 0.40% | -0.05% | 0.44% | |
| GBP | -0.12% | 0.12% | 0.76% | 0.49% | 0.52% | 0.07% | 0.57% | |
| JPY | -1.17% | -0.96% | -0.76% | -0.54% | -0.52% | -1.02% | -0.45% | |
| CAD | -0.62% | -0.36% | -0.49% | 0.54% | 0.05% | -0.41% | 0.10% | |
| AUD | -0.65% | -0.40% | -0.52% | 0.52% | -0.05% | -0.49% | 0.05% | |
| NZD | -0.20% | 0.05% | -0.07% | 1.02% | 0.41% | 0.49% | 0.50% | |
| CHF | -0.70% | -0.44% | -0.57% | 0.45% | -0.10% | -0.05% | -0.50% |
The heat map shows percentage changes of major currencies against each other. The base currency is picked from the left column, while the quote currency is picked from the top row. For example, if you pick the British Pound from the left column and move along the horizontal line to the US Dollar, the percentage change displayed in the box will represent GBP (base)/USD (quote).
The US Dollar (USD) outperformed its rivals on Tuesday and weighed on GBP/USD, supported by an improving sentiment around the US economy on the back of upbeat data releases.
The Conference Board reported on Tuesday that the Consumer Confidence Index rose to 98.0 in May from 86.0 in April. Commenting on the survey’s findings, “consumers were less pessimistic about business conditions and job availability over the next six months and regained optimism about future income prospects,” said Stephanie Guichard, Senior Economist, Global Indicators at the Conference Board.
Meanwhile, the data published by the US Census Bureau showed that Durable Goods Orders declined by 6.3% in April, coming in better than the market expectation for a decrease of 7.9%.
In the late American session on Wednesday, the Federal Reserve (Fed) will publish the minutes of the May policy meeting.
Although investors don’t expect the Fed to cut the policy rate at the next meeting in June, comments on the policy outlook could trigger a market reaction. Investors are currently still pricing in about a 70% probability that the Fed will cut the policy rate at least twice this year. If the publication suggests that policymakers are reassessing the rate outlook to see whether a single rate cut is more likely, given the uncertainty surrounding the inflation outlook, the USD could gather strength and trigger another leg lower in GBP/USD.
GBP/USD Technical Analysis
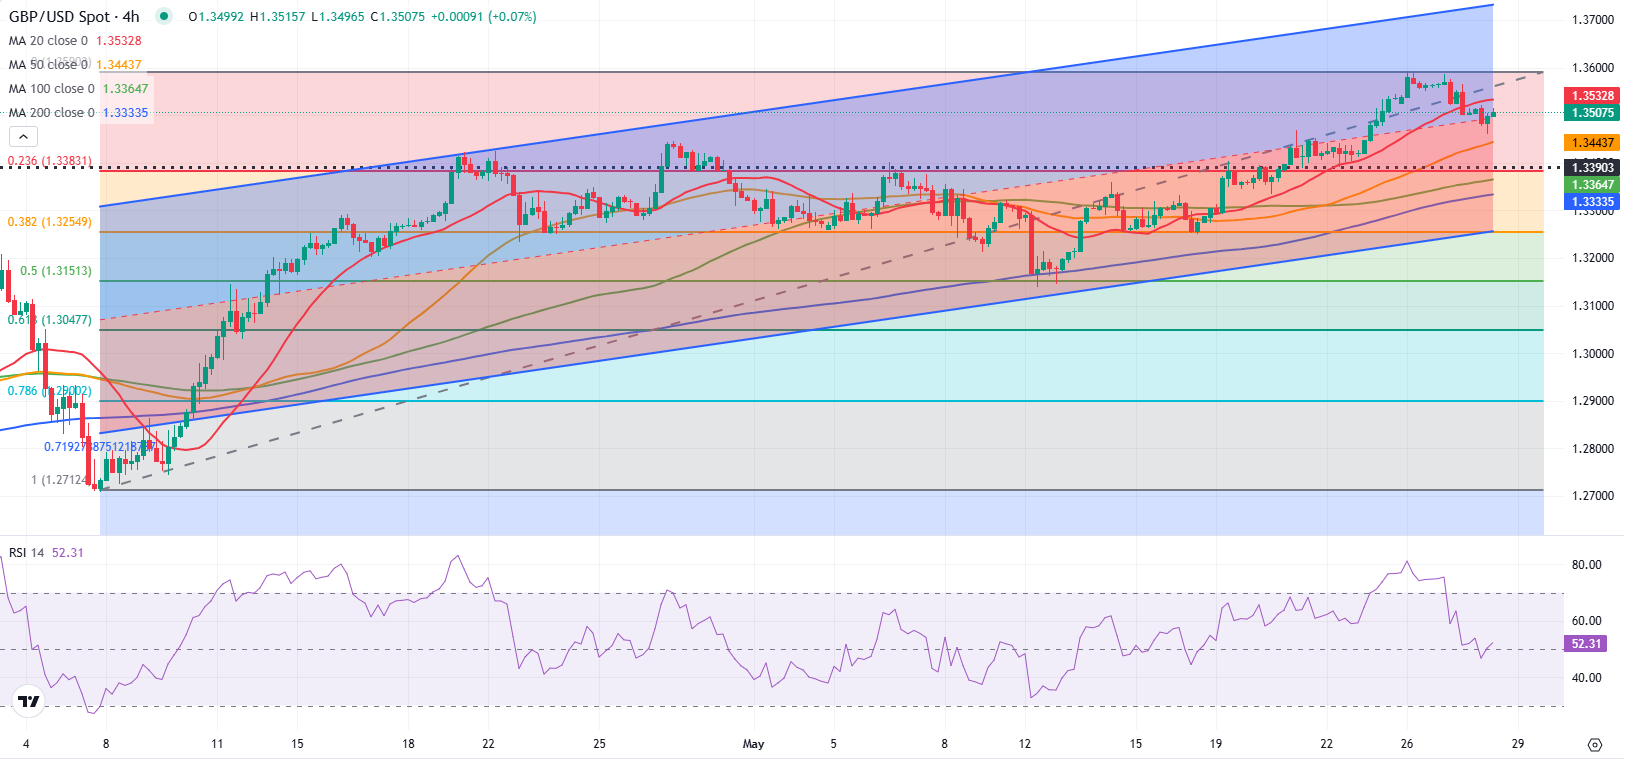
The Relative Strength Index (RSI) indicator on the 4-hour chart stays near 50, reflecting a loss of bullish momentum.
The mid-point of the ascending regression channel aligns as immediate support at 1.3500. In case GBP/USD drops below this level and starts using it as resistance, technical sellers could take action. In this scenario, 1.3440 (50-period Simple Moving Average (SMA), static level) could be seen as the next support level before 1.3360 (100-period SMA).
On the upside, resistance levels could be spotted at 1.3600 (static level), 1.3700 (static level, round level) and 1.3730 (upper limit of the ascending channel).
Pound Sterling FAQs
The Pound Sterling (GBP) is the oldest currency in the world (886 AD) and the official currency of the United Kingdom. It is the fourth most traded unit for foreign exchange (FX) in the world, accounting for 12% of all transactions, averaging $630 billion a day, according to 2022 data.
Its key trading pairs are GBP/USD, also known as ‘Cable’, which accounts for 11% of FX, GBP/JPY, or the ‘Dragon’ as it is known by traders (3%), and EUR/GBP (2%). The Pound Sterling is issued by the Bank of England (BoE).
The single most important factor influencing the value of the Pound Sterling is monetary policy decided by the Bank of England. The BoE bases its decisions on whether it has achieved its primary goal of “price stability” – a steady inflation rate of around 2%. Its primary tool for achieving this is the adjustment of interest rates.
When inflation is too high, the BoE will try to rein it in by raising interest rates, making it more expensive for people and businesses to access credit. This is generally positive for GBP, as higher interest rates make the UK a more attractive place for global investors to park their money.
When inflation falls too low it is a sign economic growth is slowing. In this scenario, the BoE will consider lowering interest rates to cheapen credit so businesses will borrow more to invest in growth-generating projects.
Data releases gauge the health of the economy and can impact the value of the Pound Sterling. Indicators such as GDP, Manufacturing and Services PMIs, and employment can all influence the direction of the GBP.
A strong economy is good for Sterling. Not only does it attract more foreign investment but it may encourage the BoE to put up interest rates, which will directly strengthen GBP. Otherwise, if economic data is weak, the Pound Sterling is likely to fall.
Another significant data release for the Pound Sterling is the Trade Balance. This indicator measures the difference between what a country earns from its exports and what it spends on imports over a given period.
If a country produces highly sought-after exports, its currency will benefit purely from the extra demand created from foreign buyers seeking to purchase these goods. Therefore, a positive net Trade Balance strengthens a currency and vice versa for a negative balance.


