US Dollar, EUR/USD, USD/JPY: Key Levels to Watch Ahead of Inflation-Focused Week

- The US dollar index stabilized around 103.8 in the latter part of February, supported by strong January inflation data and the market’s reluctance to anticipate interest rate cuts by the Federal Reserve.
- The EUR/USD opened the week on a positive note, strengthening to the 1.08 level and showing signs of recovery against the dollar, with key support at 1.081 and potential resistance at 1.0875.
- USD/JPY received support just below the 150 level, maintaining a positive outlook for the dollar as Japan’s CPI data and the possibility of BOJ rate adjustments create a mixed yet upward trajectory.
- In 2024, invest like the big funds from the comfort of your home with our AI-powered ProPicks stock selection tool. Learn more here>>
In the latter part of February, the lost momentum but found stability around 103.8 in the past week.
Simultaneously, the opened the week on a positive note, strengthening to the 1.08 level and showing signs of recovery against the dollar.
As for , it received support just below the 150 level last week, maintaining a positive outlook in favor of the dollar.
The primary driver behind the US dollar’s movements remains inflation data. Strong January data supported the Federal Reserve’s reluctance to cut interest rates.
With the market continually postponing expectations of interest rate cuts, this development is likely to sustain dollar strength.
If February’s CPI data aligns with January’s, we might witness a more hawkish stance from the Fed compared to other major central banks.
This factor remains pivotal in supporting demand for the dollar due to its attractive yield.
Key data releases in the US this week include the price index, closely monitored by the Fed.
In December, the index by 0.2%, and the expectation for January is a potential 0.4% increase.
Should core personal consumption expenditures exceed expectations, the Fed might move slightly away from its dovish approach, leading the dollar to resume its upward trajectory after a brief pullback.
Furthermore, speeches from nearly 10 Fed members this week could introduce increased market volatility.
US Dollar Index: Technical View
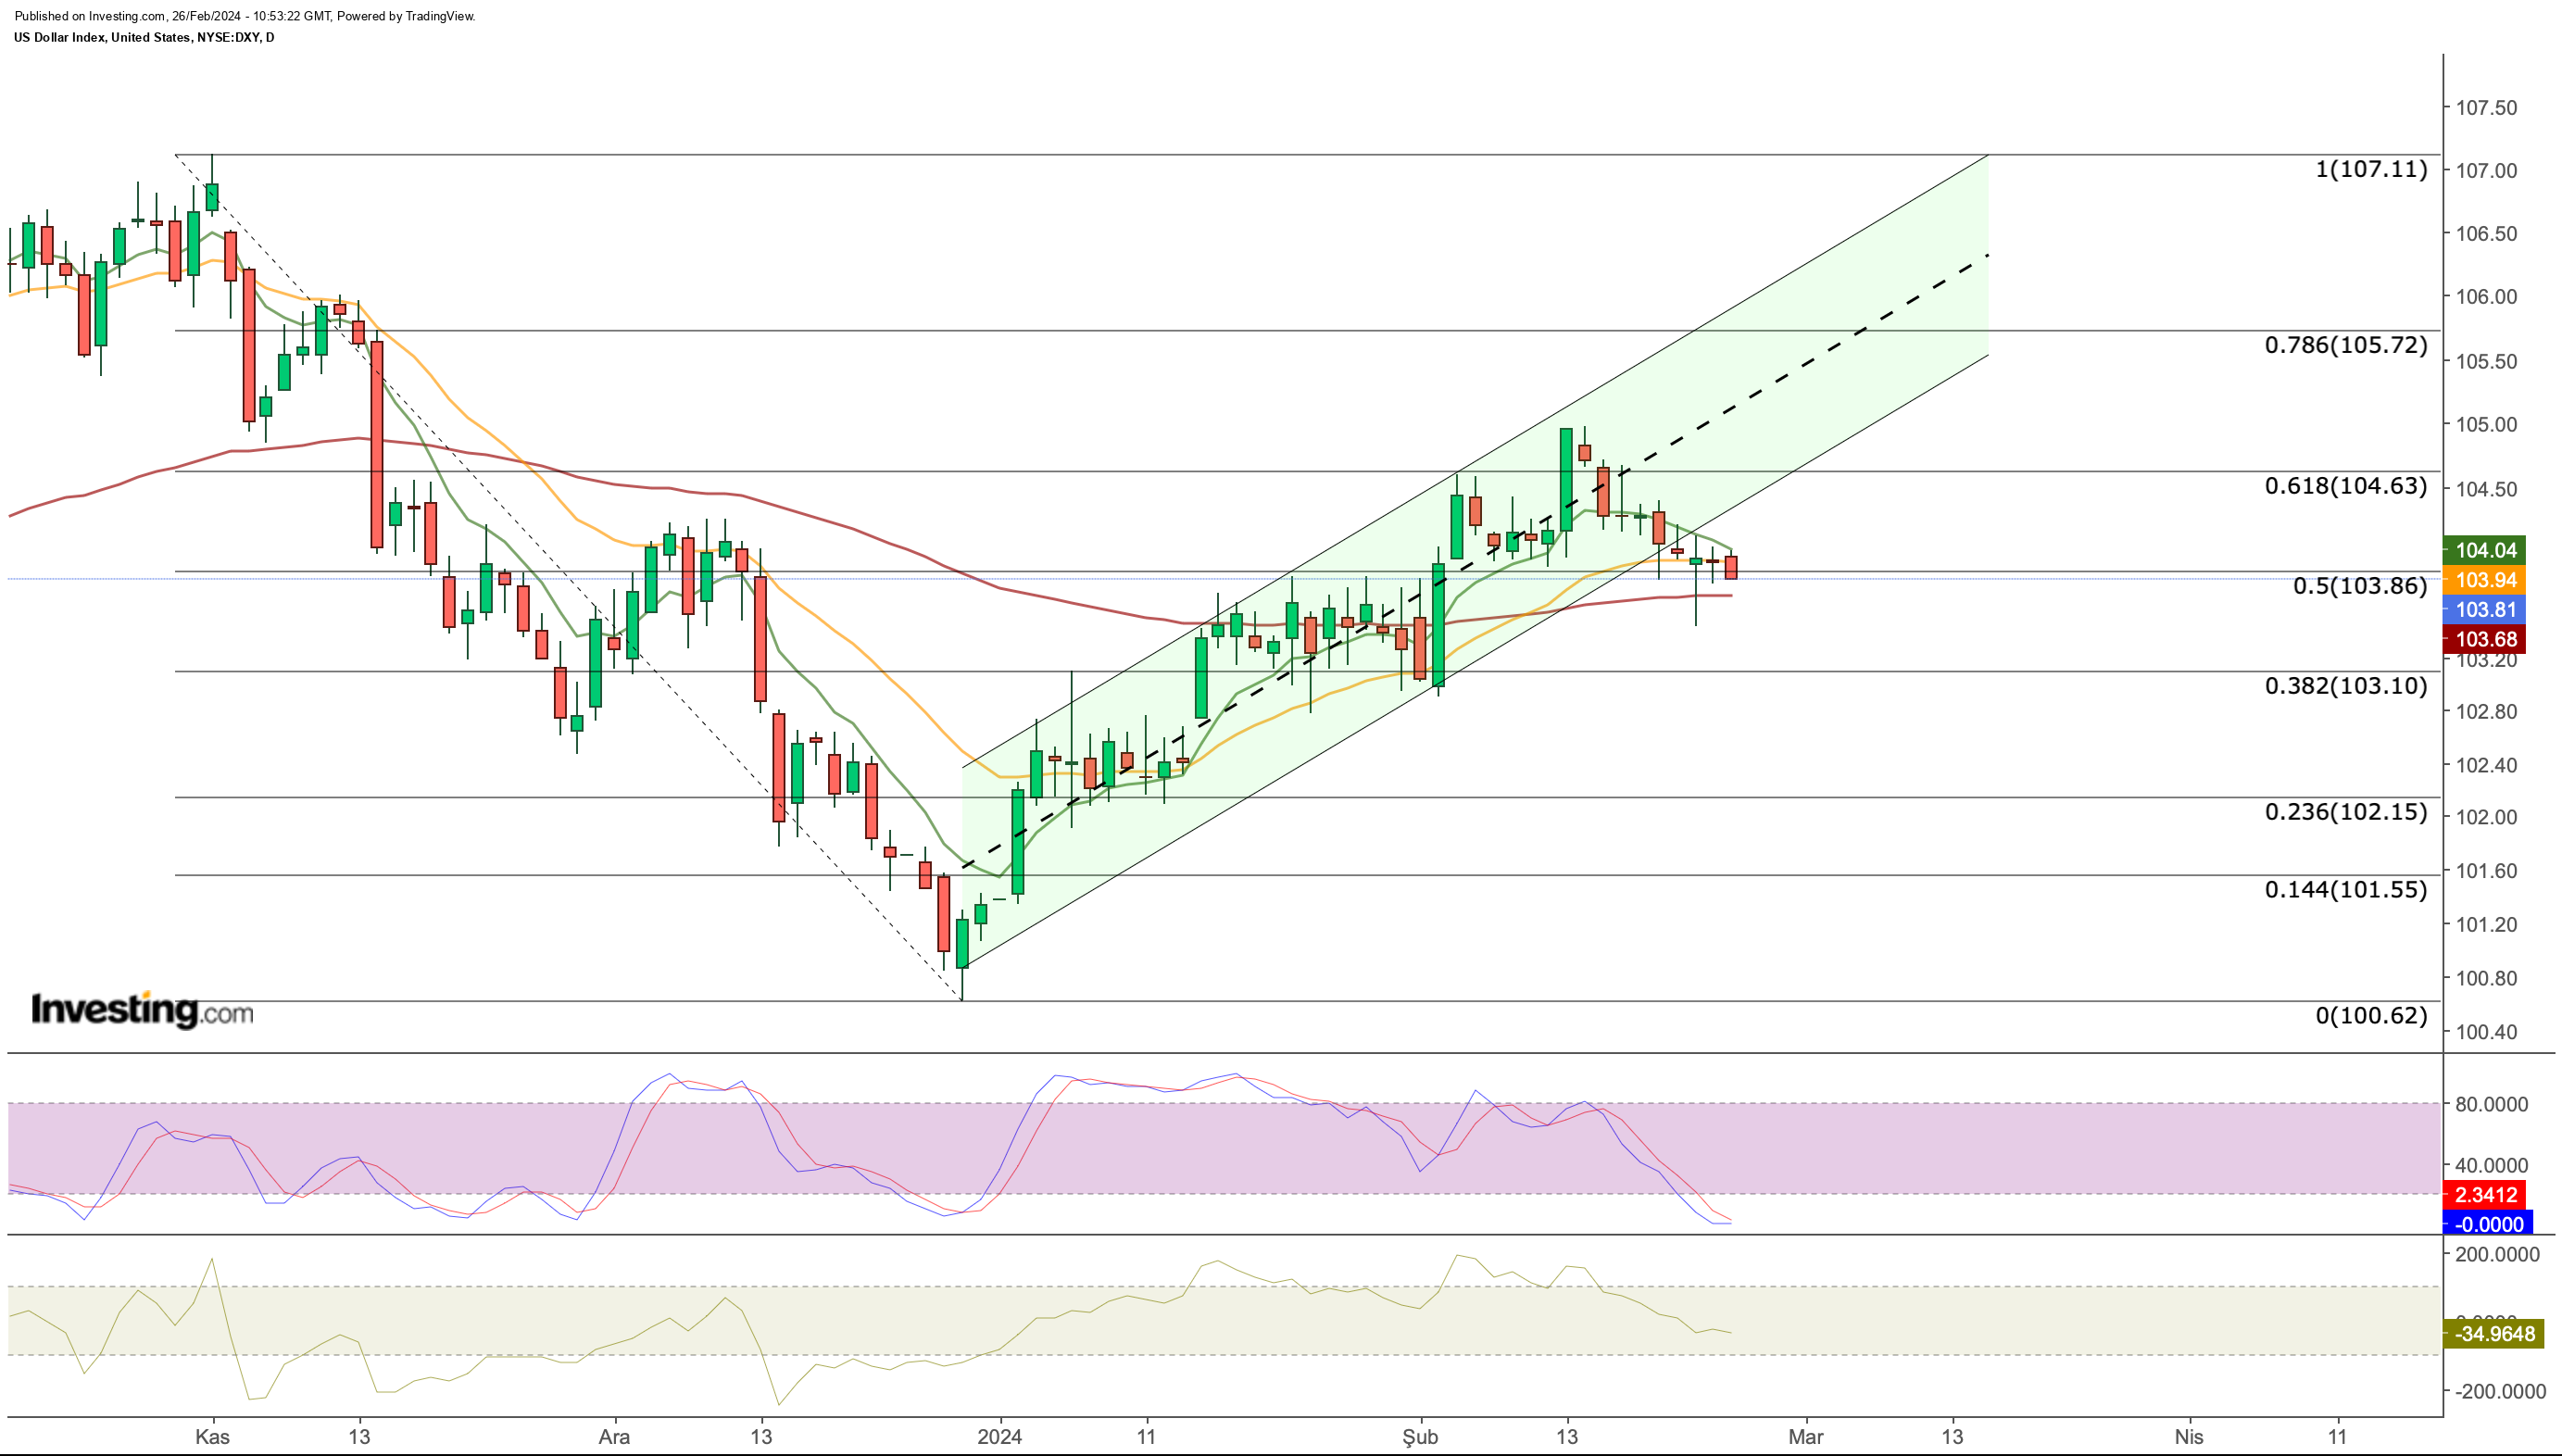
Looking at the from a technical perspective; DXY was seen slipping below the 104 level after being rejected near the 105 level in the middle of the month, partly towards the upper band of the ascending channel.

Although the recent momentum pushed the DXY out of the ascending channel, we see that the index is supported at the average level of 103.8, which worked as resistance in January, as the expectation that the dollar will remain strong continues.
Accordingly, while the markets hold their breath hoping for a clear message from the Fed, indecision is reflected in the DXY chart as a horizontal outlook.
If the core PCE comes in strong this week and the Fed members’ messages come in a hawkish tone, US dollar may retest the next resistance zone 104.6 by finding support at 103.8.
In a possible breakout, we may see an acceleration towards 105.7 in the short term.
Otherwise, it will be possible to see a decline to 103.1, the next support point for the index.
The 103 band will be followed as an important support line and the loss of this line may be a decisive move in terms of increasing demand for other major currencies and risk markets.
EUR/USD Technical View
This week, economic data will focus on inflation, with the release of core PCE in the US followed by Eurozone .

Although the CPI data will be a key indicator for the ECB’s , markets do not expect the bank to cut interest rates until June.
The inflation report to be released on Thursday in the major European countries of Germany, France, and Spain may also have an impact that may increase volatility in EUR/USD.
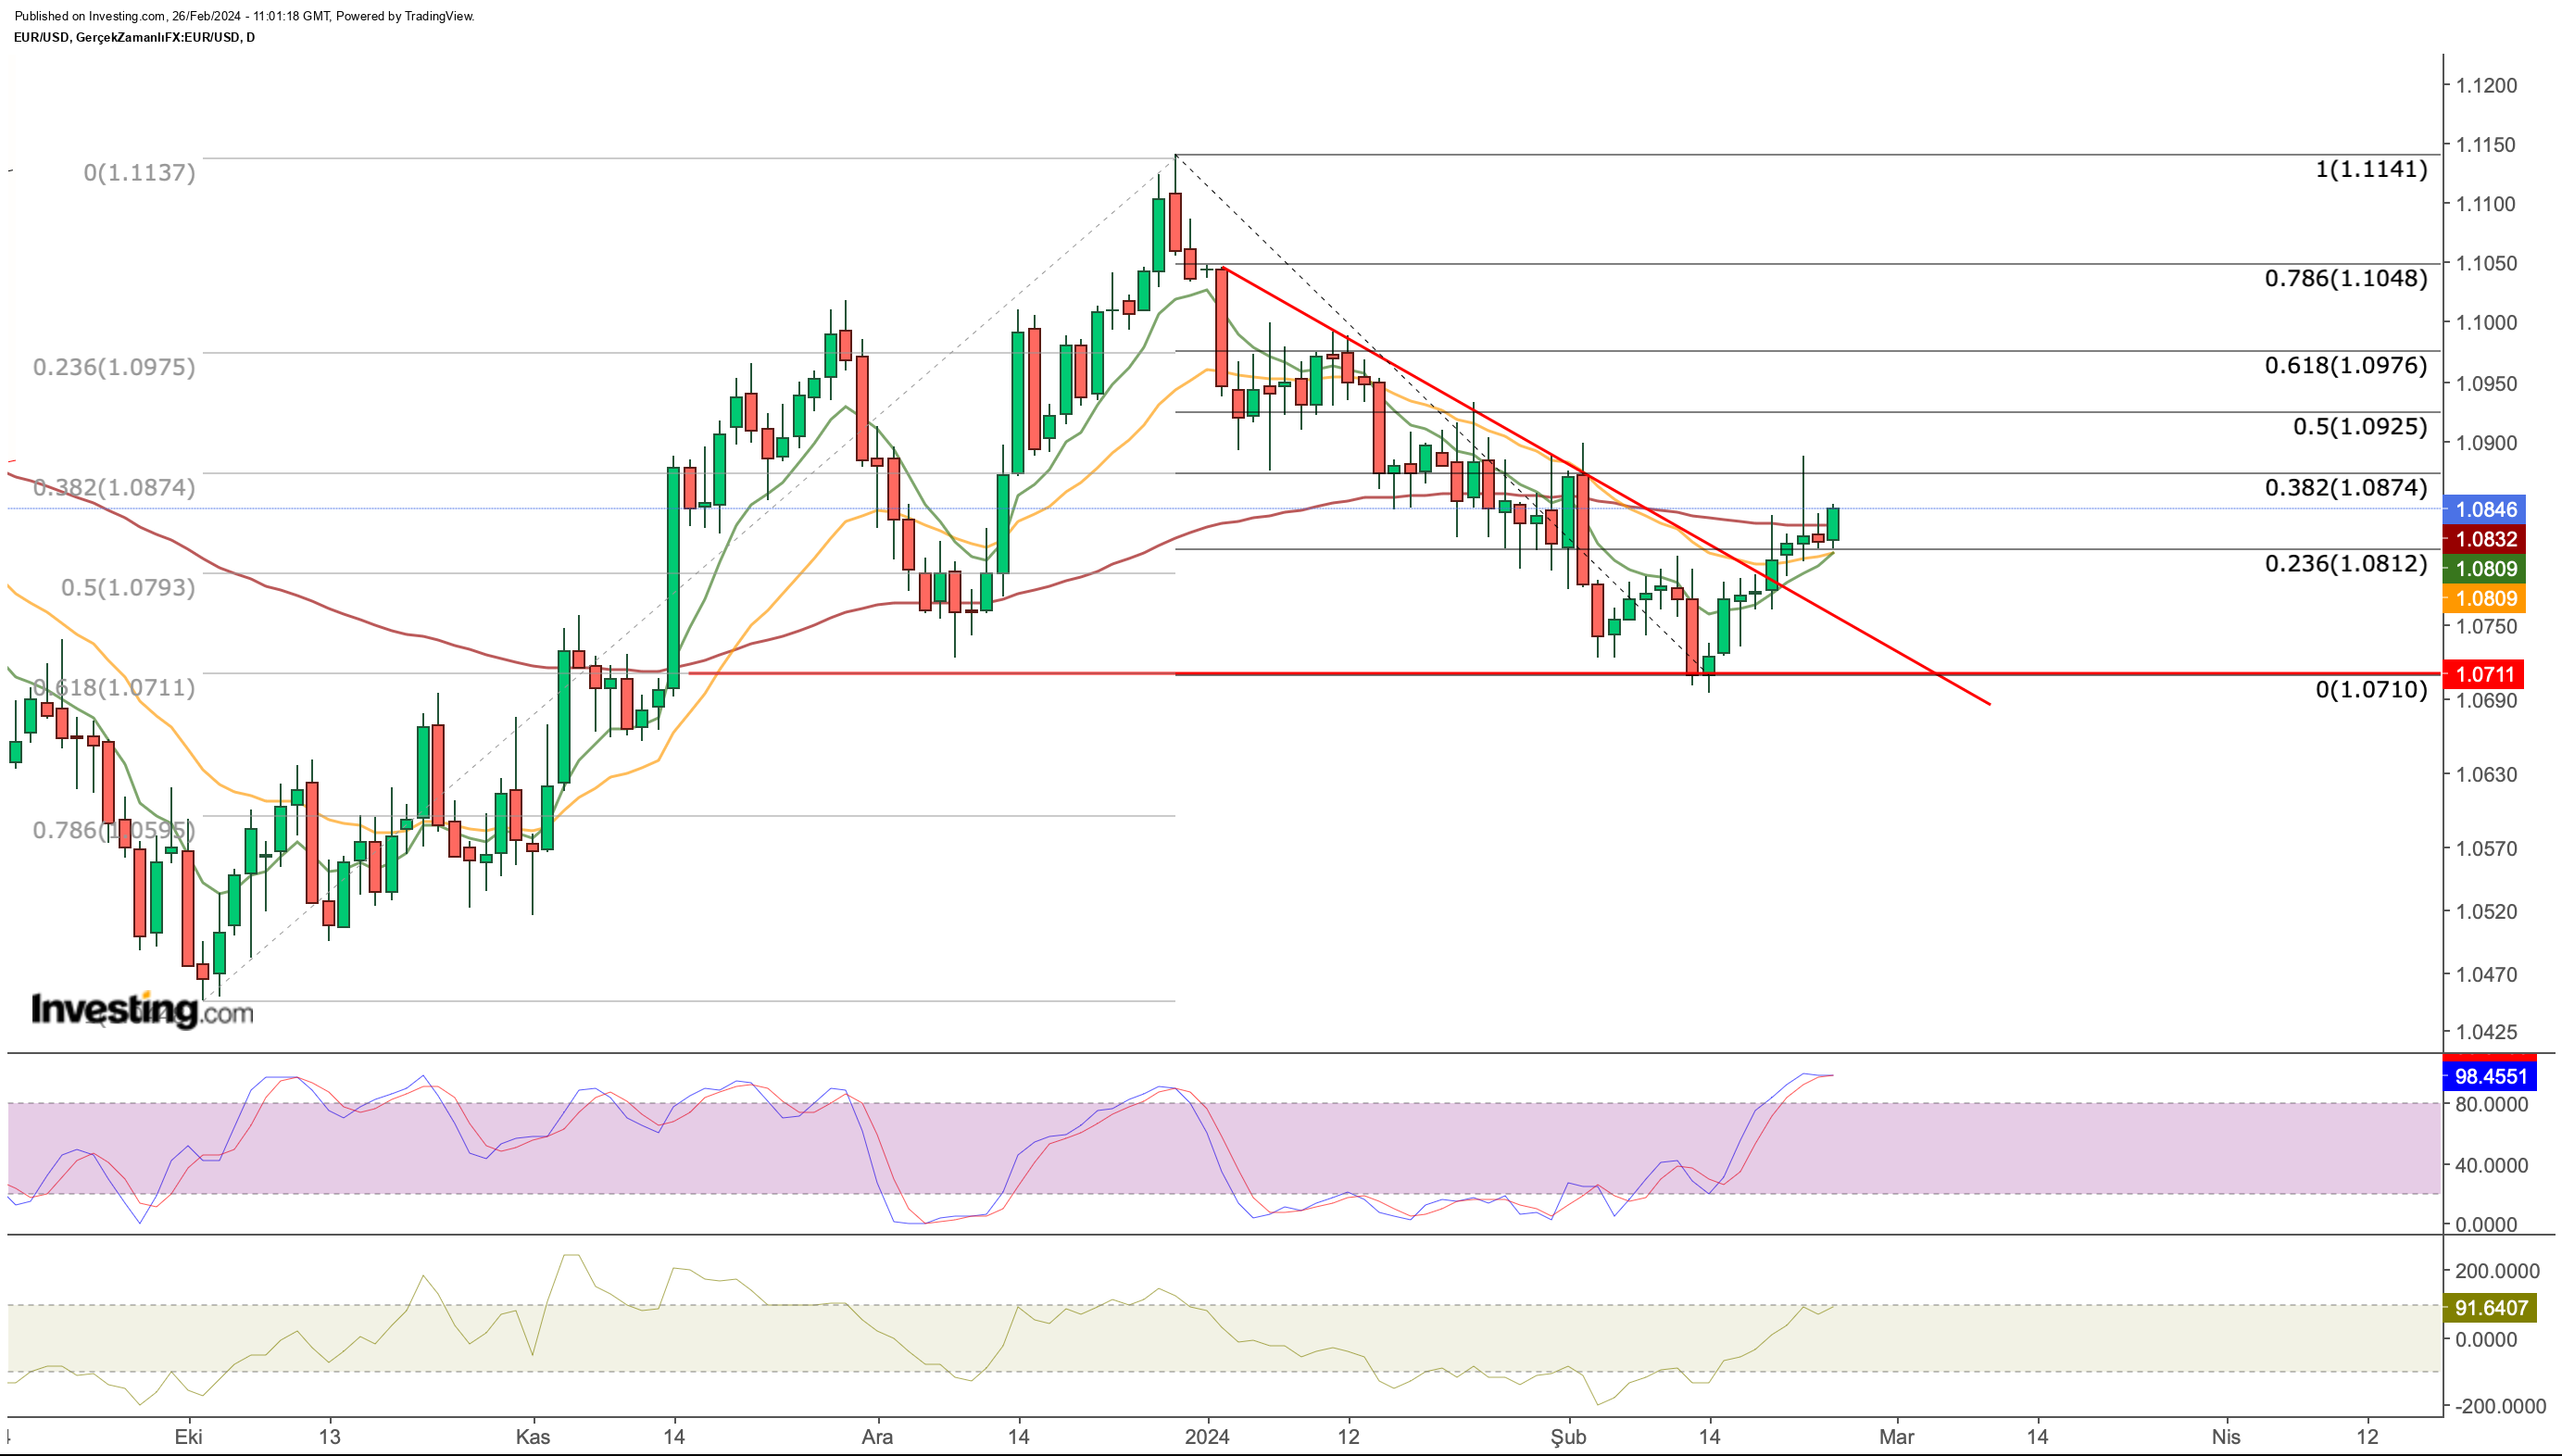
After starting 2024 with a decline, EUR/USD found support at the Fib 0.618 ideal correction level (1.07) according to the October – December period rise and turned its direction up again.
Last week, the pair stepped into the 1.08 region, breaking the short-term downtrend and confirming the recovery movement.
This week, the 1.081 level will be followed as the closest support for EUR/USD.
Pullbacks up to this level are possible and if the pair stays above 1.08, the most critical resistance stands at 1.0875.
At this point, if it is broken with daily closures, the momentum can continue up to the range of 1.0975 – 1.105.
The criterion that will support the upward momentum will be the inflation figures to be announced in the Eurozone.
USD/JPY Technical View
Japan’s data to be released on Tuesday is expected to show a decline in annual inflation, while core inflation is expected to remain below 2% on an annual basis.

This is seen as a factor that could disrupt Japan’s plans to end negative interest rates in the coming periods while keeping the yen under pressure against the dollar.
On the other hand, the market continues to price in the possibility that the BOJ may raise negative interest rates to zero in the coming months based on rising wages.
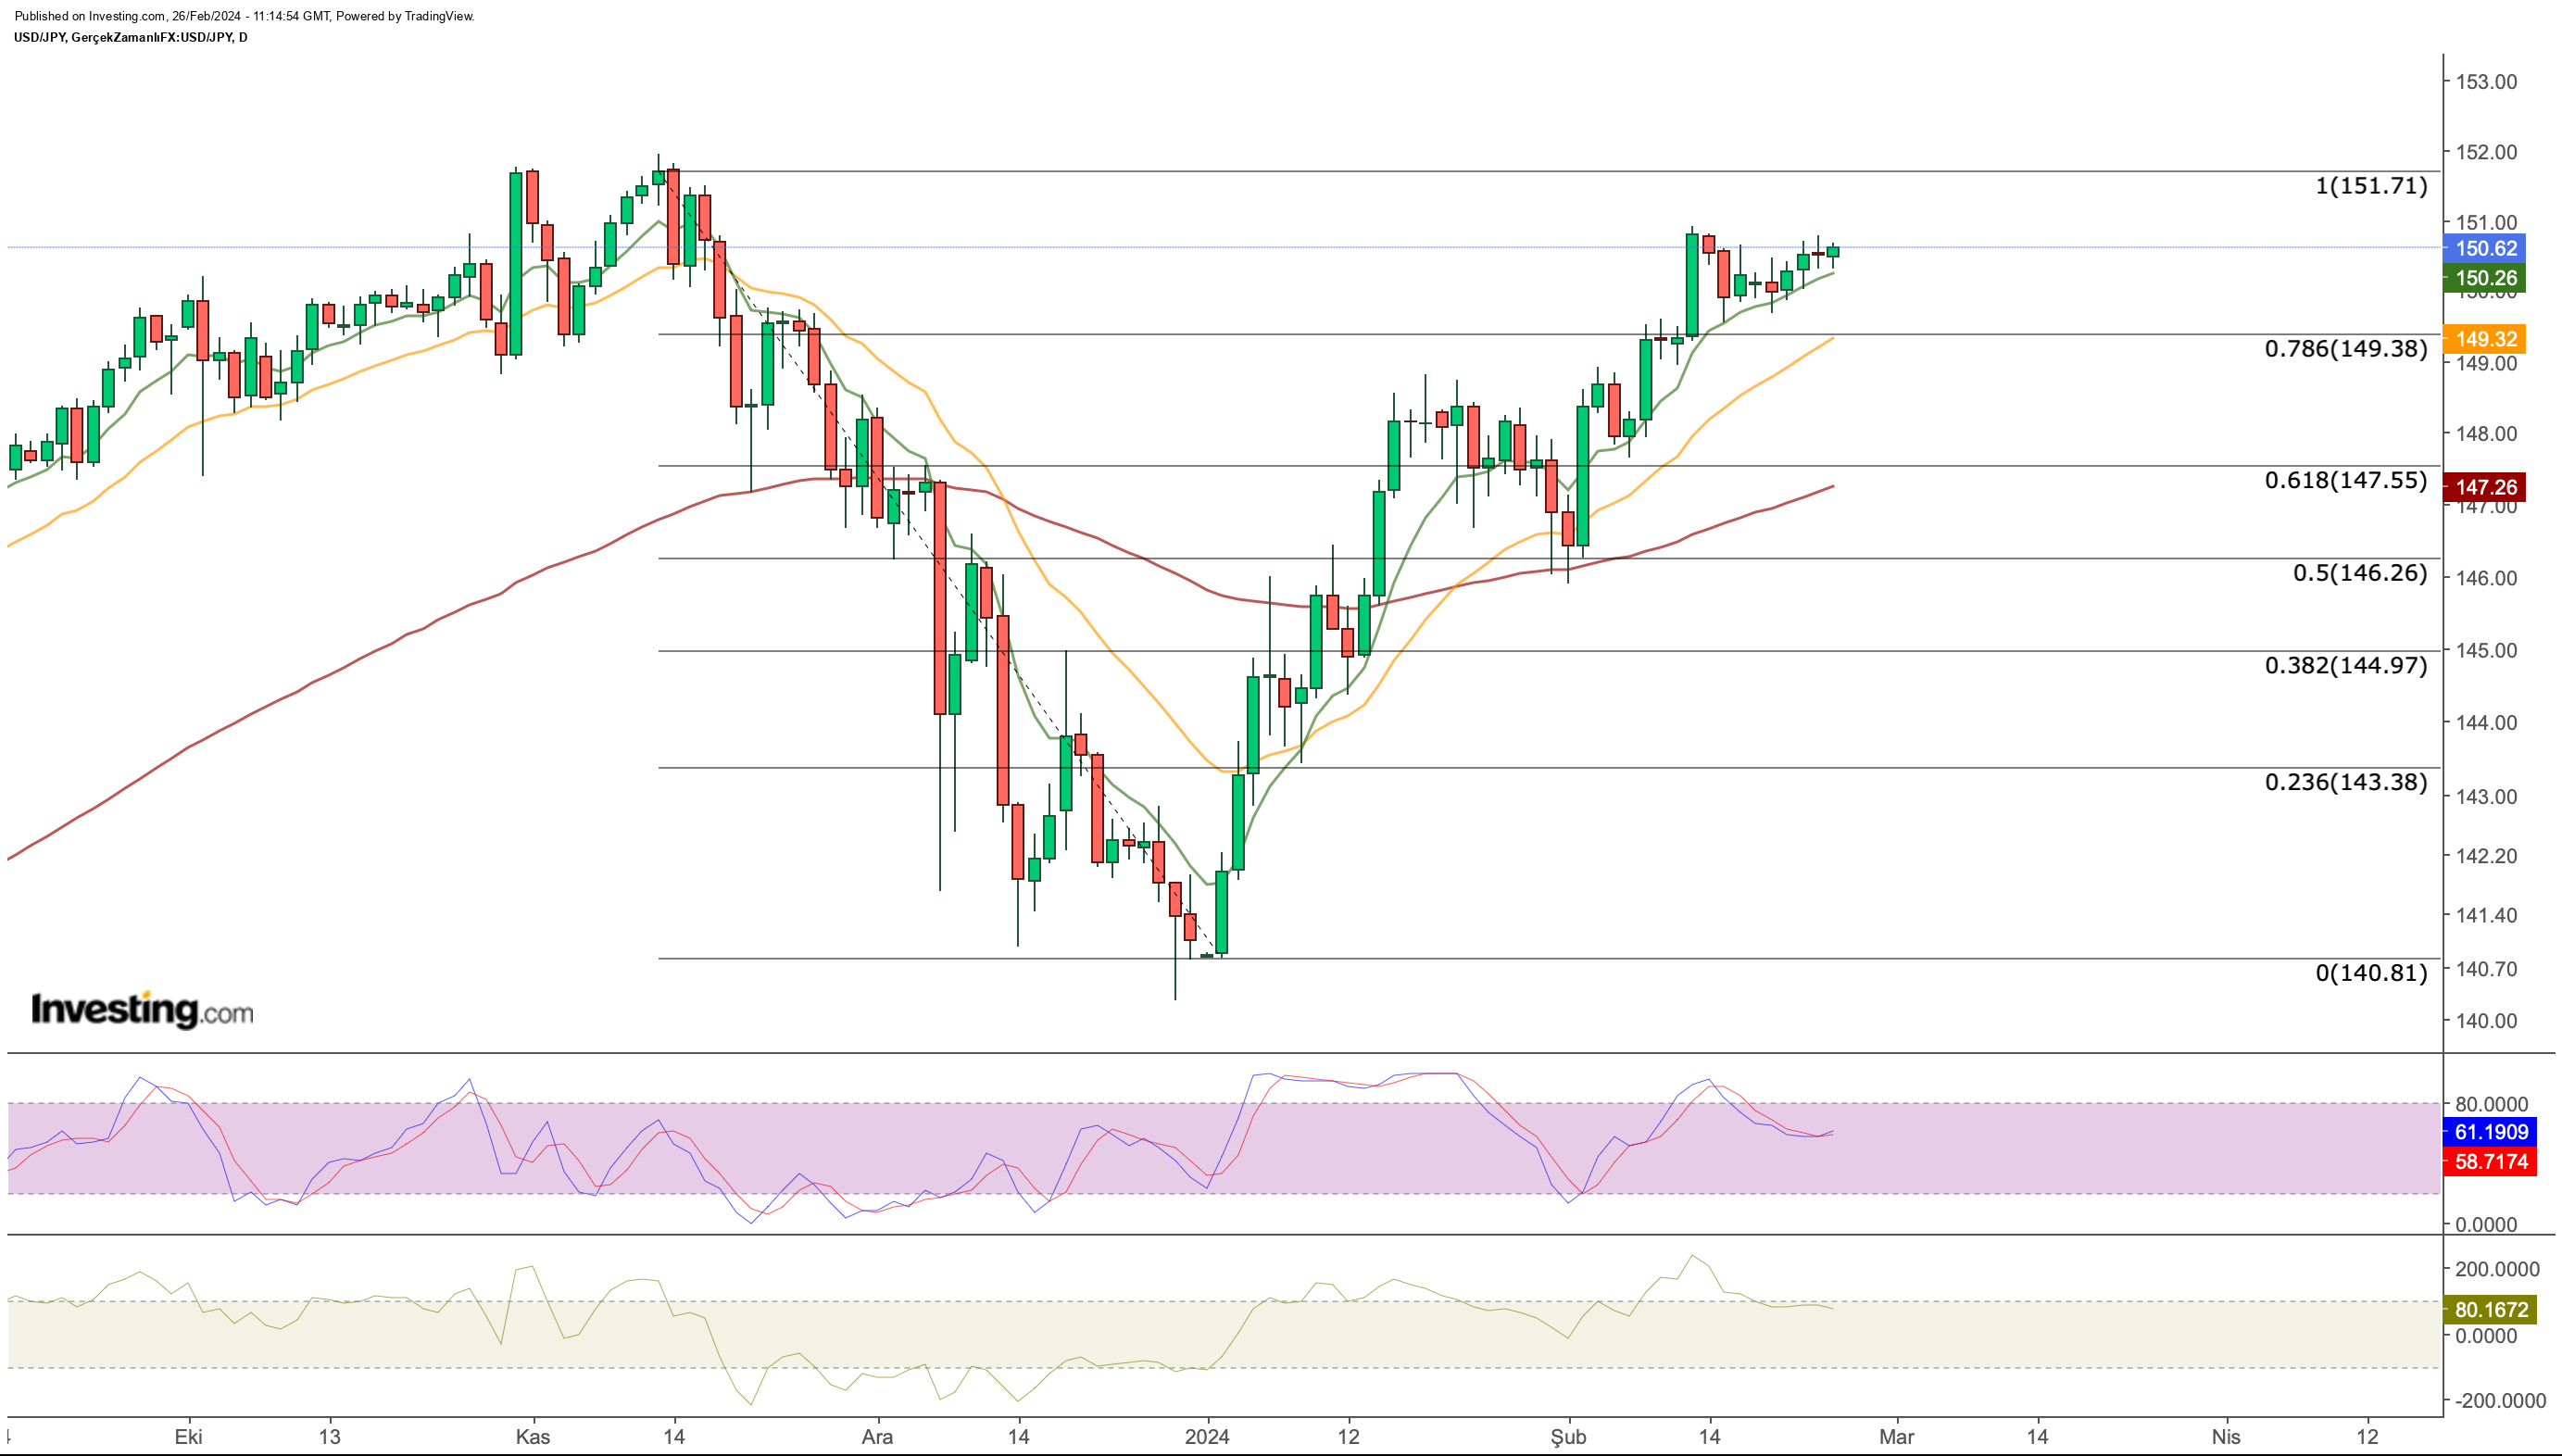
Within this mixed outlook, while the general direction of USD/JPY continued to be upward, the pair broke through the critical resistance at 149.3 this month and stepped into the 150 region.
USD/JPY has met an intermediate resistance at 150, which has been seen as a psychology level for the last two weeks.
According to the current outlook, it can be seen that this week the momentum may continue up to the last peak level of 151.
In the lower region, an intermediate support is at 150.2, while the 149.3 level will be closely monitored in a possible easing. However, the current outlook suggests that USD/JPY is more likely to rise than to correct.
***
Take your investing game to the next level in 2024 with ProPicks
Institutions and billionaire investors worldwide are already well ahead of the game when it comes to AI-powered investing, extensively using, customizing, and developing it to bulk up their returns and minimize losses.
Now, InvestingPro users can do just the same from the comfort of their own homes with our new flagship AI-powered stock-picking tool: ProPicks.
With our six strategies, including the flagship “Tech Titans,” which outperformed the market by a lofty 1,427.8% over the last decade, investors have the best selection of stocks in the market at the tip of their fingers every month.
Subscribe here and never miss a bull market again!

Subscribe Today!
Don’t forget your free gift! Use coupon code INVPROGA24 at checkout for a 10% discount on all InvestingPro plans.
Disclaimer: This article is written for informational purposes only; it does not constitute a solicitation, offer, advice, or recommendation to invest as such it is not intended to incentivize the purchase of assets in any way. I would like to remind you that any type of asset, is evaluated from multiple points of view and is highly risky and therefore, any investment decision and the associated risk remains with the investor.


