Key Takeaways
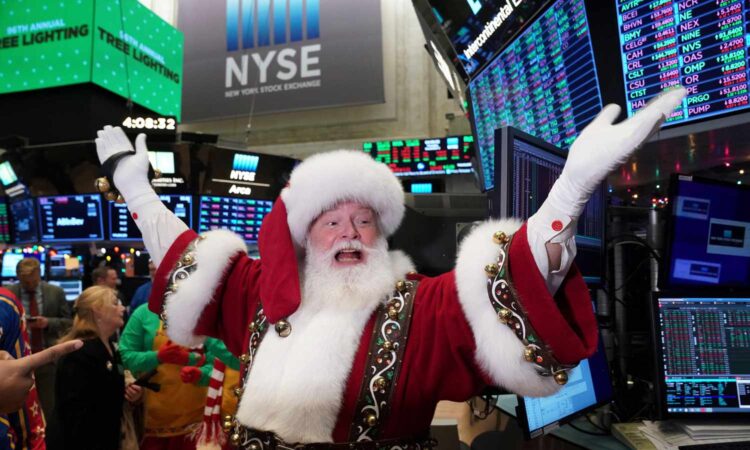
- Heading into the last few days of 2023, many investors will be hoping for a “Santa Claus rally,” which describes a sustained market increase around the Christmas holiday.
- Since 1945, the S&P 500 has posted a positive return in the period over the last five trading days of the year and the first two of the new year 77% of the time, CFRA Research found.
- Investor optimism around the winter holidays, the use of holiday bonuses to invest, lower trading volumes, end-of-year tax considerations, and holiday consumer spending boosting sales could all be possible explanations for why a Santa Claus rally might occur, according to J.P. Morgan.
- While historical data might support the idea of a Santa Claus rally, past performance isn’t necessarily a predictor of future returns.
After a strong November and start to December for U.S. equities, with the S&P 500 gaining over 10% since the end of October, many investors will be looking for a “Santa Claus rally,” or a sustained increase in the stock market around the Christmas holiday.
Yale Hirsch, who coined the term in 1972, held that a Santa Claus rally would occur over the period covering the last five trading days of the year and the first two trading days of the New Year. However, other interpretations of the time period covered by the term exist, such as yielding positive returns for the month of December.
Since 1945, the S&P 500 saw a Santa Claus rally that yielded positive performance in the final five trading days of the calendar year and the first two of the new year 77% of the time, CFRA Research found.
Investor optimism amid holiday festivities, the use of holiday bonuses to invest, lower trading volumes, end-of-year tax considerations, and holiday consumer spending boosting sales could all be possible explanations for why a Santa Claus rally might occur, according to J.P. Morgan.
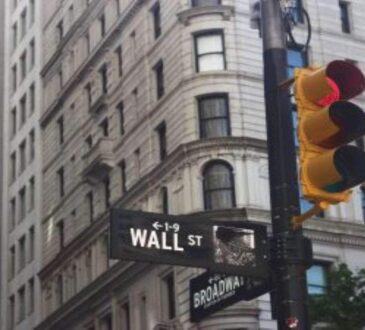
Many investors also believe that a Santa Claus rally, or lack thereof, could have implications for the year to come, as the saying goes, “if Santa Claus should fail to call, bears may come to Broad and Wall,” referring to the location of the New York Stock Exchange.
CFRA found that in the years when a Santa Claus rally occurred, the average full-year gain for the index in the year that followed was 9.8%. That compared to an average gain of 8.9% for all years since 1945. In the 23% of years when a Santa Claus rally did not happen, the S&P 500 recorded a below-average annual return of 4.7% for the year that followed.
While historical data might seem to support the idea of a Santa Claus rally and what it could signal for the year ahead, it’s worth noting past performance isn’t necessarily a predictor of future returns and not all years have followed this trend. In the last five trading days of 2015 and the first two of 2016, for example, the S&P 500 yielded negative returns, and recorded around a 12% gain for 2016. Despite an end-of-year rally from 2021 going into 2022, the S&P 500 also posted its worst total return for 2022 since the Great Recession.

