
The Stock Market Is Flashing a Warning Last Seen Decades Ago, and the Federal Reserve Just Made President Trump’s Tariffs Even Riskier. Here Is What History Says Could Happen Next.
The S&P 500 is hovering near all-time highs, but can the index sustain its rally in the new year?
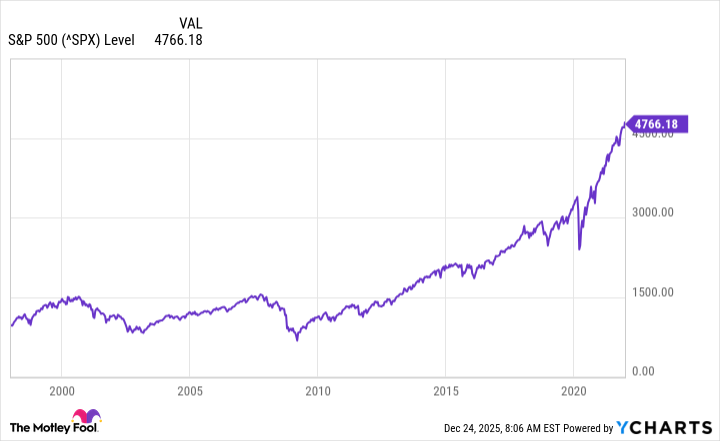
As of the closing bell on Dec. 23, the S&P 500 (^GSPC 0.35%) had gained 17% in 2025 — putting the index on pace for a third straight year of double-digit percentage gains.
Similar to the past two years, one of the biggest themes fueling the stock market throughout 2025 was artificial intelligence (AI). Although the technology, energy, and industrials sectors continue to push the market to new highs, there was another variable at play this year influencing the performance of the S&P 500: investor sentiment around President Donald Trump’s tariffs.
As 2026 draws closer, investors are surely wondering just how much longer the bull market can keep soaring. Below, I’ll break down some useful metrics that should help paint a picture of where the stock market could be headed next year. From there, we’ll dive into a recent report published by the Federal Reserve to assess the success of the new tariff agenda.

Image source: Federal Reserve.
The stock market is firing on all cylinders
The S&P 500 currently has a forward price-to-earnings (P/E) multiple of 21.8, according to FactSet Research. For context, this is about 10% higher than the index’s five-year average and about 18% above its 10-year average.
Before the AI revolution, the only other times in recent history the S&P 500 sported similar forward P/E levels were during the COVID-19 pandemic and the height of the dot-com bubble. Per the chart below, investors can see that in both of these instances, the index eventually declined sharply after reaching peak valuation levels.
To supplement the analysis above, let’s also take a look at the S&P 500 Shiller CAPE ratio. This figure accounts for corporate earnings over a 10-year period relative to current stock prices.
Right now, the CAPE ratio sits at 40.7. There is only one other time in history the CAPE ratio hovered near these levels — in 2000 at the peak of internet euphoria.
These dynamics raise the question: How sustainable is the S&P 500’s current rally?
The Federal Reserve just rained on Trump’s tariff parade
During the past several years, investors and economists dialed in on one specific metric: inflation. In 2022, inflation in the U.S. hit 9.1% — it’s highest level in more than 40 years.
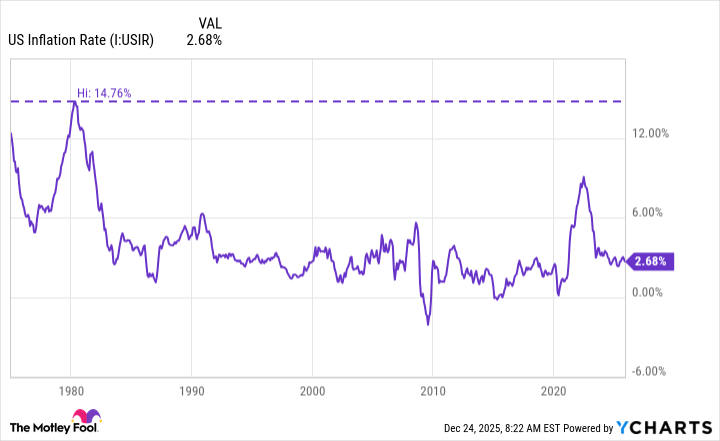
US Inflation Rate data by YCharts.
During his time on the campaign trail, then-candidate Trump used the inflation narrative to his advantage — claiming to have a solution to the frustrations of consumers. Specifically, Trump promised that if he returned to Washington, he would swiftly enact a new tariff agenda. Back in April, the president followed through on this promise and announced a series of sweeping tariffs on just about every country around the world — declaring “Liberation Day” for Americans.
Throughout 2025, inflation levels have indeed cooled off modestly. So, doesn’t this mean that Trump was right and his tariff agenda worked? Well, the reality is far more nuanced.
Back in November, the Federal Reserve bank of San Francisco published a detailed report around tariffs and their impact on the economy. The takeaways were fascinating.
Generally speaking, tariffs are considered inflationary because they raise the prices of imported goods — which businesses then pass onto consumers. However, there is another side to this equation. When prices rise, consumers begin to pull back spending. In turn, lower spending leads to slower economic growth, which subsequently puts downward pressure on inflation.
The casualty in this scenario is usually the labor market, not the consumer. As businesses face tighter margins due to higher cost of goods in combination with decelerating sales, they are forced to reduce headcount.
In essence, the Fed found that in the short term, tariffs can actually lead to lower inflation and higher unemployment. This is exactly what’s happening right now. Although the consumer has experienced disinflation (lower inflation) since Trump took office, the U.S. unemployment rate of 4.6% is the highest it’s been since 2021.
The long-run effects of tariffs are pretty straightforward. Naturally, businesses use times like these to reorganize supply chains, and eventually major players are able to regain their pricing power. Over time, inflation begins to gradually tick up. In short, tariffs can help level set the economy in the short run, but in the long run, higher costs become part of the economy’s price structure.
Will the stock market crash next year?
Given the details explored here, it would seem appropriate to say the stock market is overvalued — or at the very least, it’s become increasingly frothy. Moreover, history suggests that stocks should experience a correction in 2026.
Piggybacking off of that point, long-run data suggests that prices could begin to rise and accelerating inflation rates could be in store — imposing another burden on consumers and investors.

Today’s Change
(-0.35%) $-24.20
Current Price
$6905.74
Key Data Points
Day’s Range
$6888.76 – $6920.21
52wk Range
$4835.04 – $6945.77
Volume
1.9B
If you own individual stocks, it may be best to reduce exposure to more volatile or speculative positions, and hold onto durable businesses that have proven resilient during various economic cycles. In addition, I think now is a prudent time to start stockpiling cash. Should the market drop next year, having extra cash in your portfolio will allow you buy the dip in quality assets at a discount.
