* For commercial use only
Based on your interests
25% off until Sep 30th
- Free + Premium Statistics
- Reports
- Market Insights
Other statistics that may interest you Residential property market in London (UK)
Overview
6
Premium Statistic
Number of households in London, England 2008-2023, by tenure
Premium Statistic
Number of residential property sales per year in London, England 1995-2023
Premium Statistic
Number of residential real estate sales in London, England 2021-2023, by borough
Premium Statistic
Ratio of house prices to incomes in London, England 2022, by area
Basic Statistic
House price index in London, England 2015-2023, per month
Premium Statistic
Index of private housing rental prices in London, England 2015-2023, per month
Construction
7
House prices
8
Rental costs
4
Mortgages & stamp duty
4
Forecasts
6
Further related statistics
17
- Number of property ownership transactions in the UK Q2 2019-Q2 2022, by outcome
- Average price for used luxury residential properties in Milan, Italy H1 2018
- Number of transactions in residential real estate in Italy 2023, by property size
- Italy: transactions in residential real estate in the North-West 2018, by size
- Italy: transactions in residential real estate in the North-East 2018, by size
- Italy: transactions in residential real estate in the Centre 2018, by size
- Real estate agencies opinion on house rental prices in Italy Q4 2019, by macro-region
- Distribution of transactions in residential real estate in Italy 2023, by size
- Italy: transactions in residential real estate in the South 2018, by size
- Italy: transactions in residential real estate in the Islands 2018, by size
- Housing costs as a share of total income in leading German cities 2014
- Metros with highest share of failed home sales in the U.S. 2016
- Housing markets with the largest yoy change in house flips in U.S. 2018
- Distribution of transaction value residential real estate Italy 2019, by macro area
- U.S. city dwellers moving to rural areas 2020
- Market share of residential estate developers in Vietnam 2016-2019
- Homeownership expectations of adults in the United States in 2020, by ethnicity
* For commercial use only
Based on your interests
25% off until Sep 30th
- Free + Premium Statistics
- Reports
- Market Insights
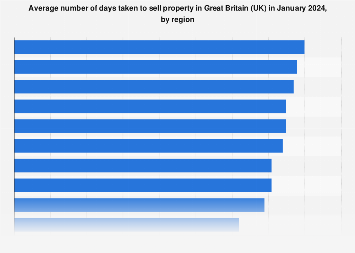
Rightmove. (January 17, 2024). Average number of days taken to sell property in Great Britain (UK) in January 2024, by region [Graph]. In Statista. Retrieved August 18, 2024, from https://www.statista.com/statistics/933944/average-number-of-days-taken-to-sell-property-in-great-britain-by-region/
Rightmove. “Average number of days taken to sell property in Great Britain (UK) in January 2024, by region.” Chart. January 17, 2024. Statista. Accessed August 18, 2024. https://www.statista.com/statistics/933944/average-number-of-days-taken-to-sell-property-in-great-britain-by-region/
Rightmove. (2024). Average number of days taken to sell property in Great Britain (UK) in January 2024, by region. Statista. Statista Inc.. Accessed: August 18, 2024. https://www.statista.com/statistics/933944/average-number-of-days-taken-to-sell-property-in-great-britain-by-region/
Rightmove. “Average Number of Days Taken to Sell Property in Great Britain (Uk) in January 2024, by Region.” Statista, Statista Inc., 17 Jan 2024, https://www.statista.com/statistics/933944/average-number-of-days-taken-to-sell-property-in-great-britain-by-region/
Rightmove, Average number of days taken to sell property in Great Britain (UK) in January 2024, by region Statista, https://www.statista.com/statistics/933944/average-number-of-days-taken-to-sell-property-in-great-britain-by-region/ (last visited August 18, 2024)
Average number of days taken to sell property in Great Britain (UK) in January 2024, by region [Graph], Rightmove, January 17, 2024. [Online]. Available: https://www.statista.com/statistics/933944/average-number-of-days-taken-to-sell-property-in-great-britain-by-region/

