UK house prices mapped: locations where values are rising and falling revealed – what’s happening in your area?

HOMEBUYERS are making the most of falling mortgage rates as market activity jumps higher than the same point last year.
Buyer demand is now 20% higher than last year due to falling demand last summer when there was a spike in mortgage rates, according to Zoopla.
The average five-year fixed mortgage rate today is 5.22%, compared with 6.2% last August.
It comes after the Bank of England (BoE) cut interest rates for the first time since 2020 at the beginning of August.
At the Monetary Policy Committee’s (MPC) meeting, ratesetters at the BoE reduced the base rate from 5.25% to 5%.
Buyer demand for homes is a fifth higher than this time last year, while new sales agreed are almost a quarter higher.
Overall, the average house price in May stood at £266,400, according to Zoopla.
This is an increase of 1.4% in the seven months to July 2024.
The improvement in house prices over the year to date is being felt across most areas of the country.
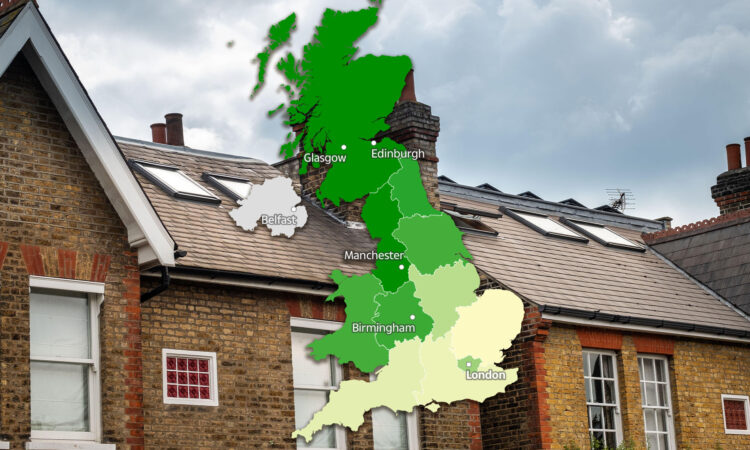
Annual house price inflation ranges from -0.9% in the Eastern region to +5.1% in Northern Ireland.
Price inflation stands at +0.2% in London, while prices have seen small falls in the South East, South West and East Midlands.
Plus, Zoopla has revealed areas of the country where house prices continue to show small falls on a quarterly and annual basis.
These include Taunton (-2.0%), Dartford (-1.3%), Enfield (-1.1%) and Harrogate ( -1%).
Zoopla said these falls highlight how house prices are still adjusting to the impact of higher borrowing costs in local areas.
There are also areas of the country where house prices are posting above-average annual gains.
These rises are often in more affordable housing markets and those in close proximity to larger cities.
Wolverhampton has seen a 3% increase in house prices, closely followed by Oldham (2.8%) and Wakefield (2.7%).
Try our interactive map below to find out the average house price in your region and the average annual increases.
Warning over asking price reductions
Experts at Zoopla have said it’s important that sellers remain realistic on pricing, particularly if they are serious about moving home.
This is because house sellers who end up needing to slash their asking price typically see their property taking more than twice as long to sell as homes with no price reduction.
It found that it takes about a month – 28 days – on average to agree a sale where there has been no asking price reduction.
But among sellers who have cut the price by 5% or more, the typical time to sell is 73 days.
Zoopla said about a fifth of homes on the market had the asking price reduced by 5% or more in August.
Richard Donnell, executive director at Zoopla, said: “Momentum in the sales market continues to build as mortgage rates drift lower and more and more sellers gain the confidence to list their home for sale.
“Buyers have much greater choice which will support sales numbers, but this will keep prices rises in check.
“Buyers have less purchasing power than two to three years ago and remain price sensitive meaning sellers can’t afford to get ahead of themselves on where to set the right price for their home.
“If you need to cut the asking price by 5% or more then your home will (typically) take twice as long to sell or may not sell at all.”Show less
Different types of mortgages

We break down all you need to know about mortgages and what categories they fall into.
A fixed rate mortgage provides an interest rate that remains the same for an agreed period such as two, five or even 10 years.
Your monthly repayments would remain the same for the whole deal period.
There are a few different types of variable mortgages and, as the name suggests, the rates can change.
A tracker mortgage sets your rate a certain percentage above or below an external benchmark.
This is usually the Bank of England base rate or a bank may have its figure.
If the base rate rises, so will your mortgage but if it drops then your monthly repayments will be reduced.
A standard variable rate (SVR) is a default rate offered by banks. You usually revert to this at the end of a fixed deal term, unless you get a new one.
SVRs are generally higher than other types of mortgage, so if you’re on one then you’re likely to be paying more than you need to.
Variable rate mortgages often don’t have exit fees while a fixed rate could do.
Who tracks house prices?
There are several different house price trackers, all of which measure something slightly different.
The official measure comes from the Office for National Statistics (ONS), which examines the prices homes have actually sold for after they are registered on the Land Register.
The organisation’s latest figures showed that the average price tag for a home increased by 2.7% in the 12 months to June.
This was unchanged from May, the Office for National Statistics (ONS) said.
This is the most accurate of all the indices, but the figures come out three months after the homes are sold, so there’s a big time lag.
Some lenders and property websites also publish monthly indexes, tracking the average prices of homes on which they provide mortgages.
Nationwide said the the average house price nudged up 0.3% in July.
Across the UK, it said the average house price in July was £266,334.
Halifax, the UK’s biggest lender, said house prices rose by 0.8% in July.
That means the average property is now £2,200 more expensive than the previous month, and now stands at £291,268.
Do you have a money problem that needs sorting? Get in touch by emailing money-sm@news.co.uk.
Plus, you can join our Sun Money Chats and Tips Facebook group to share your tips and stories


