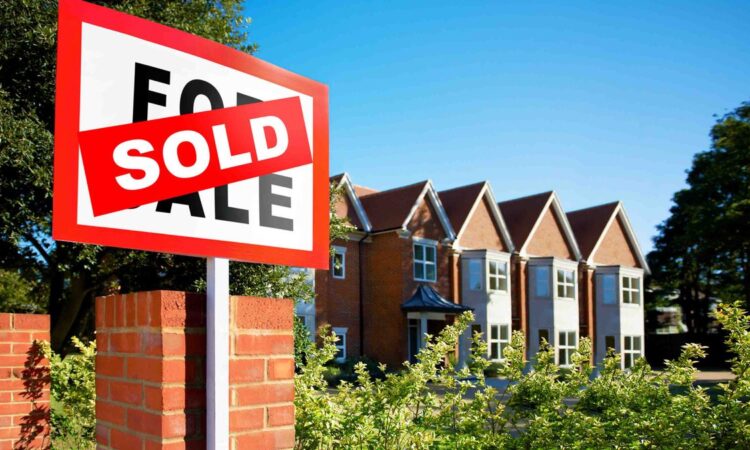
Homebuyers are voting with their feet, flocking to housing markets with more affordable, larger housing stock. In its new “Hottest Zip Codes of 2023” report, Realtor.com has identified the most popular cities, bustling with eager homebuyers undeterred by punishing mortgage rates and dwindling supply.
Why some housing markets are still sizzling
Realtor.com’s report reveals that demand is down in formerly buzzing markets, particularly in the Pacific and Southwest. Skyrocketing home prices that haven’t recovered to pre-pandemic levels, on top of mortgage rates that recently crossed 7.23%, mean many prospective homebuyers simply can’t keep up. Another aggravating effect of higher loan rates is the “locking in” of homeowners worried about affording a more expensive mortgage after selling their current home. This dynamic further decreases available housing market inventory.
Still, Realtor.com’s data reveals two types of buyers driving demand in the 10 hottest markets. Demand has crept up in certain zip codes within higher-priced major metros, suggesting higher-earning buyers are persistently seeking a better quality of life as opposed to cheap housing. Meanwhile, more affordable markets with larger housing stock in the Midwest and pockets of the Northeast have gained popularity among ostensibly more middle-income buyers.
Sign up for Kiplinger’s Free E-Newsletters
Profit and prosper with the best of expert advice on investing, taxes, retirement, personal finance and more – straight to your e-mail.
Profit and prosper with the best of expert advice – straight to your e-mail.
The top zip codes in Realtor.com’s rankings saw 7.2% average price growth year-over-year in the first half of 2023, nearly 75% more than the 4.2% U.S. average price growth. These housing markets accumulated up to 5.7 times more views per property than the typical U.S. market. Homes in these markets spend as many as 40 fewer days on the market compared to the nationwide average.
Top 10 home buying zip codes
The Hottest Zip Code rankings incorporate: 1) market demand, based on unique viewers per property on Realtor.com, and 2) total days a listing remains active on Realtor.com. The top 10 areas combine many unique viewers per property listing with fast-selling homes.
Six of the ten hottest zip codes are located in the Northeast, with the Midwest occupying four slots. Southern and Western regions don’t crack the top ten for aforementioned cost reasons.
Most of the hottest zip codes below share certain elements of value, but the main unifying factor is that they generally offer homes with more space. Overall, the typical home in 7 out of 10 of the most popular zips was larger than the surrounding metro’s average. Likewise, households in ZIP 07450 (Ridgewood, NJ), ZIP 01810 (Andover, MA), and ZIP 14534 (Pittsford, NY) are as much as 19.7% larger than the U.S. average of 2.5 people.
| Rank | Zip Code | City (Metro Area) | Median Days on Market | Viewers per Property vs US Avg |
|---|---|---|---|---|
| 1 | 43230 | Gahanna, OH (Columbus, OH) | 13 | 4.5 |
| 2 | 06489 | Southington, CT (Hartford, CT) | 18 | 5.7 |
| 3 | 07450 | Ridgewood, NJ (New York, NY) | 18 | 3.3 |
| 4 | 01810 | Andover, MA (Boston, MA) | 19 | 3.3 |
| 5 | 18064 | Nazareth, PA (Allentown, PA) | 18 | 3.4 |
| 6 | 46322 | Highland, IN (Chicago, IL) | 19 | 2.9 |
| 7 | 48183 | Trenton, MI (Detroit, MI) | 20 | 3.1 |
| 8 | 06851 | Norwalk, CT (Norwalk, CT) | 23 | 2.9 |
| 9 | 14534 | Pittsford, NY (Rochester, NY) | 21 | 3.5 |
| 10 | 63021 | Ballwin, MO (St. Louis, MO) | 23 | 3.1 |
Find your best mortgage option
Believe it or not, mortgage rates can always go higher. Just a few days ago, Federal Reserve Chairman Jerome Powell said the Federal Open Market Committee (FOMC) “is prepared to raise [interest] rates further if appropriate.” So we could see mortgage rates march even higher than the current 7.23% mark.
It’s difficult even for Kiplinger’s skilled economists to predict whether the economy will cool enough for the Federal Reserve to cut interest rates in the near future. Furthermore, mortgage rates never dipped below 7% for the entire 1980s and most of the 1990s, even reaching 18% at one point.
So use our tool to find the best mortgage option from multiple lenders. Now might really be the best time to get pre-approved.
