If you are interested in the history of the US housing market, you might want to know how the average and median prices of houses have changed over time. In this blog post, we will use data from various sources to show you the trends and patterns of house prices in the US from 1953 to 2023.
Defining Terms
The average price of houses sold is the total value of all houses sold divided by the number of houses sold in a given period. The median price of houses sold is the middle point of the distribution of house prices, such that half of the houses are sold for more and half for less than that price. The average price can be influenced by outliers, such as very expensive or very cheap houses, while the median price is more representative of the typical house price.
Average Housing Prices by Year
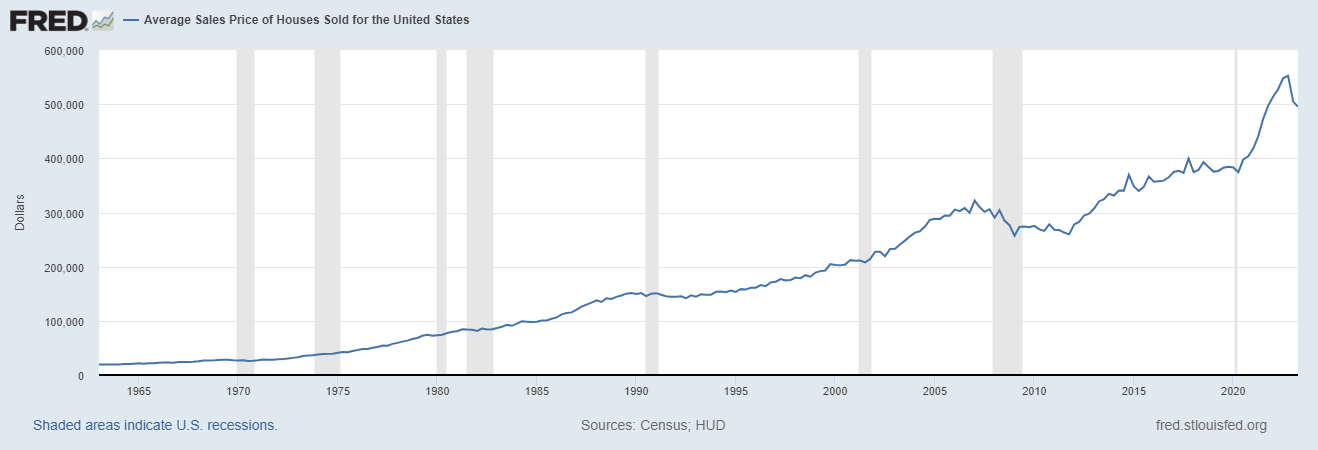
According to data from FRED, a database maintained by the Federal Reserve Bank of St. Louis, the average price of houses sold in the US in the second quarter of 2023 was $495,100, down from $505,300 in the first quarter and $552,600 in the fourth quarter of 2022. The average price peaked at $552,600 in the fourth quarter of 2022, which was the highest level since the series began in 1963. The lowest average price was $17,200 in the first quarter of 1963.
Median Housing Prices by Year
The median price of houses sold in the US in the second quarter of 2023 was $390,500, down from $399,900 in the first quarter and $417,800 in the fourth quarter of 2022. The median price also peaked at $417,800 in the fourth quarter of 2022, which was also the highest level since the series began in 1963. The lowest median price was $17,500 in the first quarter of 1963.
Historical Trends
The chart below shows the historical trends of both the average and median prices of houses sold in the US from 1963 to 2023.


As you can see, both prices have increased significantly over time, but with some fluctuations along the way. The most notable periods of rapid growth were from 1975 to 1980, from 1997 to 2006, and from 2012 to 2022. The most notable periods of decline were from 1980 to 1982, from 2006 to 2012, and from 2022 to 2023.
Factors Affecting Housing Prices
- Supply and demand: When there are more buyers than sellers, or more demand than supply, house prices tend to rise. When there are more sellers than buyers, or more supply than demand, house prices tend to fall.
- Income and population growth: When people have more income or when there are more people looking for housing, house prices tend to rise. When people have less income or when there are fewer people looking for housing, house prices tend to fall.
- Inflation and interest rates: When inflation is high or when interest rates are high, house prices tend to fall. When inflation is low or when interest rates are low, house prices tend to rise.
- Consumer confidence and expectations: When people are optimistic about the economy or when they expect house prices to rise in the future, they are more likely to buy houses. When people are pessimistic about the economy or when they expect house prices to fall in the future, they are less likely to buy houses.
- Government policies and regulations: When the government provides subsidies or incentives for home buyers or home builders, house prices tend to rise. When the government imposes taxes or restrictions on home buyers or home builders, house prices tend to fall.
- Regional variations: House prices can vary widely across different regions or markets depending on local factors such as climate, geography, amenities, infrastructure, culture, and preferences.
Historical Median Prices of Existing Homes
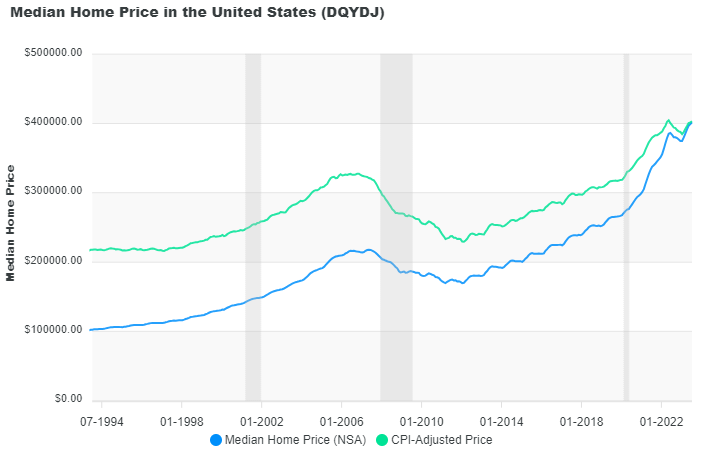
If we go back further in time, we can find data on the median price of existing homes (not new homes) from another source: DQYDJ, a website that provides financial calculators and tools. According to DQYDJ, the median price of existing homes in the US in September 2021 was $363,300 (in nominal terms) or $363,300 (in inflation-adjusted terms). The data goes back to January 1953, when the median price was $18,080 (in nominal terms) or $207,781 (in inflation-adjusted terms).
Historical Trends of Median Prices of Existing Homes
The chart below shows the historical trends of both the nominal and inflation-adjusted median prices of existing homes in the US from 1953 to 2021.


As you can see, both prices have also increased significantly over time, but with some differences from the new home prices. The nominal price has increased by almost 20 times since 1953, while the inflation-adjusted price has increased by about 1.7 times. The inflation-adjusted price shows that real home values have not increased as much as nominal home values over time. The nominal price also shows more volatility than the inflation-adjusted price, especially during periods of high inflation or deflation.
To summarize, this blog post has shown you how the average and median prices of houses sold and existing homes have changed over time in the US from 1953 to 2023. You have seen that both prices have increased significantly over time but with some fluctuations and differences along the way. You have also learned some of the main factors that influence house prices in the US. We hope you have found this information useful and interesting. Thank you for reading!

