
Integrated flood risk assessment of properties and associated population at county scale for Nebraska, USA
Hazard index
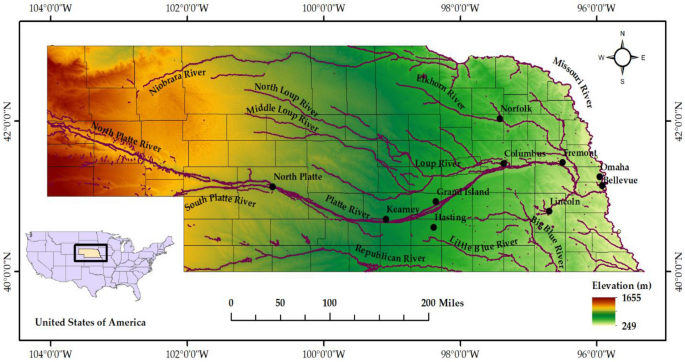
Northern and western parts of Nebraska experience flooding due to heavy rainfall, rapid snowmelt, ice jams, and river overflow. This region is home to many rivers, such as the Platte River, Missouri River, Niobrara River, and Elkhorn River (Fig. 1). The Niobrara River, a tributary of the Missouri River, runs through the Sandhill’s region of Nebraska and eventually joins the Missouri River at Niobrara, Nebraska. Further, the Elkhorn River, the tributary of the Platte River, runs through Antelope County and joins the Platte River near Gretna, Nebraska (part of Sarpy County). Additionally, the region’s topography of rolling hills and steep terrain also significantly exacerbates flash flooding in the region12.
Several counties, including Burt, Boyd, and Cass in the eastern region of Nebraska, showed a higher hazard of riverine flooding (Fig. 5). This can be attributed to the Missouri River, the Platte River, the Elkhorn River, and the Big Blue River, which runs through the eastern counties. Douglas County showed less hazard of property damage since there were fewer properties at hazard relative to the total number of properties, even though it had more properties overall. In the southern region of Nebraska, counties on the eastern front showed a higher flood hazard associated with properties. The higher hazard of property flooding is attributed to the presence of the Republican River, the Big Blue River, and the Platte River, which overflow their banks during periods of heavy precipitation or rapid snowmelt. Flooding in this region is also attributed to existing topography and human activities. Also similar to the northern region, the presence of rolling hills and flat plains, as most of Nebraska’s topography has, increases the chance of flash flooding along with infrastructure development in flood-prone areas. This has significantly altered the natural drainage pattern and increased the likelihood of flooding. Figures 5, 6, 7, 8, 9 were generated using the R-Studio software54.

Hazard map was prepared considering properties with flood factors of 8, 9, and 10 at the county scale.
Exposure index
Northern and Western Nebraska had lower population density, which reduced the overall exposure index of the region (Fig. 6). The majority of the population resides in the urban centers of the state, which are mostly located in the eastern part of the state. Douglas and Lancaster counties had the highest population density exposure. Douglas County has the highest population due to the presence of Omaha, the largest city in Nebraska. Lincoln, situated in Lancaster County and the capital of Nebraska, is the second most populated city. The next highest-populated city is Papillion (Sarpy County), followed by Bellevue (Sarpy County), Grand Island (Hall County), and Kearney (Buffalo County).

Exposure map was prepared considering population density at the county scale. For representation in map, we transformed population data to logarithmic scale.
Vulnerability index
In the context of social vulnerability, in Northern and Western Nebraska, counties like Banner, Scotts Bluff, Sioux, and Sheridan showed higher indexes because these regions had a relatively higher proportion of elderly and infant populations (Fig. 7). Language and cultural differences could be observed in these regions due to a substantial number of Hispanic, African/Black, and Asian individuals. On the ecological front, these regions had better air quality (PM 2.5 concentration was the least for Nebraska’s north and western regions). However, factors like lower food environment index and occupational hazard were higher for Grant and Blaine counties, resulting in a higher ecological vulnerability. This part of Nebraska has higher income inequality and less available housing, which resulted in a higher economic vulnerability index. The higher obese and disabled population also increased health vulnerability.

Vulnerability map was prepared considering social, ecological, economic, and health drivers at the county scale.
In Eastern Nebraska, Thurston County was found to have the highest health and economic vulnerability, while Douglas, Lancaster, and Dakota showed higher social vulnerability due to the presence of more diverse ethnic groups. In the context of vulnerability, the southern region containing Furnas, Harlan, Franklin, and Pawnee had a higher elderly population, resulting in a higher social vulnerability index. Similarly, Dawson and Hall counties showed higher indexes due to Hispanic and African/Black populations. The other factors which resulted in higher vulnerability included income inequality, food environment index, and the presence of disabled and obese population.
Response index
The northern and western regions’ response was guided by the presence of more wetlands, which reduces the risk of flooding. Further, the fact that these regions experience less flooding compared to Nebraska’s eastern and southern regions makes them safer and reduces the response requirement (Fig. 8). The regions also showed better response because of better emergency preparation for flooding events. It was observed that emergency shelter availability per person was higher for regions like Blaine, Loup, Thomas, and Grant. However, this can be due to the fact they have a lesser population. In the eastern region, counties like Sarpy, Douglas, Saunders, and Lancaster showed better responses. Counties like Douglas, Sarpy, and Lancaster have higher insurance coverage rates for properties. Also, these regions have more structural flood control measures in the form of levees and dams. However, there have been more flooding events compared to other regions of Nebraska, resulting in higher risk. Response to flooding was well addressed in the southern region. There were several factors behind this. Firstly, a substantial number of dams were located in the area, resulting in higher drainage areas. Secondly, these counties have many natural wetlands, which can effectively reduce the risk of flooding. Third, counties like Dundy, Hitchcock, Red Willow, Franklin, and Webster have seen relatively lower flooding in recent times12.

Response map was prepared considering structural-, non-structural-, and emergency response at the county scale.
Risk index
The final risk map showed the overall risk associated with flooding (Fig. 9). This was prepared considering all the drivers (hazard, exposure, vulnerability, and response). Counties located in the eastern part of Nebraska showed higher risk. Dakota and Sarpy showed the highest risk of flooding, while Adams, Wayne, Cass, Pierce, Colfax, and Platte showed a substantial amount of risk. Although counties like Douglas and Lancaster are more densely populated and have a higher density of infrastructures compared to others, they showed relatively lower risk since they have a stronger response capability to flooding. Further, we used the relative value of each variable and scaled them for a better comparative analysis with vastly different population sizes and numbers of housing units. The counties in Western Nebraska showed a lower risk of flooding, which does not imply that no flooding can occur. This part of the state has lower exposure and a less susceptible population, so the chance of severe flooding consequences is reduced. The heightened risk in Dakota County stems primarily from a greater number of properties exposed to hazards, coupled with notable vulnerabilities. Sarpy County’s elevated overall risk, compared to other counties, arises primarily from increased exposure. Additionally, a notable level of vulnerability further elevates the overall risk assessment despite their well-implemented response measures. Also, many counties exhibit varying risk factors across different components. For instance, though Douglas County has more exposure, it has a lower hazard value than other counties such as Adams, Sarpy, Wayne, Cass, Dakota, and Thurston. Overall, these results gave strong insights into flood risk at the county level. They could be a good starting point for other studies to look for flood risk at the county scale while considering an exhaustive list of risk factors.

Risk map was prepared considering hazard, exposure, vulnerability, and response at the county scale.
Introducing response has led to significant changes in the risk map compared to the original risk formulation. Nebraska flood management plan documents the highest frequency of flooding incidents in southeastern counties12. These counties include Richardson, Nemaha, Saline, Saunders, Otoe, and Cass, which have endured the substantial impacts of flooding. However, an examination of their response to these flooding challenges reveals that these counties have implemented effective flood control measures. Collectively, they have established over 350 flood-controlling structures, primarily in the form of dams14. The same proactive approach applies to their utilization of levees, bolstering their preparedness for flood events14. Similarly, counties such as Douglas, Sarpy, Dodge, Lancaster, and Cass have responded by enhancing their property insurance coverage. While the regions in eastern Nebraska remain more susceptible to flooding, these counties have demonstrated noteworthy strategies for mitigating the risk. These types of information are necessary for a more realistic risk assessment. By explicitly considering forms of response, we can gain valuable insights into varying risk profiles, and a better understanding of the overall risk landscape.
Risk index validation
In 2019, Nebraska experienced one of the deadliest flooding events. Out of 93 counties, 81 declared emergencies with a loss of more than 1.3 billion USD in infrastructure damages12. The counties which suffered the most included Adams, Boyd, Buffalo, Colfax, Custer, Dodge, Douglas, Knox, Madison, Nemaha, Pierce, Platte, Richardson, Sarpy, Saunders, Stanton, and Washington. These counties experienced significant damage to population and properties. The loss of infrastructure affected the post-flooding response as it limited access to different areas. Further, these counties were identified as having higher infrastructure damage, crop and livestock losses, evacuations and displaced residents, disruption to services, economic loss, and environmental impacts. Our study also showed substantial risk in most of these areas. However, it should be noted that our analysis focuses on properties and the associated population. The scope can be broadened by adding more information related to economic, environmental, health, and social dimensions.
Uncertainty sources and future developments
We encompassed different dimensions under each component of risk. To quantify risk, we acquired datasets from various sources such as DataUSA, First Street Foundation, Homeless Shelters Organization, State Organizations, U.S. Army Corps of Engineers database, and U.S. Census Bureau. Note that the quality and consistency of these datasets can vary due to discrepancies in definitions, methodologies, and modes of collection. Future developments can look toward improving data sharing and integration capacity, standardizing data collection methodologies, and conducting collaborations at different levels (researchers, policymakers, and stakeholders).
We explored the risk associated with flooding on a county scale for Nebraska using a unique combination of components and variables. Each driver and the corresponding variable used to quantify them were equally weighted. There can be other ways to come up with the weightage; for instance, Reckien used existing documents and assessment reports for weighing indicators55. Bankoff et al. suggested expert knowledge for the selection and weightage of variables56, while Rufat et al. utilized the weights developed by prior studies57. It would be valuable for future studies to weigh each variable according to their importance in estimating flood risk.
We assessed flood risk associated with properties and population, which can be calculated for other dimensions of floods (geographic, social, and infrastructural). It is difficult to quantify flood hazards at a county or state level at a high resolution due to the computation challenges associated with detailed spatial–temporal modeling. In such cases, studies can work toward developing high-resolution flood maps, which can be used for quantification of flood hazards.
We classified county flood vulnerability into four major types: social, ecological, economic, and health. This allowed us to explore different aspects which affect humankind. There is potential for future studies to expand this list of factors resulting in flood-associated vulnerability. Further, in the context of health vulnerability, more publicly accessible data can be beneficial. Information related to different diseases caused by floods can be helpful in establishing essential risk frameworks.
Quantification of flood-risk response was one of the novelties of this work. We classified response into four classes based on the information obtained from the Department of Natural Resources in Nebraska, the Nebraska Department of Health and Human Services, state flood hazard management plans, and the U.S. Army Corps of Engineers website. It will be essential to develop a system to collect and quantify response information associated with flooding.