
Notable trends:
- Buying a home is now more expensive nationwide than renting — national medians for both one- and two-bedroom homes are down for the second month in a row. The new national median for a one-bedroom is $1,499, a month-over-month decrease of 0.4 percent. At $1,856, the median for two-bedrooms is down 0.3 percent month-over-month.
- Half the cities on Zumper’s top 100 list are down year-over-year.
- Steep price declines continue across areas of the Sun Belt—like Austin and Phoenix— decreasing more quickly than the national median.

A renters’ market
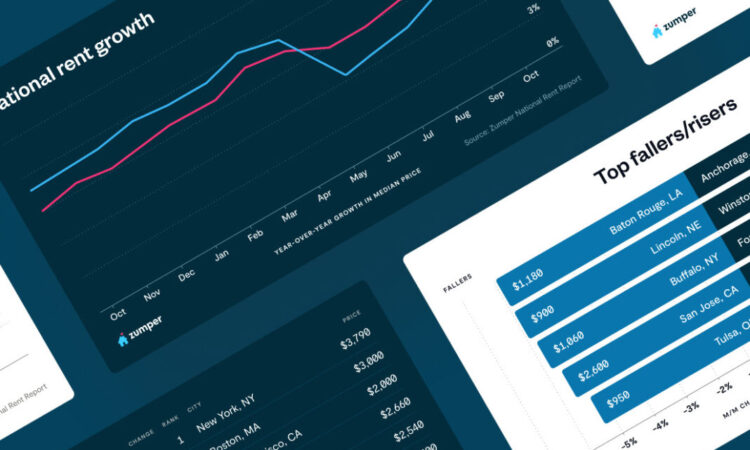
As inflation eases, migrations slow and a record number of multifamily buildings come online, renters find themselves in a much less stressful situation than a year ago. They have more options and less competition, and prices continue to soften in many markets. This is reflected in our National Rent Index as the national medians for both one- and two-bedroom homes are down for the second month in a row and the year-over-year growth rates for both are at their lowest points since December 2020. Additionally, nearly 10,000 buildings on our platform are offering rent specials this month. In fact, buying a home is now 52 percent more expensive than renting nationwide, the widest gap on record.
Of the 100 cities on our list, 60 have one-bedroom median rents lower than last month, 11 are flat month-over-month, and 29 are up. And, as we stated last month: We’re keeping a close eye on year-over-year numbers—which are up, but by some of the smallest amounts we’ve seen in years. Half the cities on our top 100 list are down compared to November of last year.
This continued softening is partially due to the fact that pandemic-era price hikes are still normalizing in many markets—especially in Zoomtowns across the Sun Belt, where we’re seeing some of the steepest year-over-year declines. Each of the nine Texas cities on our list is down compared to November of last year, except for Fort Worth. Of the six Arizona cities, all are down year-over-year except Gilbert.
Zumper CEO Anthemos Georgiades weighs in: “We’re seeing most major markets settle into their new resting heart rates. Miami, for example, is more expensive than pre-pandemic; but it’s no longer seeing steep hikes month after month.”

A tale of many cities
There are, of course, anomalies—the most notable being New York, where the one-bedroom median of $4,300 is an all-time high, and is up a whopping 13.5 percent year-over-year. As stated recently in The New York Times: “It’s a great time to be rich in New York City.” But non-wealthy residents will continue battling for cramped apartment shares and no-frills walk-ups in less desirable locations in order to afford life in the Big Apple. According to city data, more than half of New York City households are rent-burdened (spending 30 percent or more of their income or more on rent).
Meanwhile, average renters can live large in many cities on the bottom half of our list. In St. Louis, MO—which we recently named the second best city for singles—you can find a stylish luxury two-bedroom, two-bath apartment with skyline views for about a third of the price of a one-bedroom in New York City. And cities that have become supply-rich over the last year offer even more options. In Colorado Springs—which is in the middle of a building boom—rents at a newly built luxury building with concierge services, pool and spa start at $1,499.

If you’re interested in how Zumper’s historical rent data compares with the Shelter CPI produced monthly by the U.S. Bureau of Labor Statistics, view our updated chart here: https://www.zumper.com/blog/zumper-consumer-price-index/.
Full Data
| 1 bedroom | 2 Bedrooms | |||||||
|---|---|---|---|---|---|---|---|---|
| Ranking | Ranking Change | City | Price | M/M% | Y/Y% | Price | M/M% | Y/Y% |
| 1 | 0 | New York, NY | $4,300 | 1.40% | 13.50% | $5,000 | 4.60% | 13.10% |
| 2 | 0 | Jersey City, NJ | $3,090 | -1.30% | 6.60% | $3,950 | 2.60% | 23.40% |
| 3 | 1 | Boston, MA | $2,990 | 1.00% | -0.30% | $3,500 | 0.60% | 1.40% |
| 4 | -1 | San Francisco, CA | $2,970 | -0.30% | -1.00% | $3,980 | -0.50% | -0.50% |
| 5 | 0 | Miami, FL | $2,600 | -2.30% | -2.30% | $3,500 | -1.40% | 0.60% |
| 6 | 0 | San Jose, CA | $2,480 | -2.00% | -2.40% | $3,110 | -2.20% | -1.00% |
| 7 | 0 | San Diego, CA | $2,400 | -1.20% | -4.00% | $3,170 | -0.90% | -1.20% |
| 8 | 0 | Los Angeles, CA | $2,380 | -0.80% | -2.10% | $3,370 | -1.70% | 2.10% |
| 9 | 0 | Washington, DC | $2,330 | -2.50% | 1.30% | $3,090 | -2.20% | -1.30% |
| 10 | 0 | Arlington, VA | $2,270 | -0.90% | 4.10% | $2,990 | 0.00% | 3.50% |
| 11 | 0 | Oakland, CA | $2,090 | -2.30% | -6.30% | $2,700 | -1.80% | -3.60% |
| 12 | 0 | Santa Ana, CA | $2,080 | -1.00% | 3.00% | $2,910 | 4.70% | 1.00% |
| 13 | 0 | Anaheim, CA | $2,030 | -0.50% | 5.20% | $2,590 | 0.00% | -1.90% |
| 13 | 0 | Chicago, IL | $2,030 | -0.50% | 8.60% | $2,620 | 0.80% | 16.40% |
| 15 | 1 | Charleston, SC | $2,000 | 2.00% | 0.00% | $2,360 | -1.30% | 0.00% |
| 15 | 0 | Fort Lauderdale, FL | $2,000 | -1.50% | -5.70% | $2,800 | -3.40% | -5.70% |
| 17 | 1 | Urban Honolulu, HI | $1,950 | 1.00% | 8.30% | $2,690 | -0.40% | 12.10% |
| 18 | -1 | Seattle, WA | $1,930 | -1.00% | 0.00% | $2,650 | -1.50% | 0.00% |
| 19 | 0 | Long Beach, CA | $1,800 | 0.00% | 1.70% | $2,450 | 2.10% | 1.20% |
| 20 | -1 | Providence, RI | $1,780 | -1.10% | -1.70% | $2,110 | -0.50% | 13.40% |
| 21 | 0 | Denver, CO | $1,770 | -0.60% | 6.00% | $2,320 | -2.90% | 3.10% |
| 22 | 0 | Nashville, TN | $1,750 | 0.00% | 2.90% | $1,950 | 1.60% | 7.10% |
| 23 | 0 | Scottsdale, AZ | $1,730 | -0.60% | -8.90% | $2,330 | -6.00% | -6.80% |
| 24 | 0 | Atlanta, GA | $1,710 | -1.20% | 5.60% | $2,210 | -2.60% | 1.80% |
| 25 | 2 | New Haven, CT | $1,690 | 3.00% | 0.00% | $1,980 | 1.50% | 0.00% |
| 26 | -1 | Gilbert, AZ | $1,660 | -1.80% | 5.70% | $1,870 | 1.10% | 2.70% |
| 27 | -1 | Tampa, FL | $1,600 | -3.00% | -3.00% | $1,900 | -1.00% | -0.50% |
| 28 | 0 | Charlotte, NC | $1,580 | -0.60% | 6.80% | $1,860 | 0.50% | 10.70% |
| 29 | 0 | Orlando, FL | $1,570 | 0.60% | -7.10% | $1,850 | -1.10% | -6.10% |
| 30 | 0 | Austin, TX | $1,520 | -1.90% | -9.50% | $1,970 | -1.00% | -5.30% |
| 30 | 1 | Virginia Beach, VA | $1,520 | -0.70% | 8.60% | $1,700 | -5.00% | 6.30% |
| 32 | 9 | New Orleans, LA | $1,500 | 5.60% | -1.30% | $1,750 | 0.00% | -2.80% |
| 32 | 0 | Philadelphia, PA | $1,500 | -1.30% | 2.00% | $1,750 | -1.10% | 2.90% |
| 32 | 3 | Sacramento, CA | $1,500 | 2.70% | -3.80% | $1,850 | 0.50% | -2.60% |
| 35 | 6 | Plano, TX | $1,470 | 3.50% | -2.00% | $2,000 | 2.60% | 2.60% |
| 36 | 2 | Durham, NC | $1,450 | 1.40% | 14.20% | $1,720 | 1.20% | 15.40% |
| 36 | -2 | Newark, NJ | $1,450 | -2.70% | 3.60% | $1,800 | 0.60% | 4.00% |
| 36 | -3 | St. Petersburg, FL | $1,450 | -3.30% | -5.20% | $2,000 | -3.40% | -8.30% |
| 39 | -4 | Asheville, NC | $1,440 | -1.40% | 0.00% | $1,830 | -1.60% | 0.00% |
| 39 | -1 | Henderson, NV | $1,440 | 0.70% | -3.40% | $1,750 | 1.70% | 0.00% |
| 41 | -6 | Portland, OR | $1,420 | -2.70% | -7.80% | $1,800 | -3.20% | 0.60% |
| 42 | -4 | Minneapolis, MN | $1,410 | -1.40% | 13.70% | $2,040 | 1.00% | 17.20% |
| 43 | 2 | Aurora, CO | $1,390 | -0.70% | 3.70% | $1,820 | -2.70% | -3.70% |
| 43 | 3 | Dallas, TX | $1,390 | 0.00% | -2.10% | $1,940 | -1.00% | -1.50% |
| 45 | -4 | Madison, WI | $1,380 | -2.80% | 1.50% | $1,680 | -1.20% | -2.90% |
| 46 | 0 | Knoxville, TN | $1,370 | -1.40% | 6.20% | $1,580 | -1.30% | 0.60% |
| 47 | -6 | Baltimore, MD | $1,350 | -4.90% | -2.20% | $1,590 | -3.60% | -3.00% |
| 48 | 3 | Boise, ID | $1,330 | 1.50% | -7.60% | $1,450 | 3.60% | -4.00% |
| 48 | 1 | Phoenix, AZ | $1,330 | -1.50% | -4.30% | $1,600 | 0.00% | -5.30% |
| 50 | -4 | Anchorage, AK | $1,310 | -5.80% | 5.60% | $1,600 | -4.80% | 12.70% |
| 50 | 14 | Fresno, CA | $1,310 | 4.80% | -1.50% | $1,600 | 0.00% | 0.60% |
| 50 | 4 | Richmond, VA | $1,310 | 0.80% | -6.40% | $1,530 | 0.00% | -1.30% |
| 53 | -2 | Fort Worth, TX | $1,300 | -0.80% | 3.20% | $1,550 | -4.30% | -1.90% |
| 53 | 4 | Houston, TX | $1,300 | 1.60% | -3.00% | $1,610 | 0.60% | -4.20% |
| 53 | -3 | Raleigh, NC | $1,300 | -2.30% | 2.40% | $1,560 | -1.90% | 2.00% |
| 53 | 1 | Reno, NV | $1,300 | 0.00% | -4.40% | $1,610 | 0.60% | -5.30% |
| 57 | -3 | Mesa, AZ | $1,280 | -1.50% | -5.90% | $1,540 | 0.00% | -10.50% |
| 57 | 9 | Norfolk, VA | $1,280 | 5.80% | 2.40% | $1,360 | -2.90% | 0.70% |
| 59 | -8 | Chattanooga, TN | $1,270 | -3.10% | 3.30% | $1,480 | -1.30% | 2.80% |
| 59 | -2 | Jacksonville, FL | $1,270 | -0.80% | 1.60% | $1,450 | -0.70% | -2.00% |
| 61 | -1 | Irving, TX | $1,260 | -0.80% | -14.30% | $1,650 | 0.60% | -13.20% |
| 62 | 0 | Cleveland, OH | $1,250 | -0.80% | -0.80% | $1,300 | -0.80% | -0.80% |
| 62 | 0 | Pittsburgh, PA | $1,250 | -0.80% | -2.30% | $1,470 | -2.00% | -2.00% |
| 62 | -2 | Salt Lake City, UT | $1,250 | -1.60% | -7.40% | $1,660 | 3.80% | 0.60% |
| 65 | -8 | Glendale, AZ | $1,240 | -3.10% | -8.10% | $1,450 | 0.00% | -15.70% |
| 65 | -1 | Las Vegas, NV | $1,240 | -0.80% | -4.60% | $1,500 | 0.00% | -3.20% |
| 67 | 0 | Columbus, OH | $1,190 | 0.00% | 11.20% | $1,380 | -0.70% | 6.20% |
| 68 | -1 | Colorado Springs, CO | $1,150 | -3.40% | -6.50% | $1,500 | 0.00% | -3.20% |
| 68 | 1 | Rochester, NY | $1,150 | -0.90% | 9.50% | $1,350 | -5.60% | -2.20% |
| 70 | 1 | Kansas, City, MO | $1,130 | 0.00% | 6.60% | $1,400 | 0.00% | 19.70% |
| 71 | 1 | Arlington, TX | $1,100 | -1.80% | -0.90% | $1,470 | 0.70% | -1.30% |
| 71 | -1 | Indianapolis, IN | $1,100 | -4.30% | 6.80% | $1,300 | -1.50% | 7.40% |
| 71 | 3 | Spokane, WA | $1,100 | 0.00% | 1.90% | $1,300 | 0.00% | -5.10% |
| 74 | -1 | Louisville, KY | $1,080 | -2.70% | 1.90% | $1,180 | -2.50% | -7.10% |
| 74 | 0 | Milwaukee, WI | $1,080 | -1.80% | 11.30% | $1,120 | -2.60% | 2.80% |
| 76 | 3 | Buffalo, NY | $1,060 | 2.90% | -1.90% | $1,250 | 0.00% | 9.60% |
| 77 | 0 | Bakersfield, CA | $1,050 | 1.00% | -6.30% | $1,350 | -3.60% | -3.60% |
| 77 | -1 | Detroit, MI | $1,050 | 0.00% | -4.50% | $1,100 | -1.80% | -4.30% |
| 77 | 0 | San Antonio, TX | $1,050 | 1.00% | -9.50% | $1,360 | -2.20% | -5.60% |
| 80 | 0 | Omaha, NE | $1,000 | 0.00% | 9.90% | $1,380 | -1.40% | 9.50% |
| 81 | 2 | Syracuse, NY | $990 | 2.10% | 3.10% | $1,200 | -2.40% | -0.80% |
| 82 | -2 | Cincinnati, OH | $980 | -2.00% | -2.00% | $1,400 | 0.00% | 2.90% |
| 83 | -1 | Tallahassee, FL | $970 | -1.00% | 4.30% | $1,250 | -1.60% | -2.30% |
| 84 | 2 | Albuquerque, NM | $950 | 0.00% | 0.00% | $1,300 | -1.50% | 0.00% |
| 84 | 1 | Baton Rouge, LA | $950 | -1.00% | 5.60% | $1,070 | 5.90% | 3.90% |
| 84 | 4 | Des Moines, IA | $950 | 1.10% | 3.30% | $1,180 | 0.00% | 19.20% |
| 87 | 3 | Lexington, KY | $930 | 2.20% | 6.90% | $1,200 | -3.20% | 1.70% |
| 88 | 4 | Tucson, AZ | $920 | 2.20% | -2.10% | $1,240 | -1.60% | -4.60% |
| 88 | -5 | Tulsa, OK | $920 | -5.20% | 3.40% | $1,120 | -0.90% | 7.70% |
| 90 | -4 | Greensboro, NC | $910 | -4.20% | -17.30% | $1,170 | 0.00% | -2.50% |
| 91 | -1 | Winston Salem, NC | $900 | -1.10% | -13.50% | $1,090 | -0.90% | -1.80% |
| 92 | -4 | Memphis, TN | $890 | -5.30% | -12.70% | $1,000 | 0.00% | -6.50% |
| 92 | 2 | St. Louis, MO | $890 | 2.30% | -11.90% | $1,250 | -3.10% | -5.30% |
| 94 | -1 | Oklahoma City, OK | $880 | 0.00% | 1.10% | $1,060 | 0.00% | 3.90% |
| 95 | 0 | Augusta, GA | $860 | 2.40% | -7.50% | $960 | 2.10% | -12.70% |
| 96 | 0 | El Paso, TX | $830 | 5.10% | -2.40% | $1,110 | -0.90% | 0.90% |
| 97 | 1 | Lincoln, NE | $800 | 3.90% | -5.90% | $1,070 | -5.30% | 2.90% |
| 98 | 1 | Akron, OH | $760 | 5.60% | 10.10% | $880 | -1.10% | 0.00% |
| 99 | -2 | Shreveport, LA | $750 | -3.80% | 2.70% | $870 | -2.20% | 4.80% |
| 100 | 0 | Wichita, KS | $680 | 4.60% | -4.20% | $860 | -4.40% | 0.00% |
About
The Zumper National Rent Report analyzes rental data from over one million active listings across the country. Listings are then aggregated on a monthly basis to calculate median asking rents for the top 100 cities by population and migration patterns, providing a comprehensive view of the current state of the market. The report is based on all data available in the month of publication. Any data that is reported does not include short term listings. View our full methodology here.
To keep up to date with rent changes across the country, like or follow Zumper on Facebook and Twitter. In the market for a new place? Search apartments for rent on Zumper.