
The latest UK Property Market Stats for week 33 point to a market where buyer demand and housing supply remain relatively healthy, but a significant proportion of properties are struggling to progress to a sale.
🟩 Listings
Week 33 ..
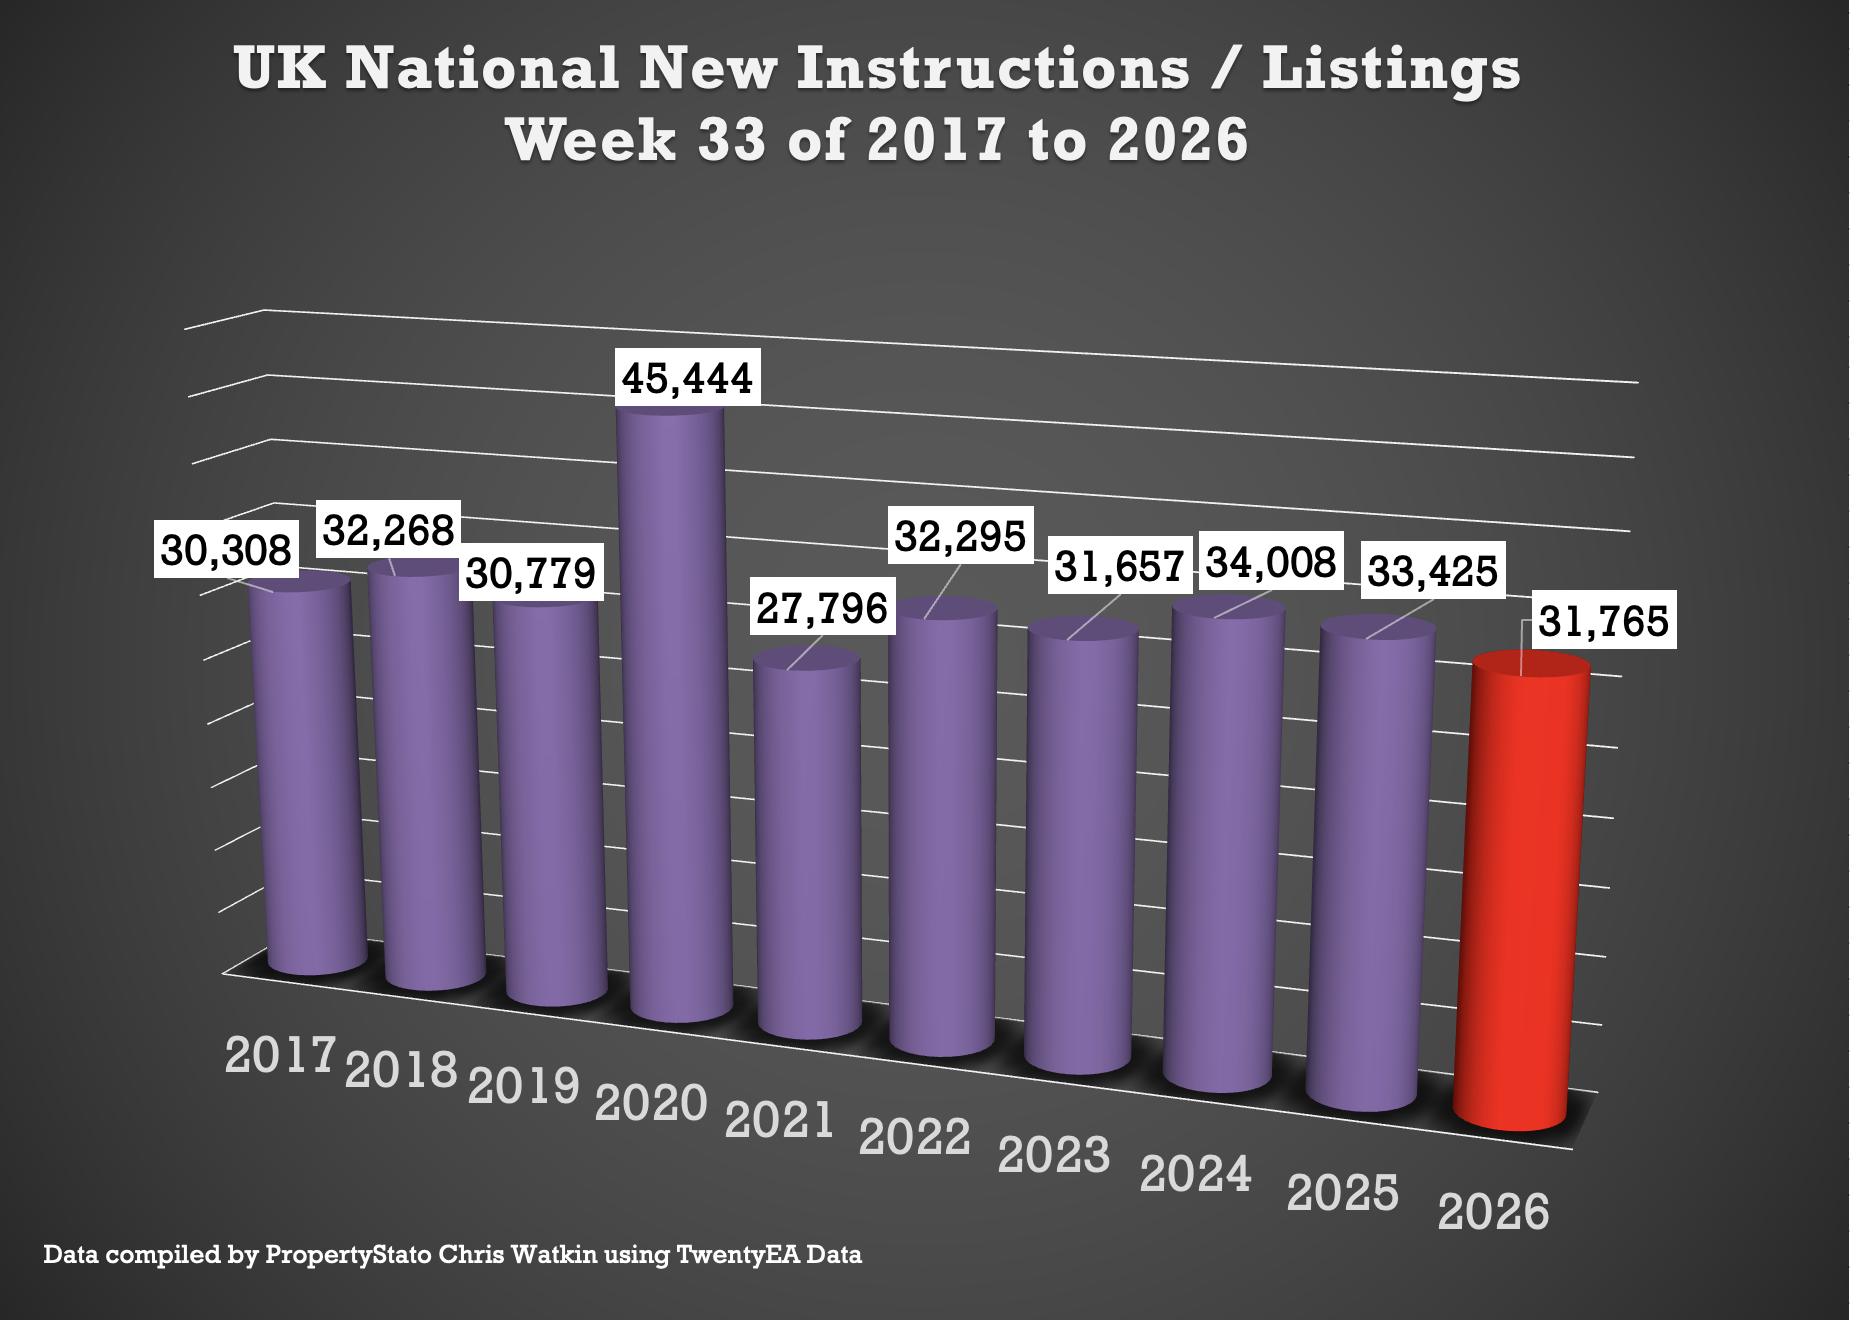
31.8k new listings this week, (32.6k last week).
Weekly 2026 average : 36.3k.
10 year week 33 average : 33k
Year to Date
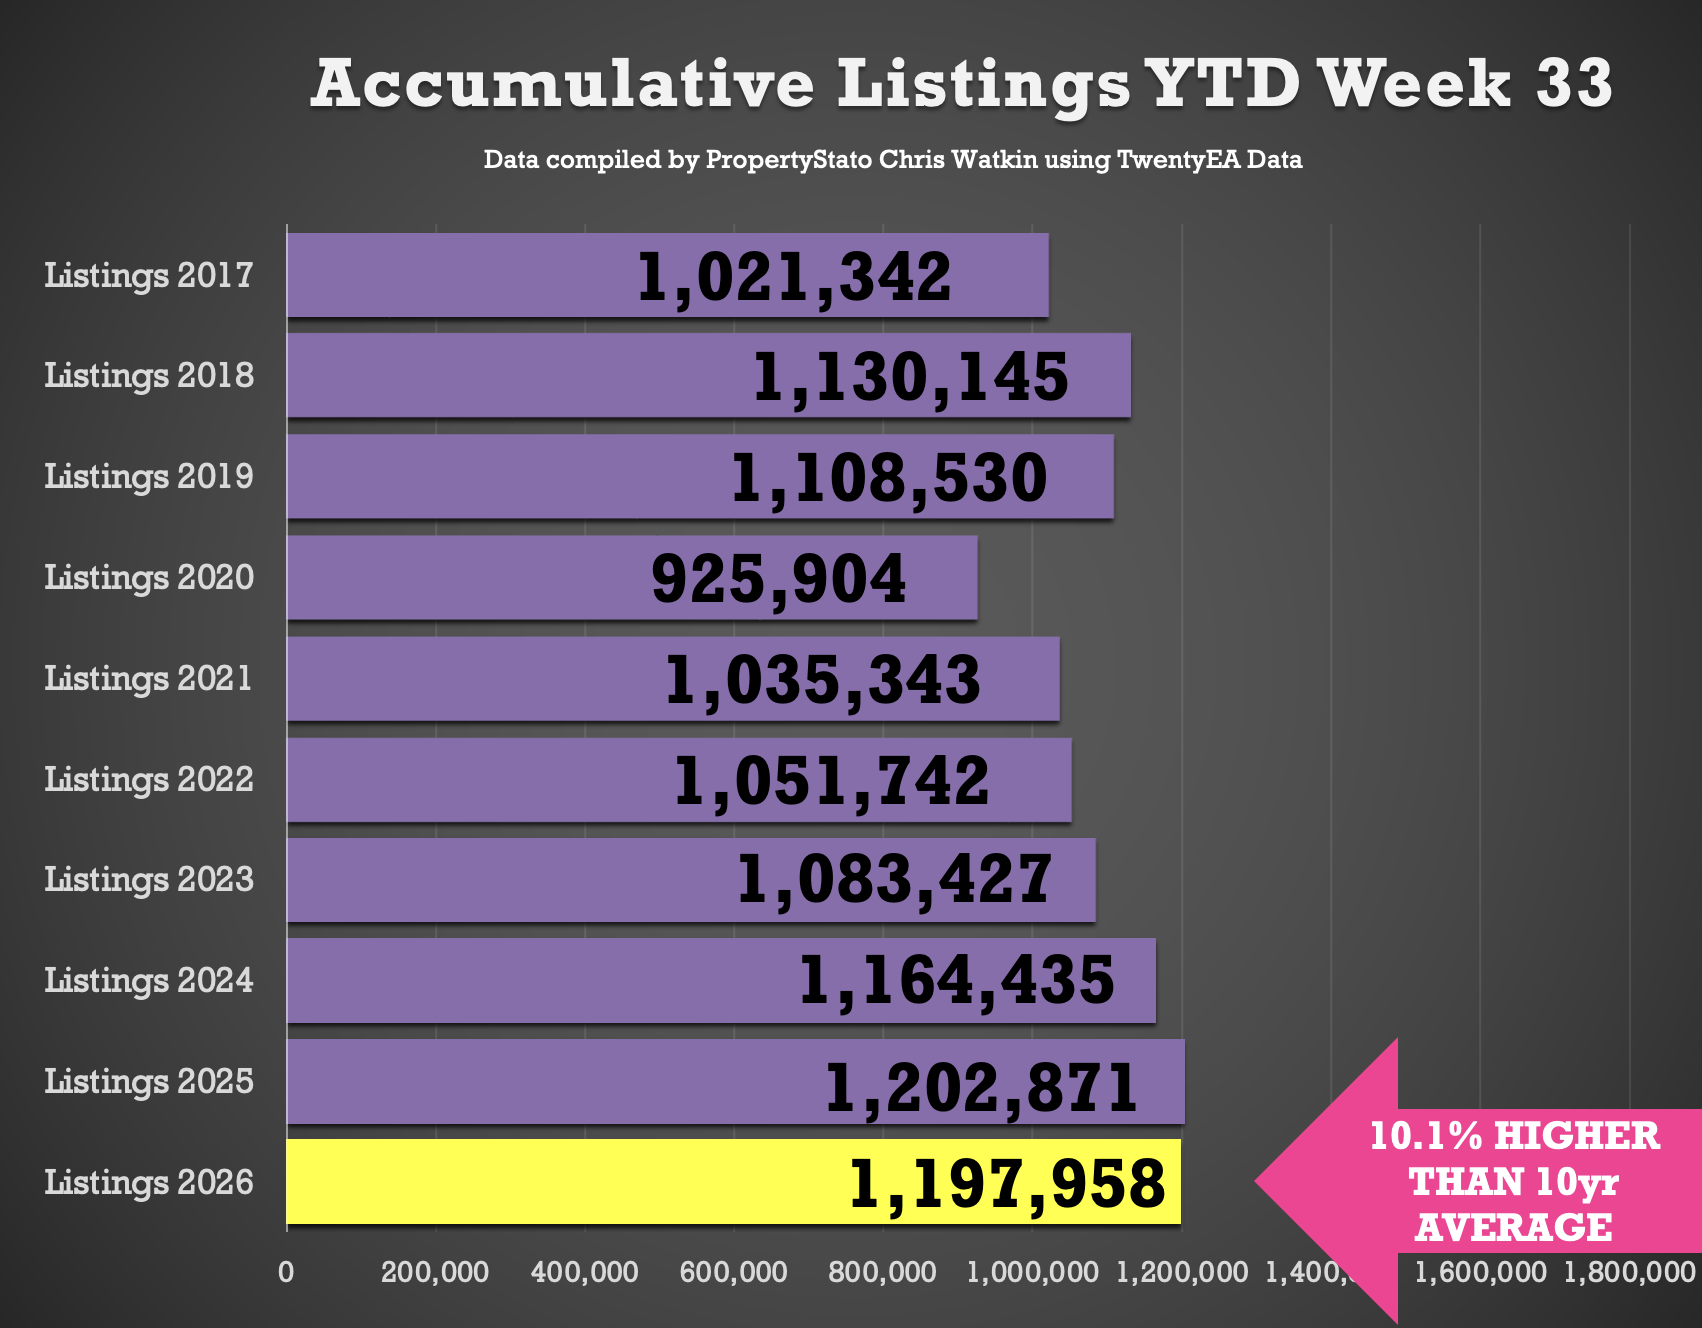
1.198m new listings YTD
0.4% lower than 2025 YTD (1.203m)
2.9% ahead of 2024 YTD (1.164m)
10.2% higher than the 2017–19 average YTD (1.087m).
🟩 UK Gross Resi Sales
Week 33 ..
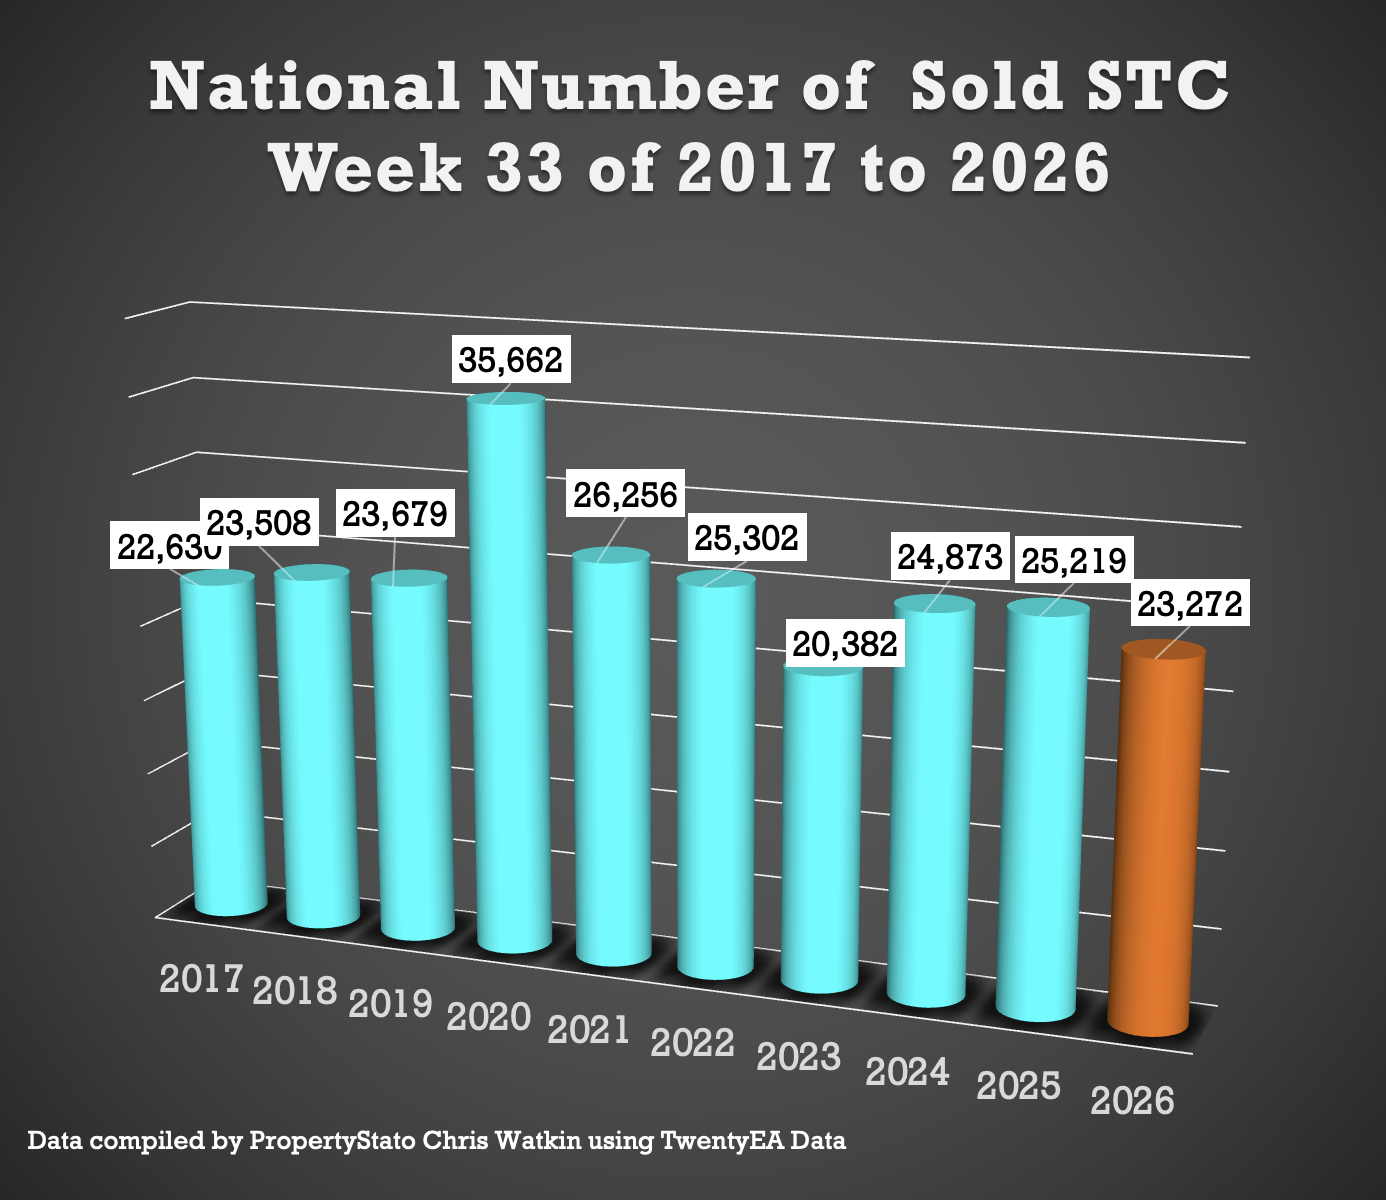
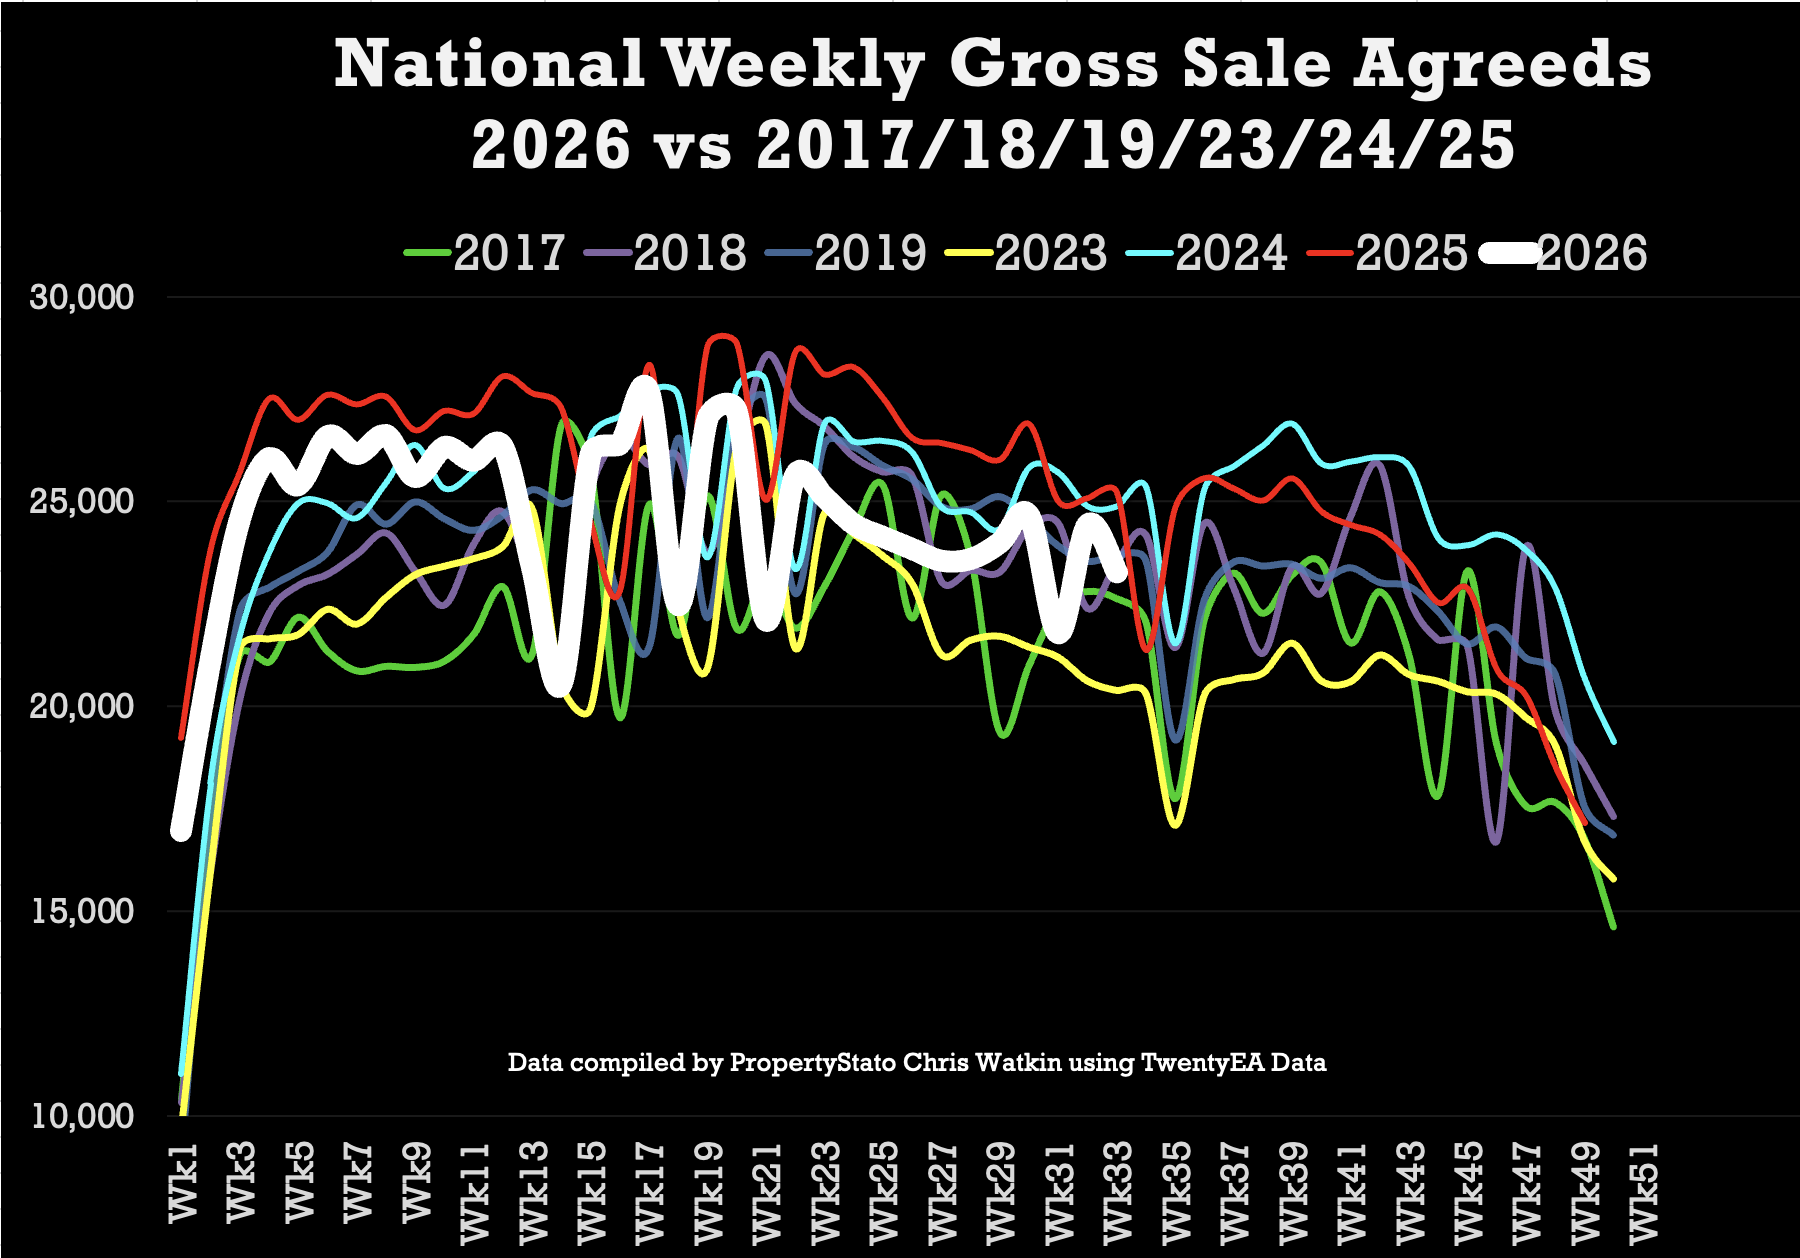
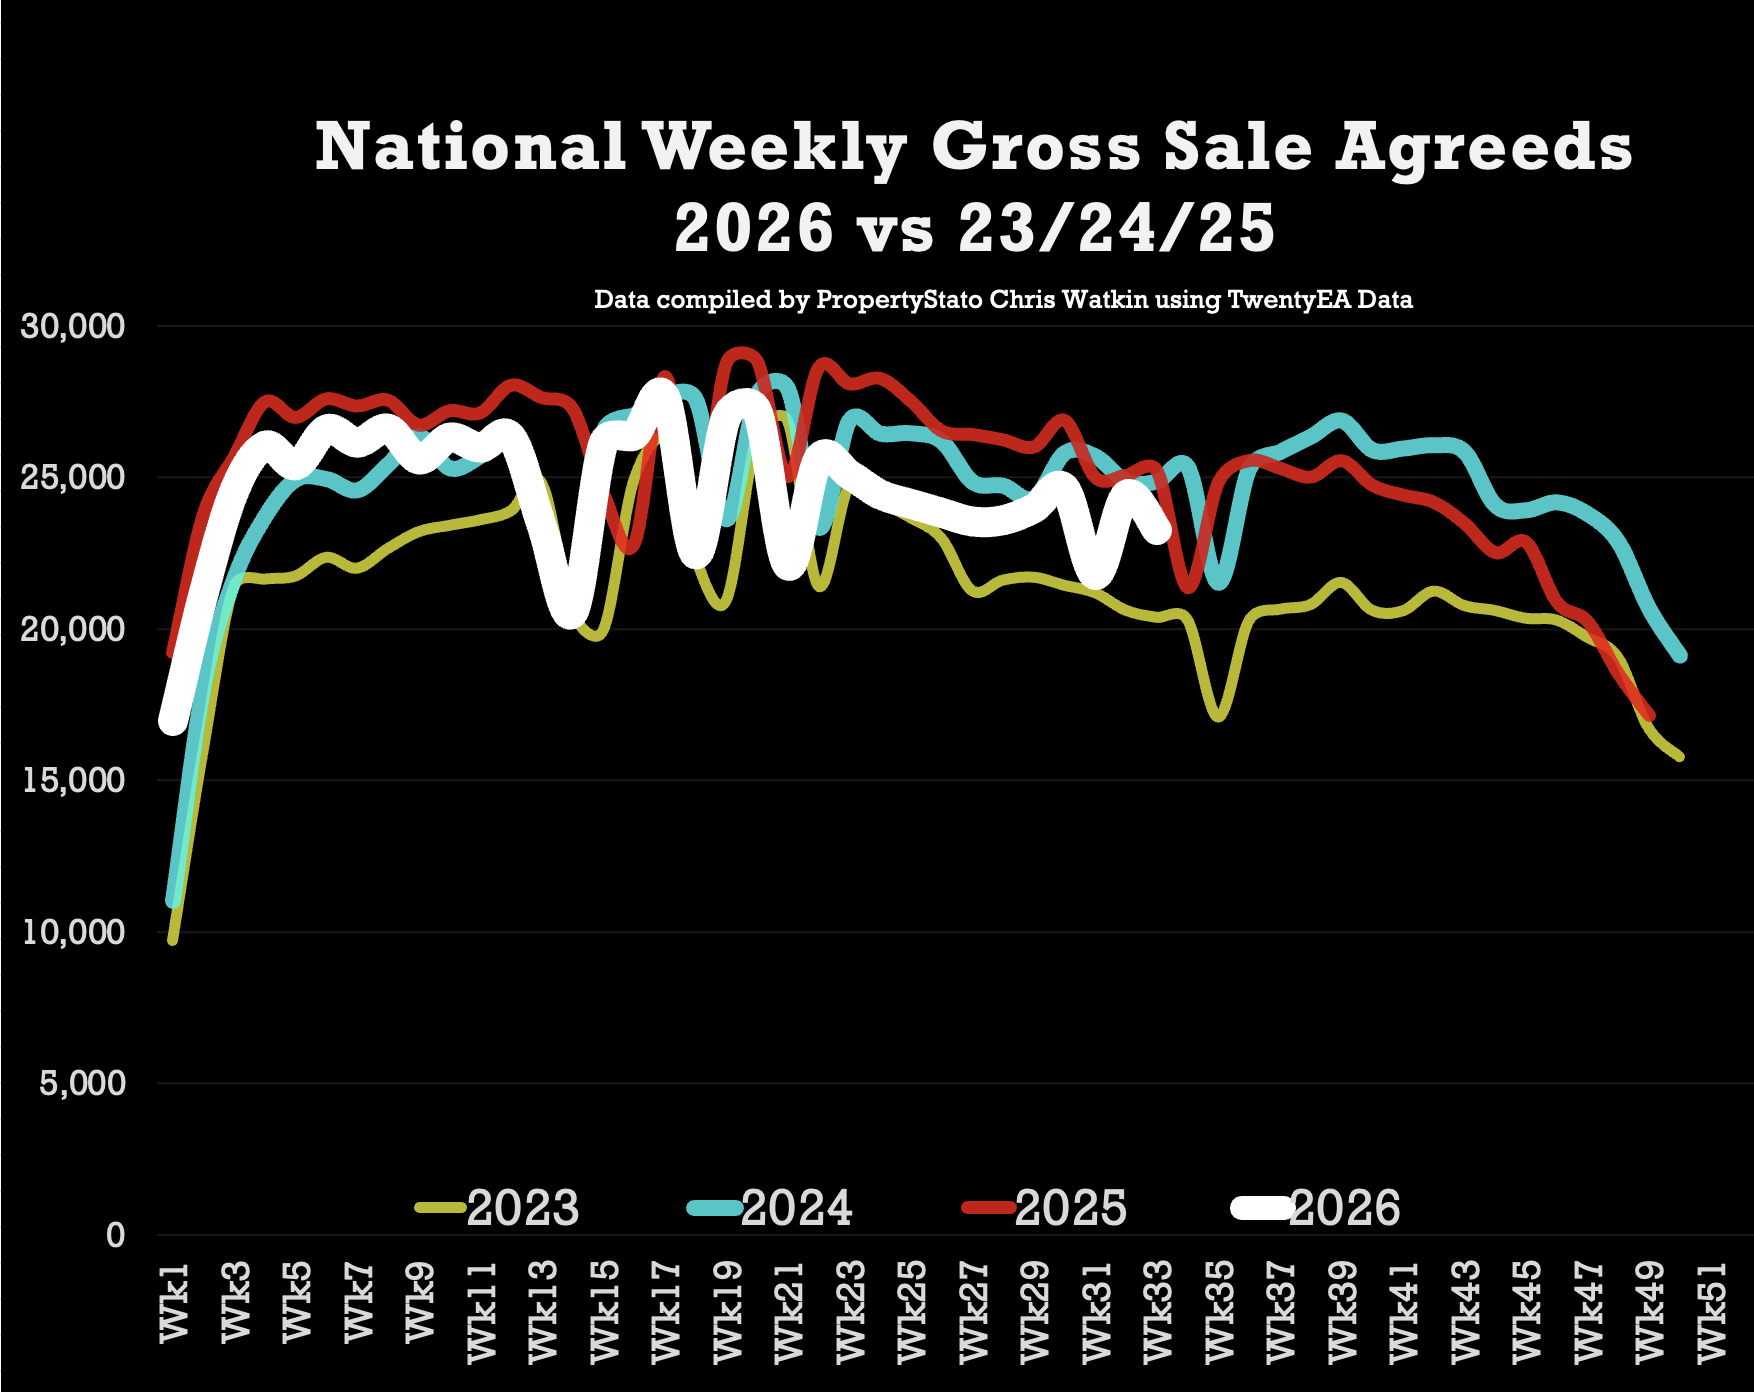
23.3k homes sold stc this week 33 (24.4k last week)
10 year week 33 average : 25.1k
2026 weekly average : 24.5k.
Year to Date for house sales
809k UK homes sold stc YTD
7.2% lower than 2025 YTD (872k)
0.9% lower to 2024 YTD (816k)
10.9% higher than 2023 YTD (730k)
5.8% higher above pre Covid 2017-19 years (765k).
Decade average – 809k YTD.
🟩 UK Net Resi Sales YTD
(Net Sales being Gross Sales less Sale Fall Thrus).
Week 33
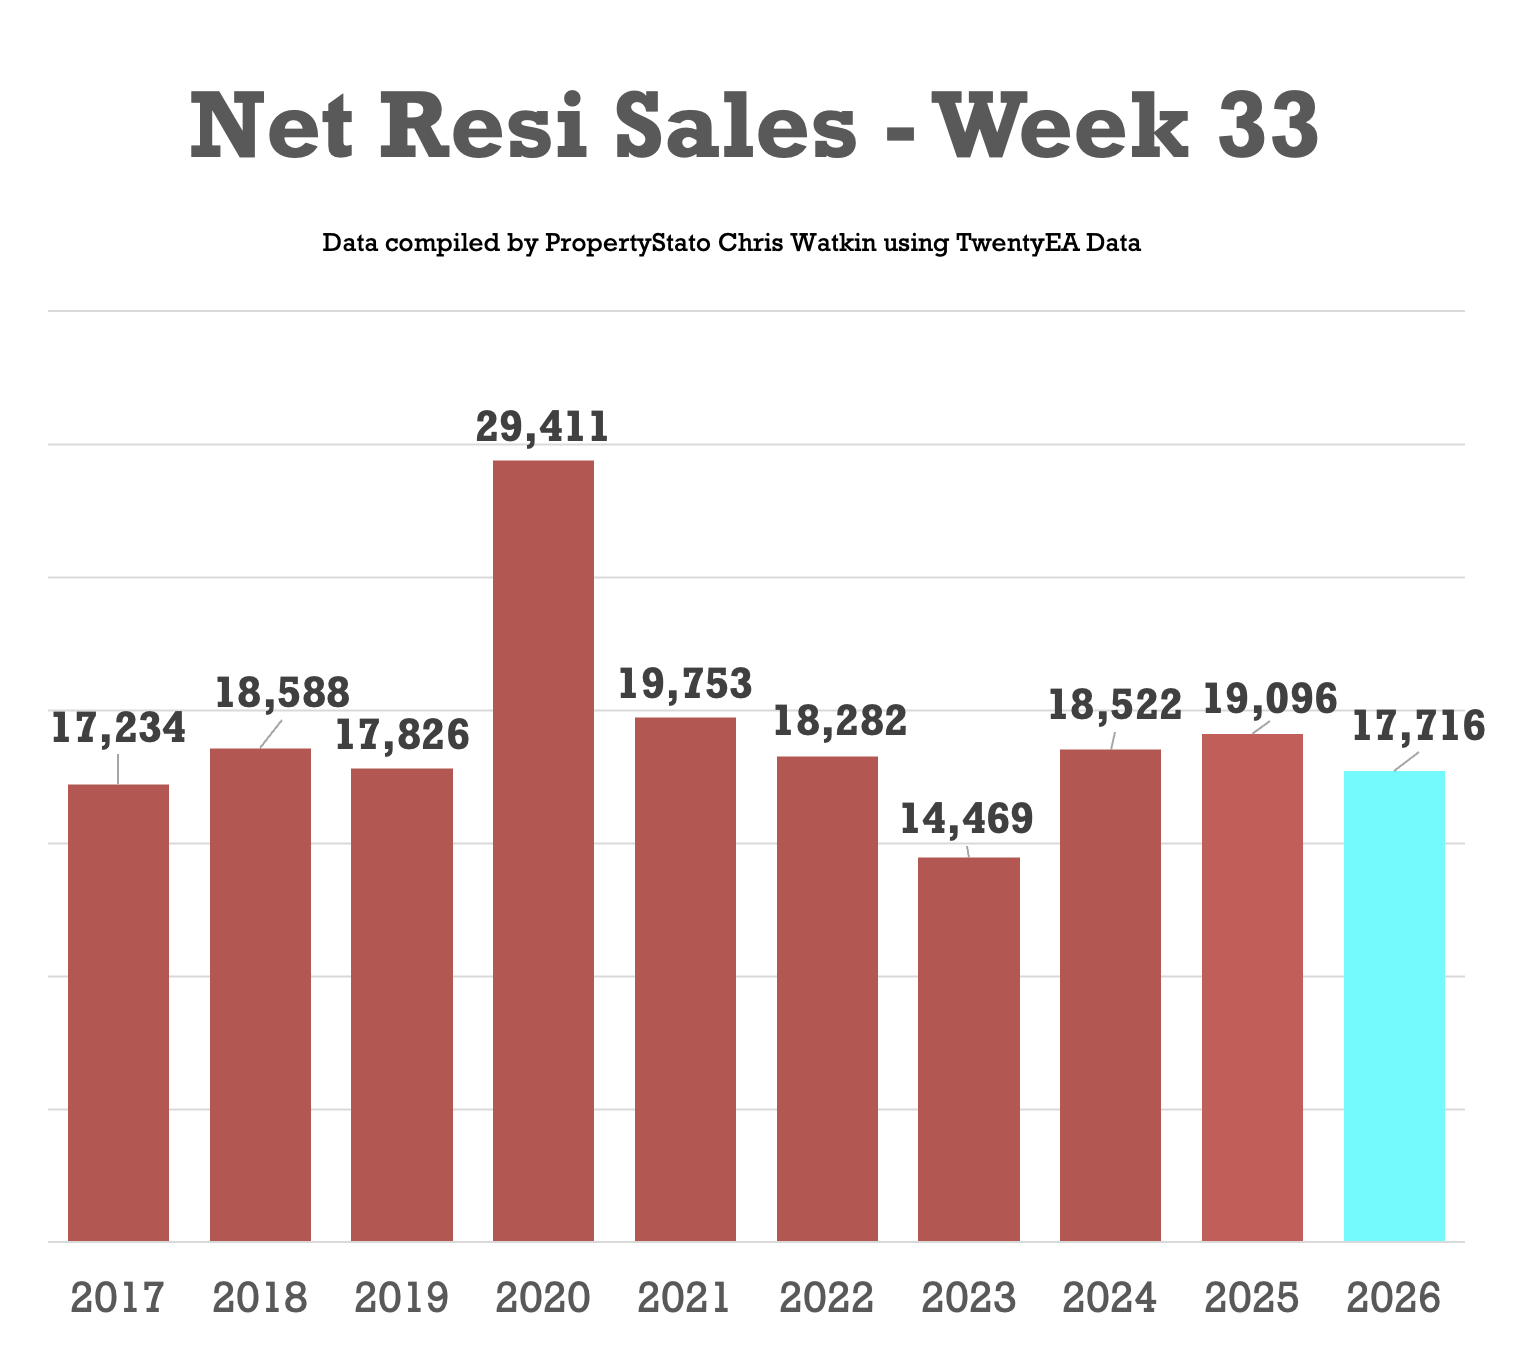
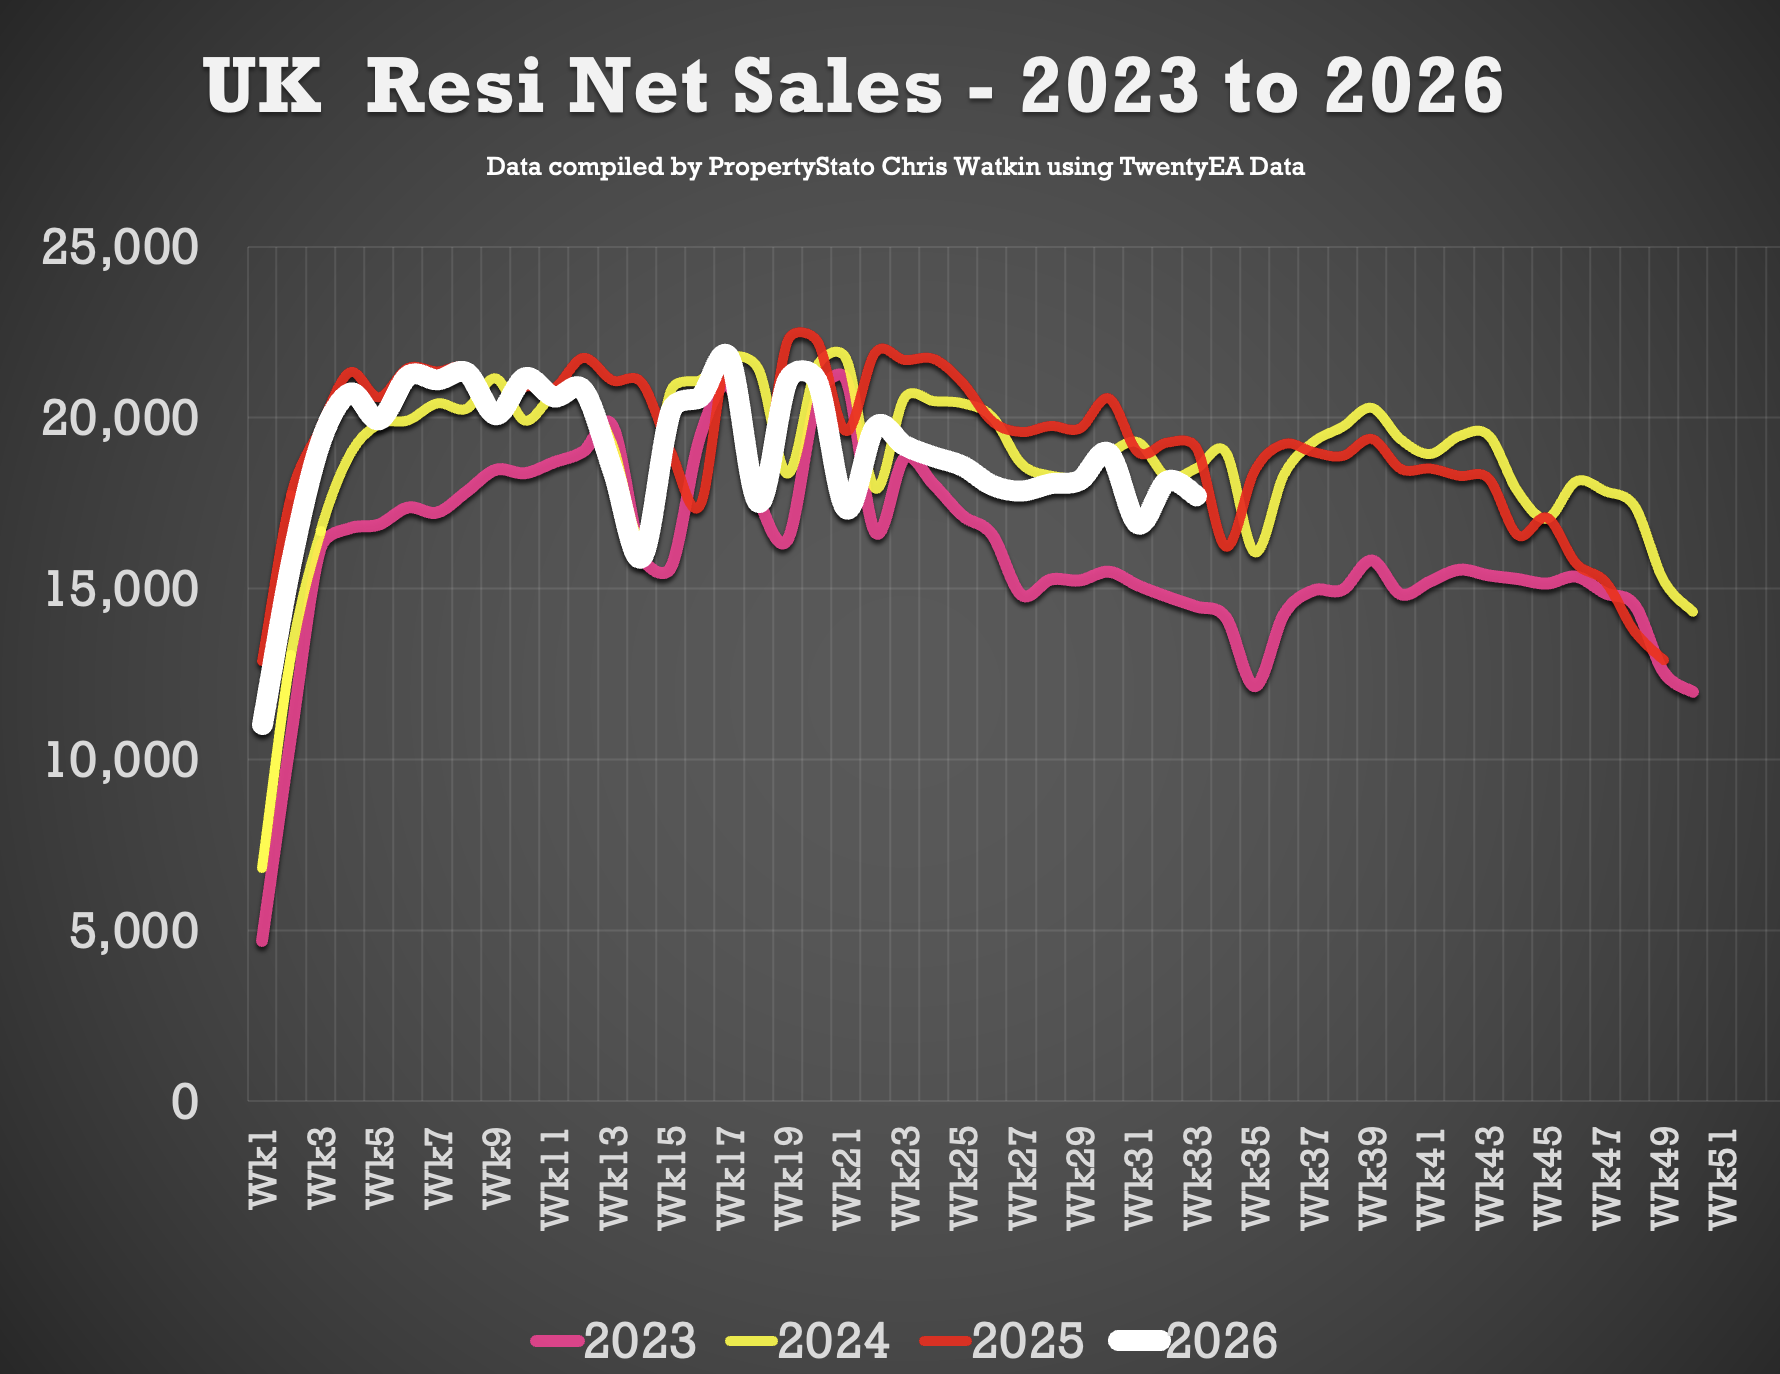
17.7k Net Sales (18.1k last week)
10 year Week 33 average: 19.1k.
Weekly average for 2026: 19k.
Year to Date
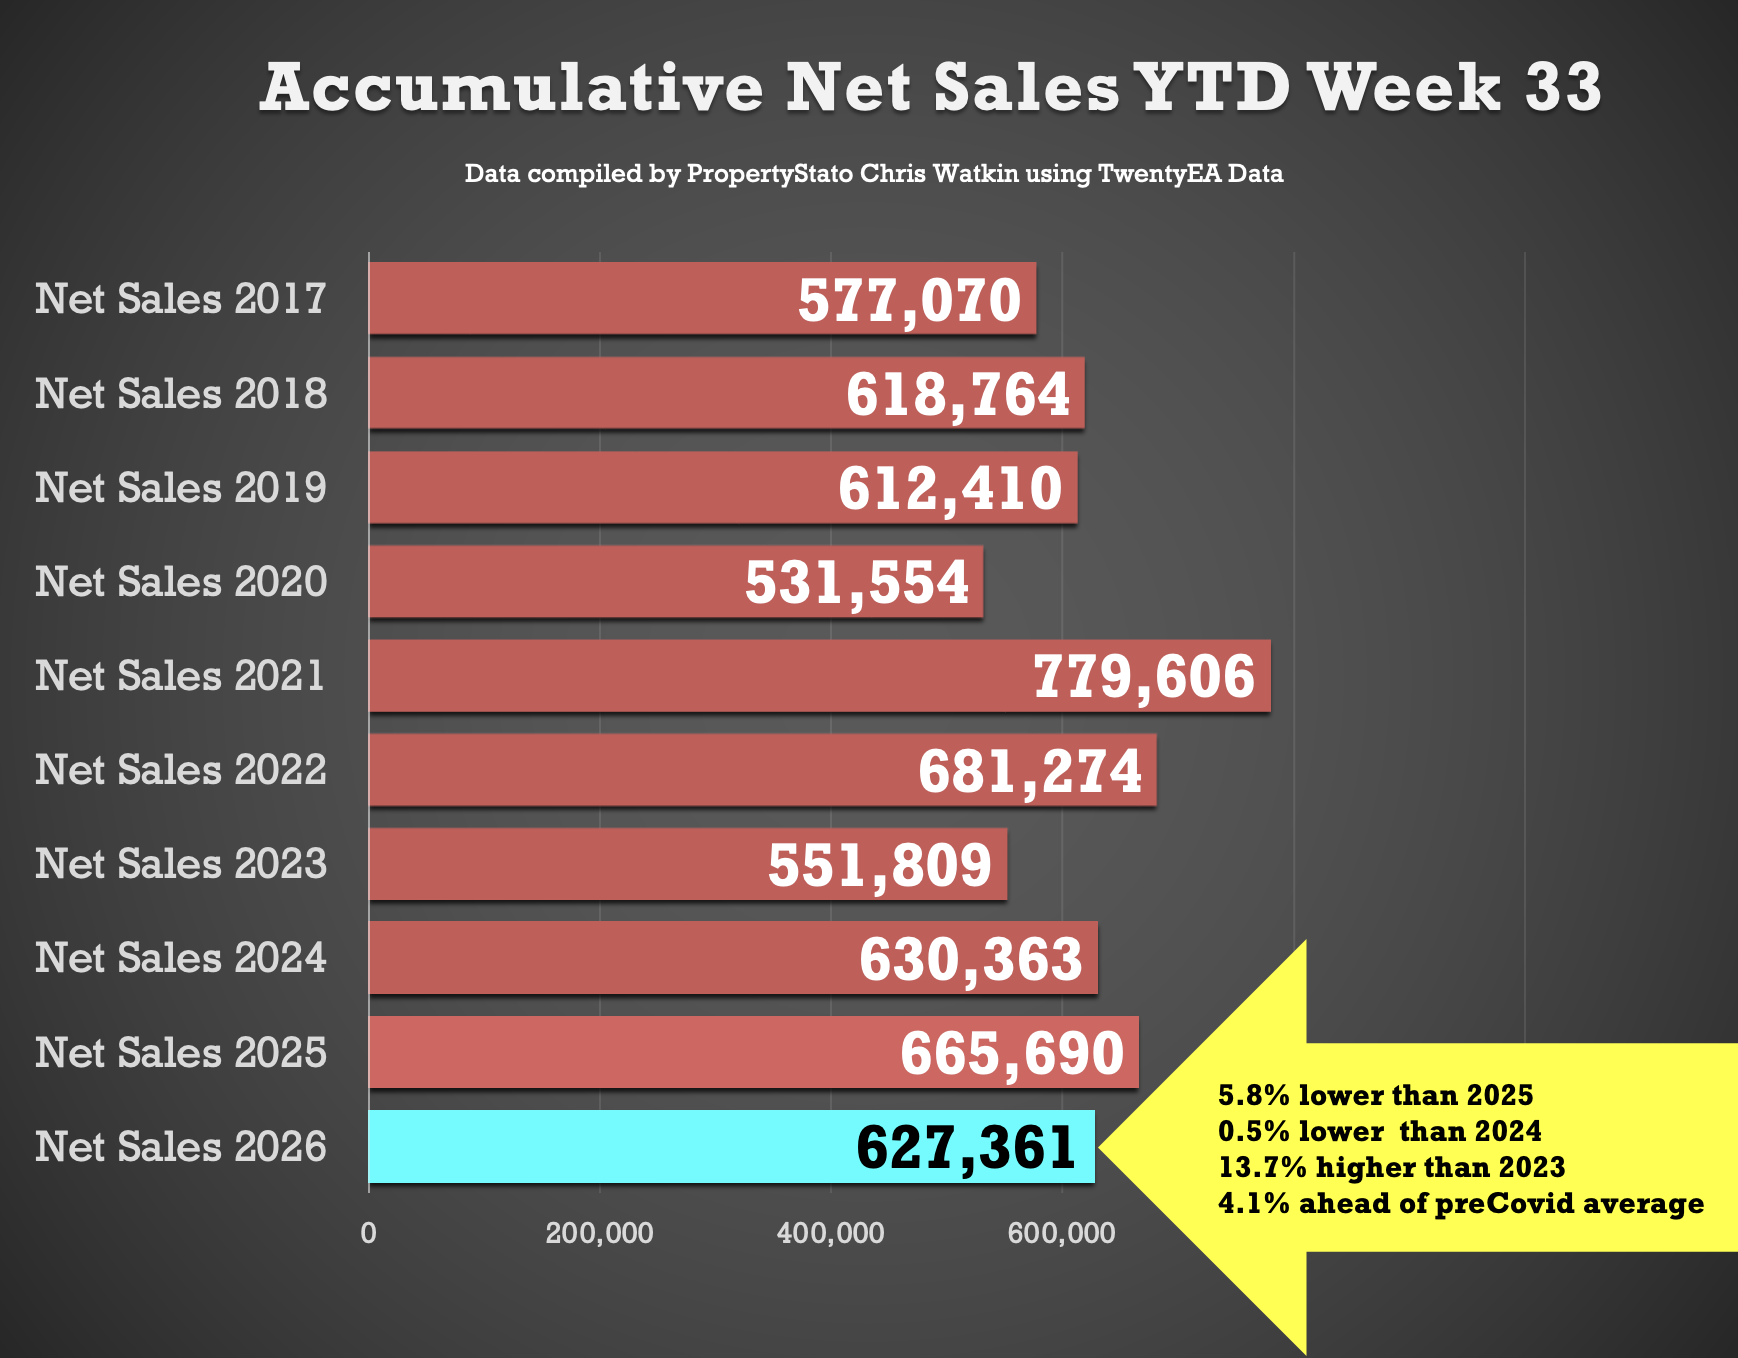
627k UK net home sales YTD
5.8% lower than 2025 (666k),
0.5% lower than 2024 (639k),
13.7% ahead of 2023 (552k)
4.1% above the 2017–19 average (585k).
🟩 Exchanges & Withdrawals
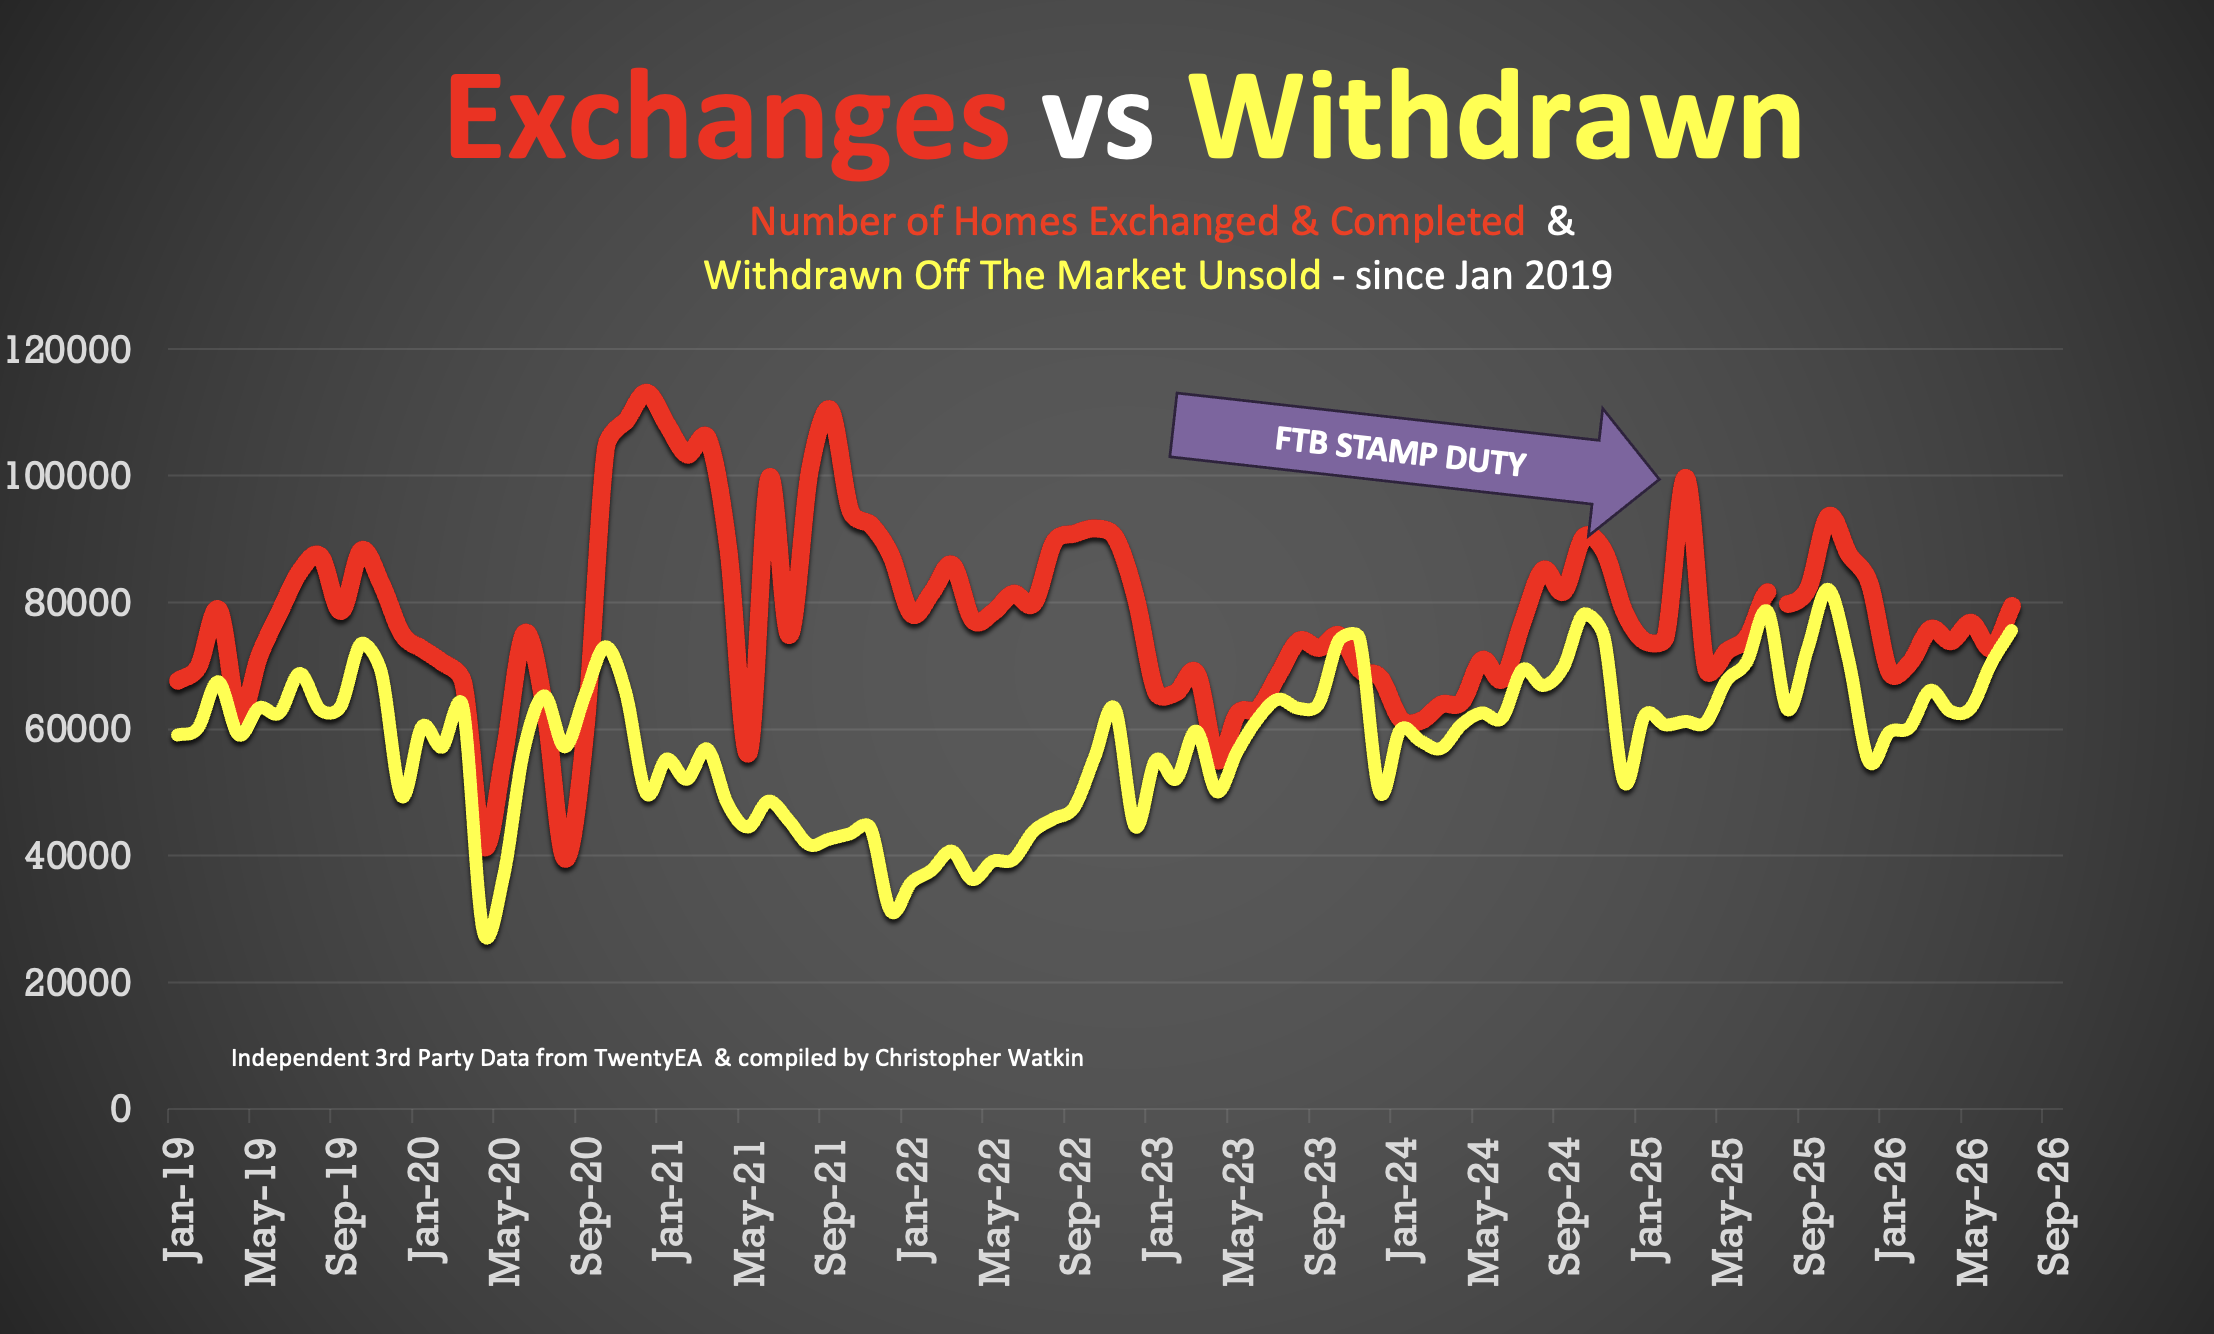
• 79.5k Exchanges in July 2026 (note this figure will change during August as more exchanges get reported).
• 75.6k Withdrawals in July 2026 – again, this figure will change as more July withdrawals come thru the system throughout August
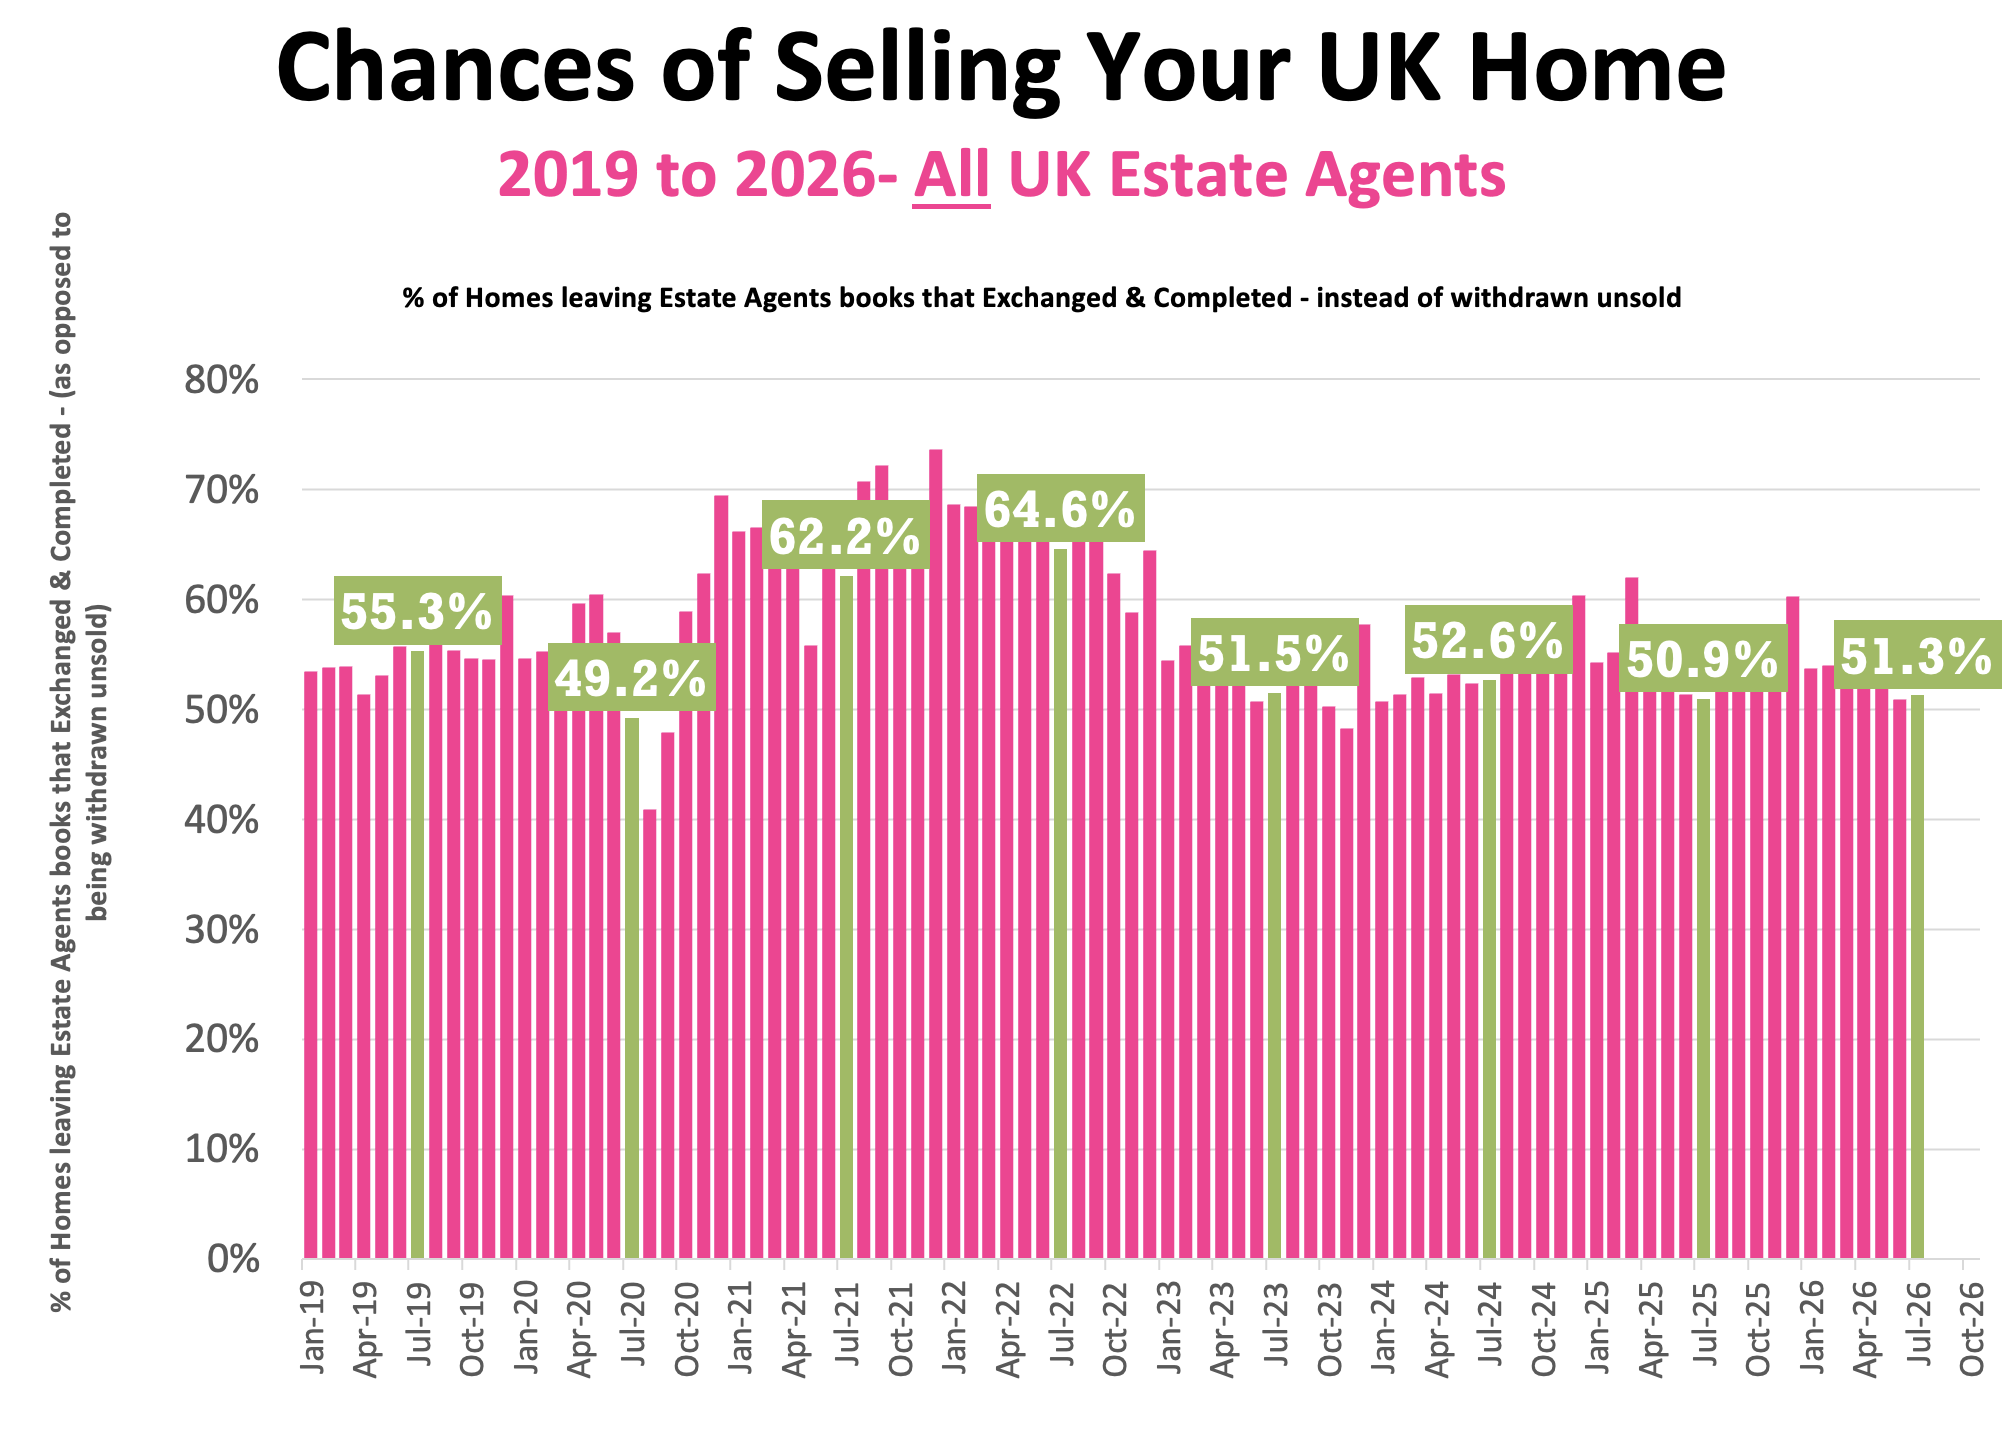
• Therefore, in July 2026, only 51.3% of homes that left agents’ books exchanged & completed in July (the rest – 49% withdrew, unsold)
• 57.6% is the 7 year average exchange to listings ratio (which includes the crazy years post lockdown 18 months).
Additional info …
🟥 Price Reductions
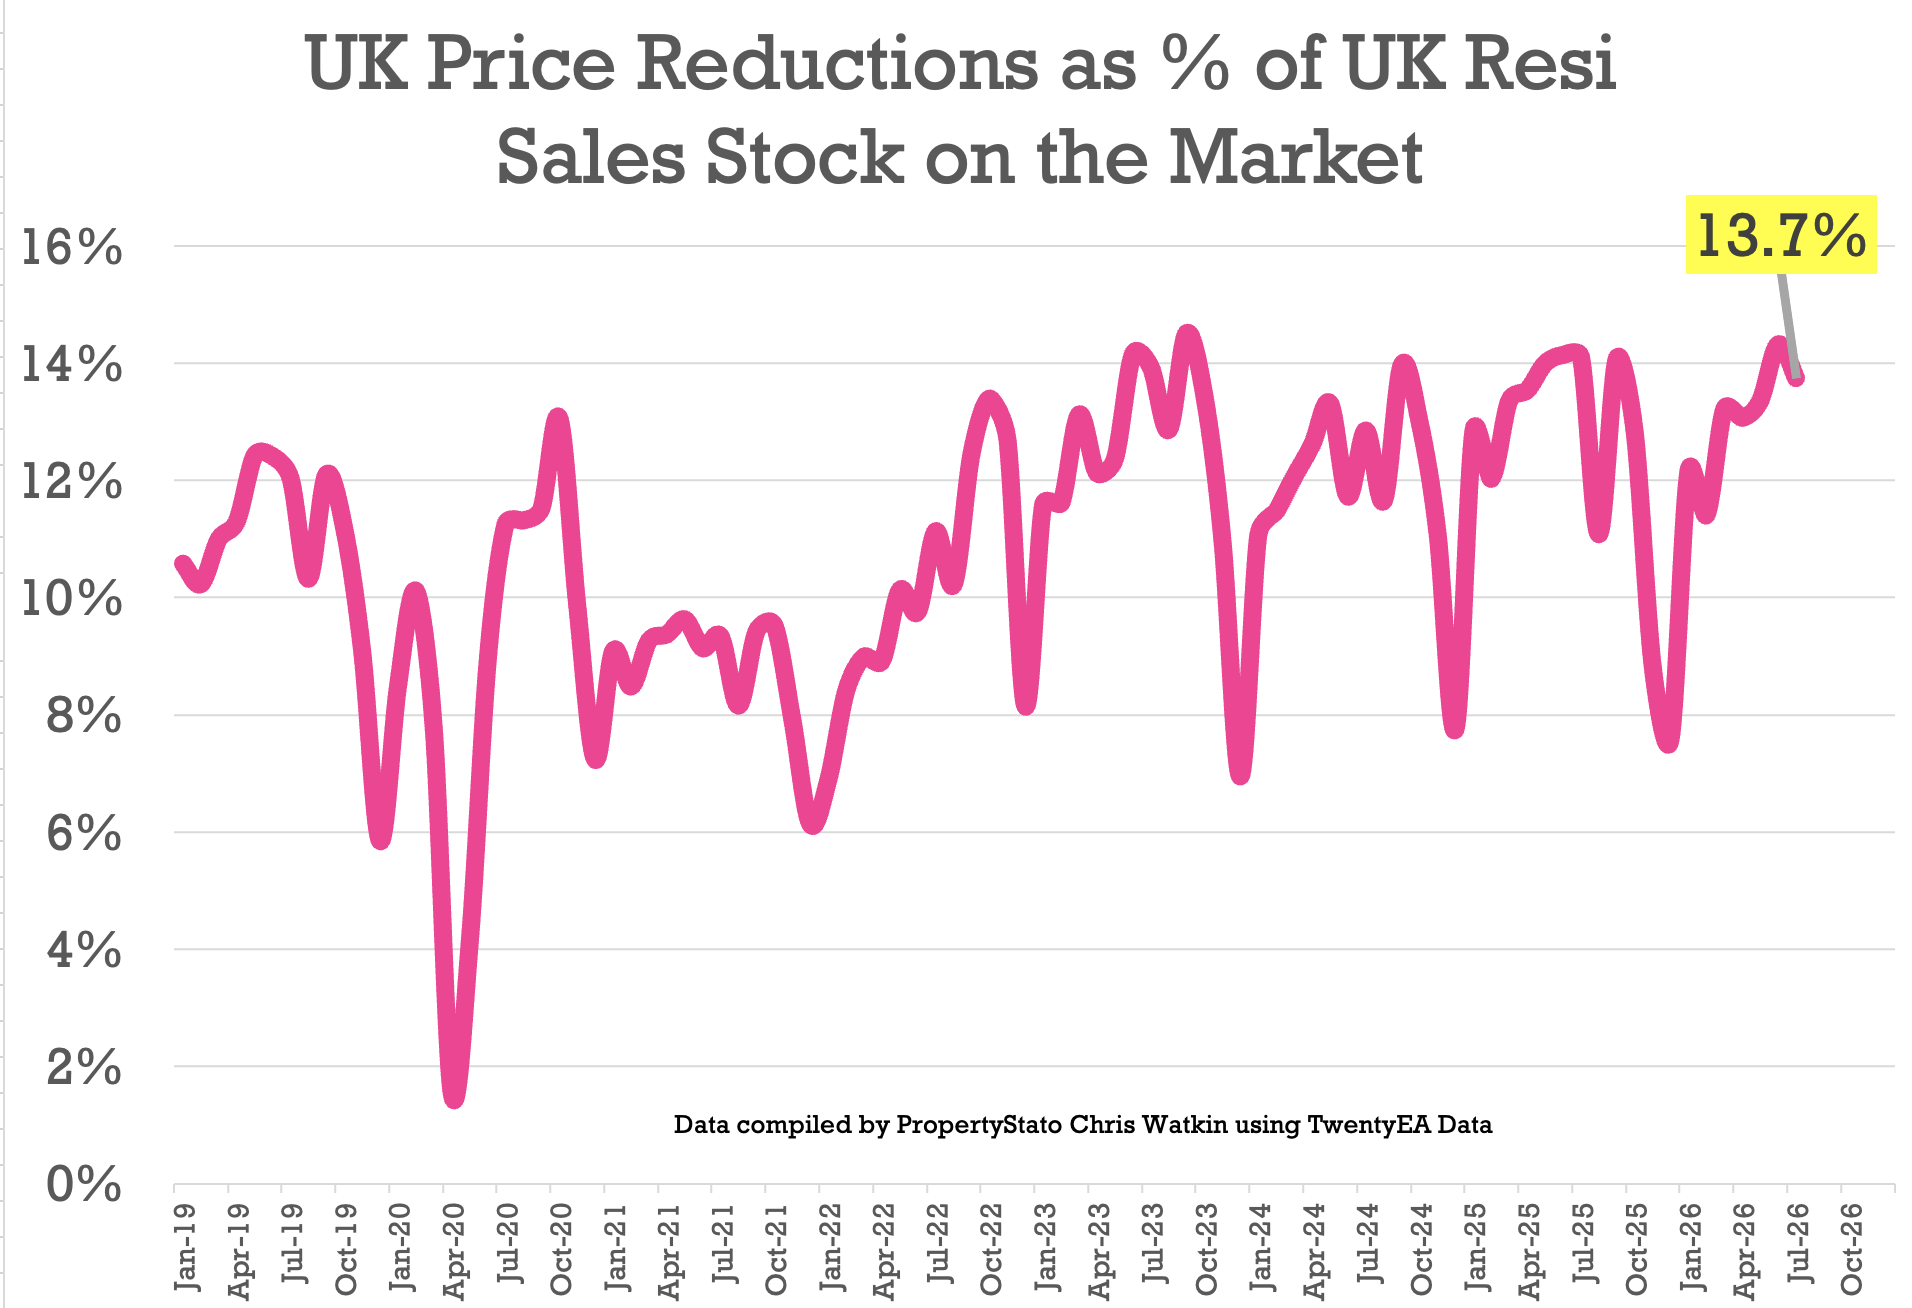
• 23.3k reductions this week on 767k UK homes for sale
• 13.7% of UK homes for sale were reduced in July (down from 14.3% in June)
• 2026 YTD average 13%, versus the 6-year long-term average of 11.2%.
🟥 Price Difference between Asking Price of Listings & Asking Price of those Homes that go Sold stc
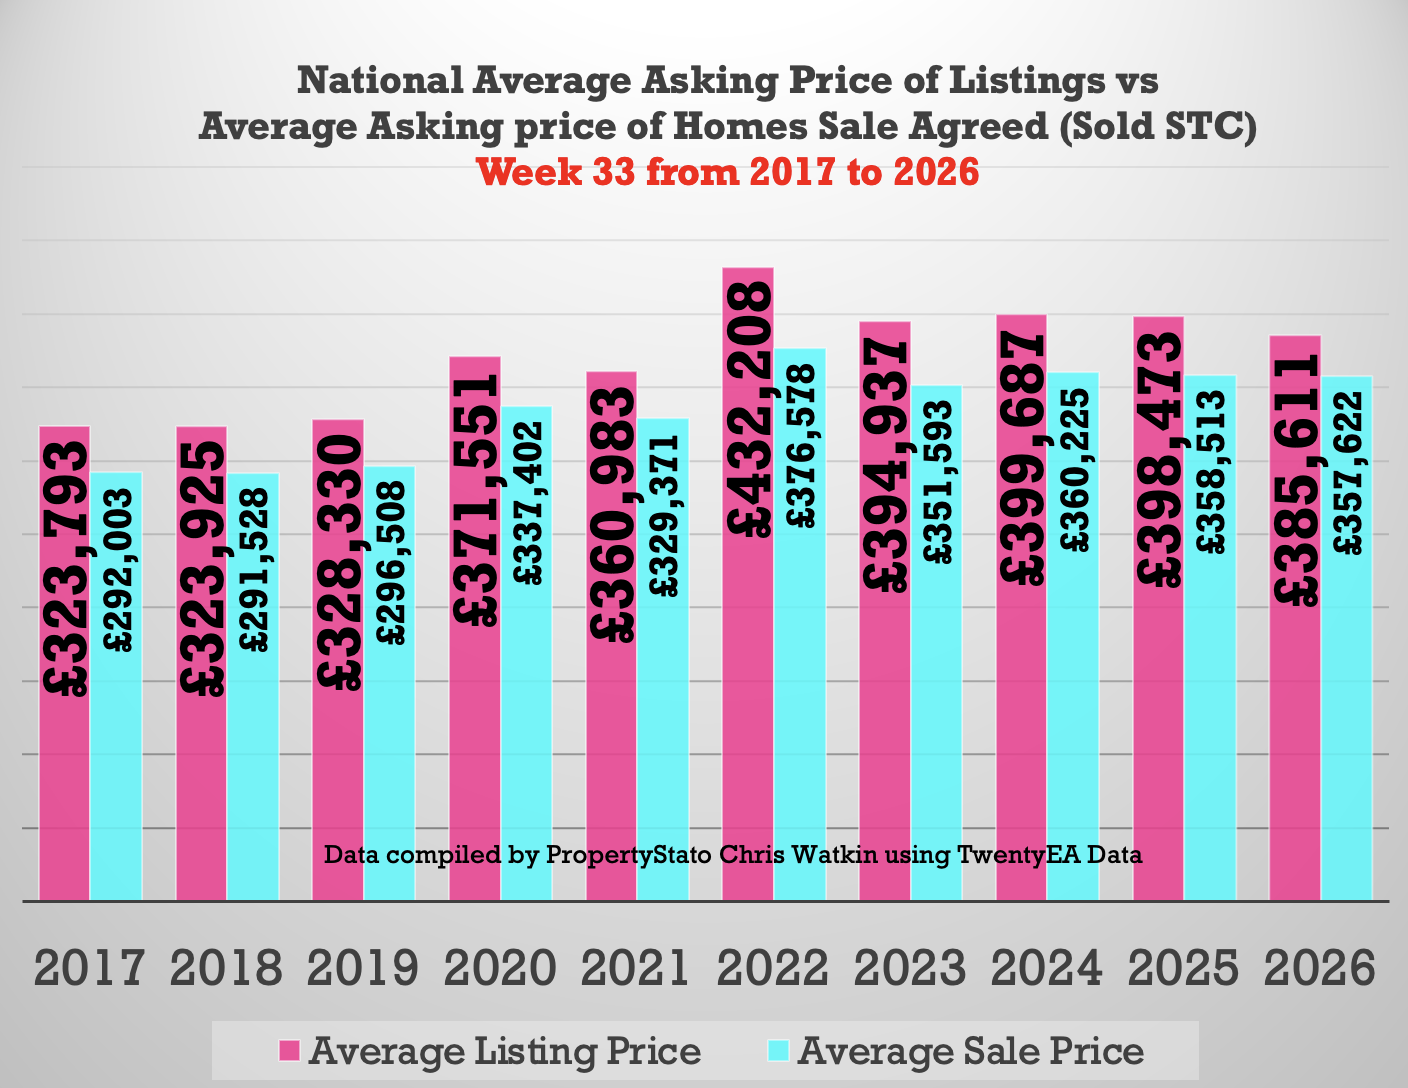
• 7.8% difference (long term 10 year average is 16% to 17%). (£385k ave Listing Ave Asking price vs £358k Sale Agreed ave Asking price).
🟥 Sell-Through Rate
• 14.2% of homes on agents’ books went SSTC in July ’26 (compared to 13.8% in June ’26).
• Pre-Covid average: 15.5%.
🟥 Sale Fall-Thrus
• Fall-thru rate 23.9%
• Decade average: 24.5%
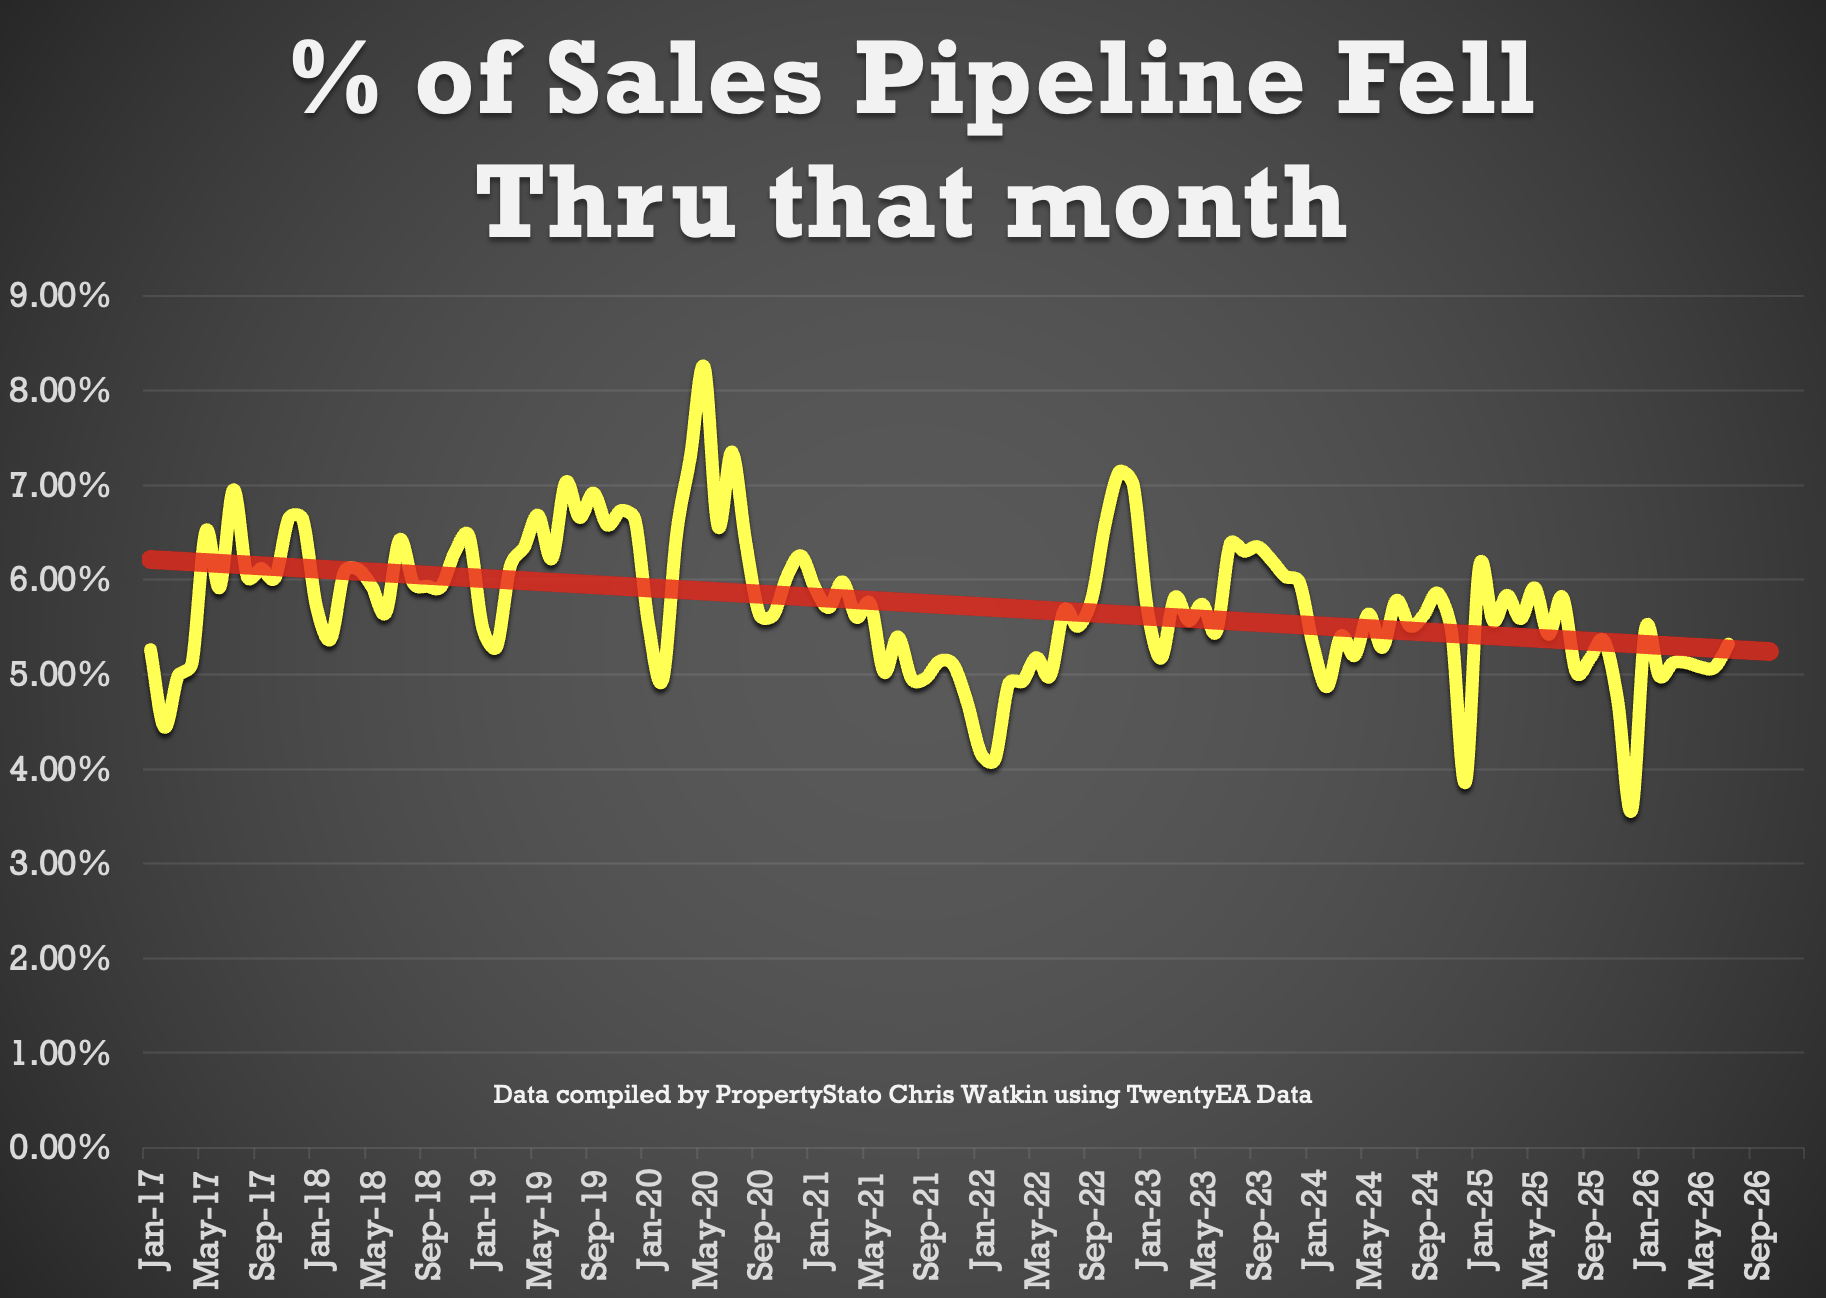
• 5.32% of homes sold STC fell thru in July 2026. The 2025 average of 5.3% and the 10 year average of 5.8%.
🟥 Stock Levels
• 767k homes on the market on the 1st of August ’26 (760k the month before and 763k 12 months ago)
• 487k homes in agent’s sales pipeline on the 1st August 2026, lower than 12 months ago on 1st August ’25 (508k). Graph 41 Graph 42
🟥 House Prices (£/sq.ft)
• July ’26 agreed sales averaged £345.41 per sq.ft. 1.2% higher than 12 months ago (£341.43) and 11.9% than 5 years ago (£308.60). The £/sqft at sale agreed matches the HM Land Registry Index with a 98% accuracy, 5 months in advance. That is why it is so important. Graph 45
🟥 UK Rental Data
• Average Rent in Wk 33 – £1,792 pcm
• Average Rent in August 2026 – £1,795 pcm
• Average Rent in August 2025 – £1,800 pcm
• Average Rent in August 2021 – £1,394 pcm
• Average Rent in YTD 2026 – £1,765 pcm
• 323k UK Rental Stock available to rent in August 26 (319k in August 2025)
• New Rental Properties coming onto the market in August 2026 – 135,928. (128,821 in July 2025 & 111,080 in July 2022)
🟥 Local Focus this week in the Show
Bath