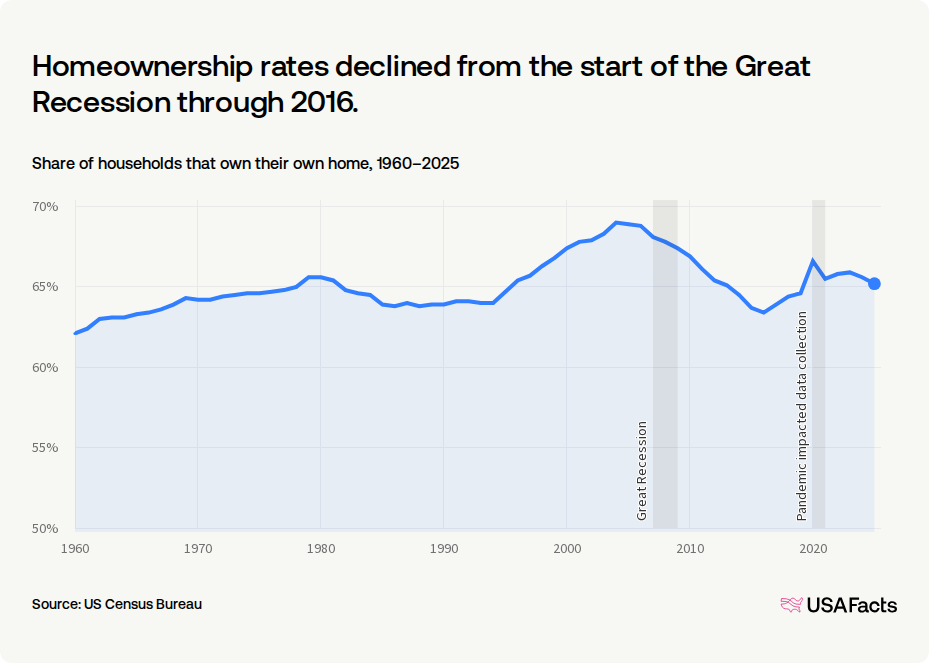
The homeownership rate in the US was 65.2% in 2025. That means about 2 in 3 households owned their home while the remainder rented.
65.2%
of households owned their home in 2025
2 in 3
households owned their home in 2025
Homeownership rates declined from the start of the Great Recession through 2016.
Share of households that own their own home, 1960–2025
How do homeownership rates vary across rural and urban areas?
Homeownership is least common in urban areas.
Share of households that own their home, by urbanicity (1994–2025)
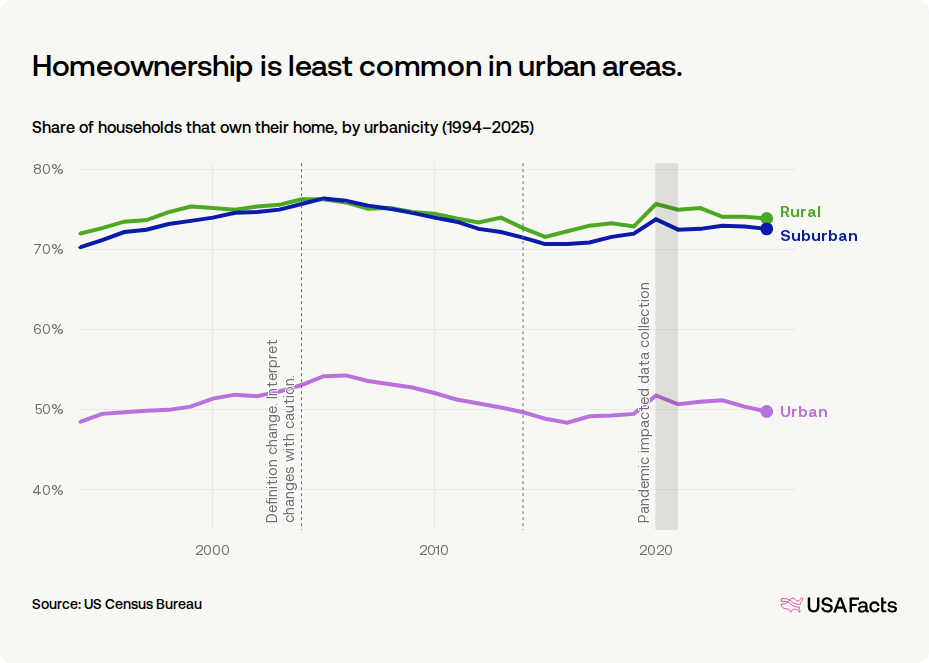
In 2025, homeownership rates were highest in rural areas, at 73.9%; 72.6% of households owned their homes in suburban areas, and 49.8% of households in urban areas. Since their respective housing-bubble highs, homeownership rates have dropped 3.8 percentage points in suburban areas, 4.5 points in urban areas, and 2.4 points in rural areas. In the shorter term, homeownership rates in all three area types have increased over the last five years.
The places defined as rural, suburban, or urban shift every 10 years or so as populations grow, fall, or move and how places become more or less economically interconnected. This means changes in the rate may be the result of, for example, a county’s classification changing from rural to suburban as opposed to a real change in homeownership.
Which states have the highest and lowest homeownership rates?
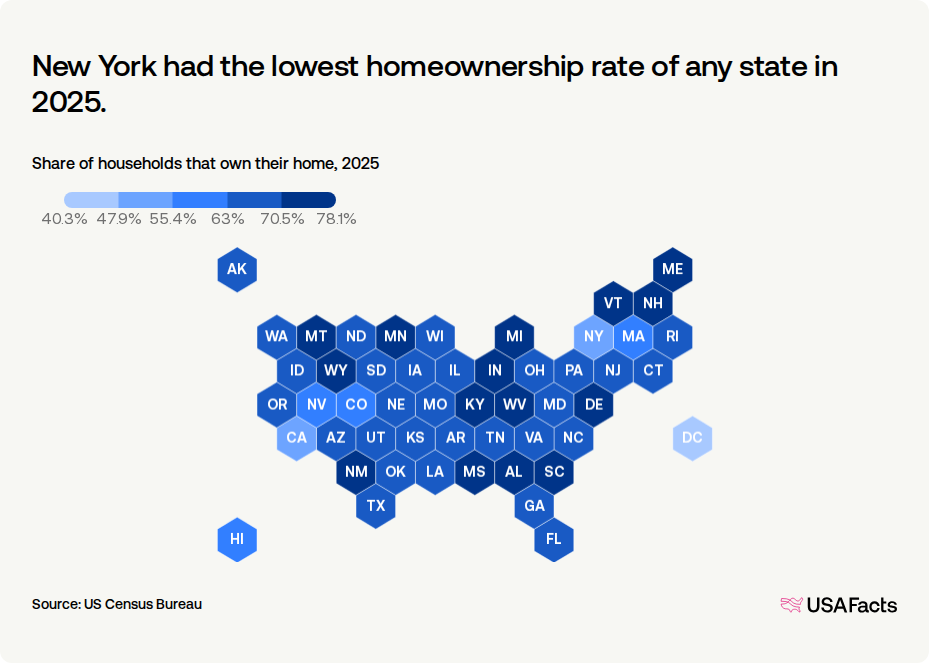
Homeownership rates ranged from a low of 52.2% in New York to 78.1% in West Virginia in 2025. Washington, DC’s rate is lower than all states at least partly because it’s entirely urban. Washington DC’s 2025 homeownership rate was 40.3%.
New York had the lowest homeownership rate of any state in 2025.
Share of households that own their home, 2025