
Is This the Worst Fall of the Indian Rupee in History? Here Is What the Data Actually Shows – Fact Crescendo Sri Lanka English
Subscribe to our WhatsApp Channel
When the Indian Rupee hit 96.82 against the US Dollar in May 2026, headlines declared it one of the worst depreciations in the currency’s history. Social media posts and some mainstream reports amplified the alarm, attributing the fall primarily to rising crude oil prices from Middle East conflicts and a large withdrawal of foreign investment from India. But is this truly the worst fall in history? The answer depends entirely on how you measure it.
Social Media Posts :
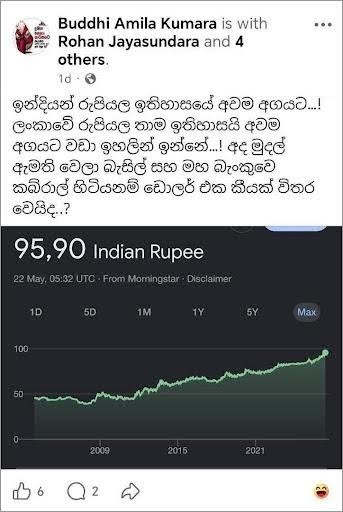
Posts circulated on social media and were reported by mainstream outlets claiming that the Indian Rupee had suffered one of the worst depreciations in its history against the US Dollar, mainly caused by rising crude oil prices due to Middle East conflicts and concerns over increased US trade tariffs leading to a large withdrawal of foreign investment from India.

Similar posts also circulated widely in the following forms:

We examined the facts surrounding the viral claims about the Indian Rupee’s depreciation.
Explainer :
During the first five months of 2026, the Indian Rupee depreciated by 7.04%, making it one of the weakest-performing major currencies in Asia during this period. Further details are available here, and here.
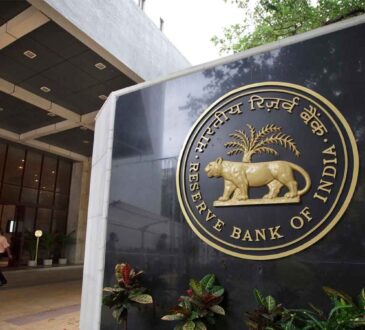
On 20 May 2026, during intraday trading, the Rupee crossed 96.90 before the Reserve Bank of India intervened through state-owned banks, selling a large volume of dollars to stabilize the currency. By market close, the Rupee recovered to 96.82. The following day, Thursday 21 May, strong central bank intervention pushed it further to 96.20. Further details are available here, here, and here.
Depreciation of the Indian Rupee: Key Metrics
| Metric | Value | Notes |
|---|---|---|
| Nominal All-Time Low (20 May 2026) | Rs.96.82 / $ | Official closing rate on that day |
| 2026 Year-to-Date Decline (Jan to May) | 7.04% | From Rs.89.87 on 1 January to Rs.96.20 by 21 May |
| Depreciation in May 2026 alone | 4.5% | From around Rs.92 at the start of May to Rs.96.82 within 20 days |
| Decline since the Iran conflict escalation (late February 2026) | 5.5% | Total depreciation in the 12 weeks since Middle East tensions and rising oil prices began |
| Full-year decline for 2025 | 4.9% | The worst annual decline for the Rupee since 2022 |
| Full-year decline for 2024 | 2.9% | A year in which global markets remained relatively stable |
To determine whether the 2026 depreciation is the largest in history, it is important to examine not only the nominal exchange rate level (96.82) but also the percentage decline in comparative terms. In other words, by what percentage has the Rupee fallen relative to its previous level?
Historical Comparison of Indian Rupee Depreciation
| Period | INR Level | % Decline | Key Driver | Severity |
|---|---|---|---|---|
| 2026 Year-to-Date (Jan to May) | Rs.89.87 to Rs.96.82 | -7.04% | Iran war, crude oil surge, foreign portfolio outflows | HIGH |
| 2025 Full Year | Rs.85.6 to Rs.90.95 | -4.9% | US tariffs, FII exits, trade uncertainty | Elevated |
| 2022 Full Year | ~Rs.74 to Rs.82.7 | ~-10% | US Federal Reserve rate hikes, US dollar surge | SEVERE |
| 2011 Full Year | ~Rs.44 to Rs.53+ | ~-18% | European debt crisis, current account deficit spike, capital flight | SEVERE |
| 2013 Taper Tantrum | ~Rs.55.40 to Rs.68.85 | ~-20% | Fed tapering signal; CAD 4.8% of GDP; Rupee labelled among “Fragile Five” | WORST ON RECORD |
| 1991 Liberalization | Rs.17.5 to Rs.26+ | ~-49% over 2 years | Balance of payments crisis, government-managed devaluation | Structural / Managed |
The 2026 depreciation of 7.04% is notably lower than the 20% fall recorded during the 2013 Taper Tantrum or the 10% decline in 2022. The 96.82 level recorded in May 2026 marks a new nominal all-time low for the Rupee, but in percentage terms, the current fall is not the most severe in history. That said, the 7.04% decline recorded in the first five months of 2026 is the highest rate of depreciation since 2022. Whether the trend continues or reverses by year-end remains to be seen. Further details are available here, here, and here.
The Long-Term Structural Depreciation of the Indian Rupee
Because India has consistently maintained higher inflation than the United States, the Rupee has undergone a long-term structural depreciation against the dollar over the past seven decades. The exchange rate stood at Rs.3.3 per dollar in 1947 and now reached Rs.97. As a result, recording a new nominal low each year has become routine. Since economic liberalization in 1991, when the rate was Rs.17 per dollar, the Rupee has moved to around Rs.90 by 2025, reflecting an average annual depreciation of approximately 4.5% over 34 years. More details are available here. This is why examining the percentage change over a defined period provides a more accurate picture than focusing on the nominal exchange rate level alone.
Overall Economic Pressure: Then and Now
It is also important to assess the broader economic conditions alongside currency depreciation.
| Indicator | 2013 Crisis (Worst on Record) | 2022 Situation | 2026 (Year-to-Date) |
|---|---|---|---|
| Rupee depreciation (%) | ~20% | ~10% | ~7% |
| Current Account Deficit (CAD) | Severe (4.8% of GDP) | Moderate (~2.5% of GDP) | Manageable (~2.0 to 2.5% of GDP) |
| Inflation (CPI) | 9% to 10% (Very high) | ~7% (Moderate) | ~4.9% (Within RBI target of 2% to 6%) |
| International risk rating | “Fragile Five” (among world’s most vulnerable economies) | High stress | No systemic risk rating assigned |
| Cause of shock | Both domestic and global factors | Mainly US Federal Reserve policy | External factors: Iran conflict and rising oil prices |
| Central bank reserve depletion | Moderate | ~USD 70 billion outflow | Under some pressure; reserves at ~USD 688.8 billion as of mid-May |
| Government and central bank response | Raised USD 34 billion through NRI emergency bonds | Strong market intervention releasing dollars to support Rupee | Considering interest rate adjustments, currency swaps, and bond measures |
Although the Rupee’s nominal level of 96.82 in 2026 sparked significant public debate, India’s overall economic position remains relatively stable. More details are available here and here.
However, the Indian Rupee became Asia’s worst-performing major currency in both 2025 and 2026. It crossed the Rs.90 mark in late February 2026, surpassed Rs.95 for the first time by end of March and crossed Rs.96 for the first time in history in May 2026. Since the start of the Iran conflict in late February, the total depreciation has been approximately 5.5%. Further details are available here and here.
A 7% decline within roughly five months represents the fastest fall in the Indian Rupee since 2022. Global crude oil prices crossing USD 100 per barrel have added significant pressure: every USD 10 rise in oil prices widens India’s current account deficit by approximately USD 12 to 15 billion annually. The Rupee declining in five out of seven consecutive trading sessions indicates a disruption in normal market dynamics, requiring the Reserve Bank of India to intervene directly in the foreign exchange market.
Summary Verdict
| Measure | Record Holder | 2026 Status | Verdict |
|---|---|---|---|
| Nominal All-Time Low | 2026: Rs.96.82 | On 20 May 2026, the Rupee hit Rs.96.82 | TRUE |
| Worst Annual Percentage Decline | 2013: ~20% | Year-to-date 2026 stands at ~7%, well below 2013 levels | FALSE |
| Worst Percentage Decline Since 2022 | 2022: ~10% | 2026 at ~7% is approaching but still below the 2022 figure | PARTIAL |
| Macro Stress Level | 2013: Among world’s five most vulnerable; CAD at 4.8% of GDP | Externally driven; CAD ~2.5% of GDP | NOT COMPARABLE |
| Speed of Decline | 2013: Even faster at peak | 2026 pace since Iran conflict is a legitimate concern | LEGITIMATE CONCERN |
Although the Rupee fell to a nominal record low of Rs.96.82 in May 2026, in percentage terms this decline is lower than the 20% drop recorded in 2013. According to the Reserve Bank of India’s May economic report, consumer price inflation remains at a controlled 4.9%, within the RBI’s target band of 2% to 6%. Economic analysis also indicates that while oil import costs have risen due to the Middle East conflict, India’s services sector export earnings remain strong, keeping the current account deficit at a manageable 2% to 2.5% of GDP. As of mid-May 2026, the RBI holds foreign exchange reserves of approximately USD 688.8 billion. Further details are available here, here, here, here, and here.
Join us to learn more about our fact-check investigations.
Facebook | Twitter | Instagram | Google News | TikTok

Title: Is This the Worst Fall of the Indian Rupee in History? Here Is What the Data Actually Shows
Fact Check By: B.P. Hansani
Result: Insight


