The Stock Market Is Doing Something for Only the Second Time in 155 Years. Here’s What History Says Could Come Next.

Usually, when something happens in the stock market only a few times over decades, it’s either really good or really bad; there’s not much in between. In this case, the S&P 500 (^GSPC -0.36%) index is doing something that’s only happened twice since 1871.
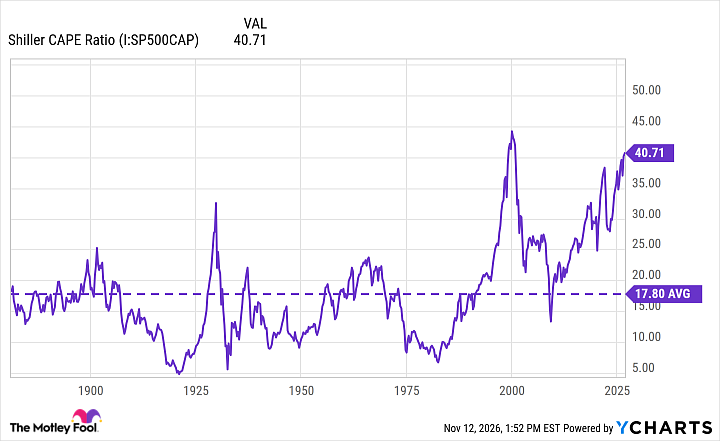
The Shiller price-to-earnings (P/E) ratio is a measuring stick that helps put the S&P 500’s valuation in perspective. It compares current prices to the index’s average inflation-adjusted profits over the past 10 years. The S&P 500 didn’t exist in 1871, but economists have pulled historical data to show what it would’ve been.
Right now, the Shiller P/E ratio is 40.7, which is, to put it lightly, very high. The only other time the ratio has hovered above 40 was during the dot-com bubble. Those aren’t exactly encouraging words, but will the results be different this time around?

Image source: Getty Images.
How the current day compares to the days of the dot-com bubble
The dot-com bubble — which began in the late 1990s before bursting in 2000 — was a case of investors getting a little too excited about internet start-ups as the internet became more mainstream. Companies with nothing more than a functioning website and charming founders were going public at wild valuations. Many had no meaningful revenue, let alone profitability.
At its peak, in November 1999, the Shiller P/E ratio reached 44.2.
Shiller CAPE Ratio data by YCharts
Today, the index’s high valuation comes from the ongoing artificial intelligence boom, which has driven many tech valuations to unprecedented levels. At the time of writing, nine of the world’s 10 most valuable public companies are tech companies, with Meta Platforms being the least valuable at $1.6 trillion.
The flood of money pouring into mega-cap tech stocks is the reason the index has nearly doubled since the start of 2023, but it’s also what has pushed the S&P 500’s valuations to levels we haven’t seen since the dot-com bubble. One major difference this time, though, is that the companies driving this surge are real businesses making real billions.
Today’s Change
(-0.36%) -26.46
Index Level
7,390.13
Key Data Points
Day’s Range
7,390.13 – 7,415.37
52wk Range
6,316.91 – 7,844.52
What comes next?
There’s no way to know how the market will move in the short term, but we know one thing from the stock market’s history: Bear markets and crashes are inevitable parts of its cycle. This isn’t to say one of those is imminent (again, we can’t predict the market), just that they will happen.
The good news is that regardless of what happens, the S&P 500 has solidified itself as one of the best investments you can make for the long haul. Since the present-day S&P 500 was introduced in 1957, it has experienced 12 bear markets and bounced back from each. During the dot-com crash, the S&P 500 plunged by 49%, yet it’s up 880% as of Nov. 12.
Instead of trying to guess what will happen, focus on business as usual and trust the long-term vision, even if the S&P 500 pulls back (which it eventually will).
Where to invest $1,000 right now
When our analyst team has a stock tip, it can pay to listen. After all, Stock Advisor’s total average return is 823%* — a market-crushing outperformance compared to 209% for the S&P 500.
They just revealed what they believe are the 10 best stocks for investors to buy right now, available when you join Stock Advisor.
*Stock Advisor returns as of November 17, 2026.