
The Stock Market Is on the Verge of Doing Something for the First Time in 155 Years, and History Is Crystal Clear on What It Could Mean for Investors
If you regularly tune in to financial news programming, you’re probably familiar with Wall Street analysts citing the price-to-earnings ratio (P/E) — either looking back over the previous 12 months or looking at earnings estimates for the next 12 — as a common way to value the S&P 500 (SNPINDEX: ^GSPC).
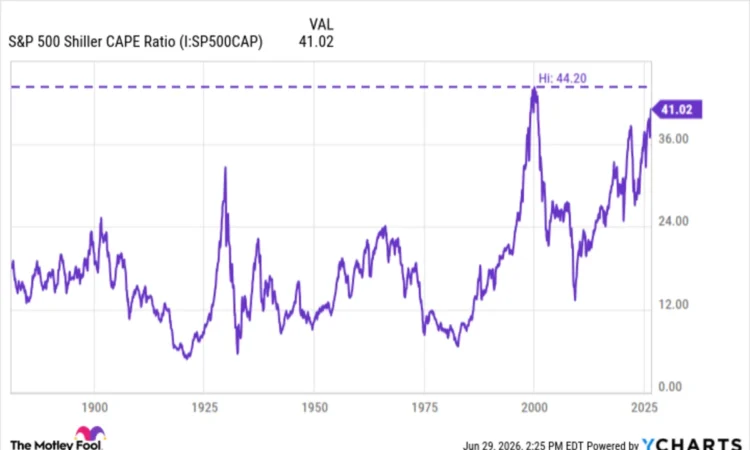
While these metrics are useful, I think the cyclically adjusted price-to-earnings (CAPE) ratio stands as one of the more insightful tools for assessing long-term stock market valuations. The CAPE ratio was developed to smooth out the volatility seen in single-year earnings figures. It’s calculated by taking the current price of the stock market relative to the average of earnings per share (EPS) over the prior 10 years. This approach better reveals whether stocks are trading at levels justified by companies’ financial performance, or if speculation has fueled prices to unsustainable extremes.
Missed Nvidia in 2009? This Rare Signal Is Flashing Again. In 2009, a “Double Down” signal flashed for a little-known chipmaker called Nvidia. For the first time in years, that same “Total Conviction” signal is flashing for a company 1/100th the size of Nvidia. Continue »
Overall, the CAPE ratio has been useful in highlighting cycles of overvaluation and undervaluation, helping shape investor outcomes along the way. At recent prices, the CAPE ratio sat at a reading of 41 — firmly in overvaluation territory. Let’s break down what this could signal and what warrants careful consideration.

What does the CAPE ratio measure, and why does it matter?
The CAPE ratio improves upon traditional valuation measures because it incorporates a decade of inflation-adjusted earnings data. By doing so, the CAPE ratio mitigates abnormalities from business cycle peaks and troughs, such as recessions, which often temporarily depress earnings, or booms, which inflate them.
As a result, the CAPE ratio provides a reliable gauge of whether the broader market is cheap or frothy relative to historical benchmarks. Moreover, its importance lies in its track record as a barometer of long-term returns. Long-term analysis of the CAPE ratio has uncovered that elevated readings, like those seen now, tend to precede prolonged periods of below-average market returns.
When has the CAPE ratio peaked in the past?
Broadly speaking, elevated CAPE ratios typically indicate that stock prices are decoupling from sustainable earnings growth. This is often propelled by a combination of technological or economic narratives, abundant liquidity, and widespread enthusiasm.


