

The average UK house price has risen by 231.1% since the turn of the century, with a typical home now costing £272,188 compared with £82,197 in June 2000, according to new research. Even after accounting for inflation, house prices have increased by 69.4%, highlighting how much the cost of buying a property has changed over the past 26 years.
The figures come from a study by consumer finance guide Låneguiden.se, which analysed average house prices across UK regions and local authority areas in England and Wales. Researchers compared Land Registry house price data for June 2000 and June 2026, calculating both the headline price increase and the rise after adjusting for inflation using the Consumer Price Index (CPI).
The findings show that house price growth has varied considerably across the country, with some areas experiencing increases far above the national average. Manchester recorded the largest rise among local authorities in England and Wales, while several areas in the South East saw some of the smallest increases.
MORE ON PROPERTY
The price surge
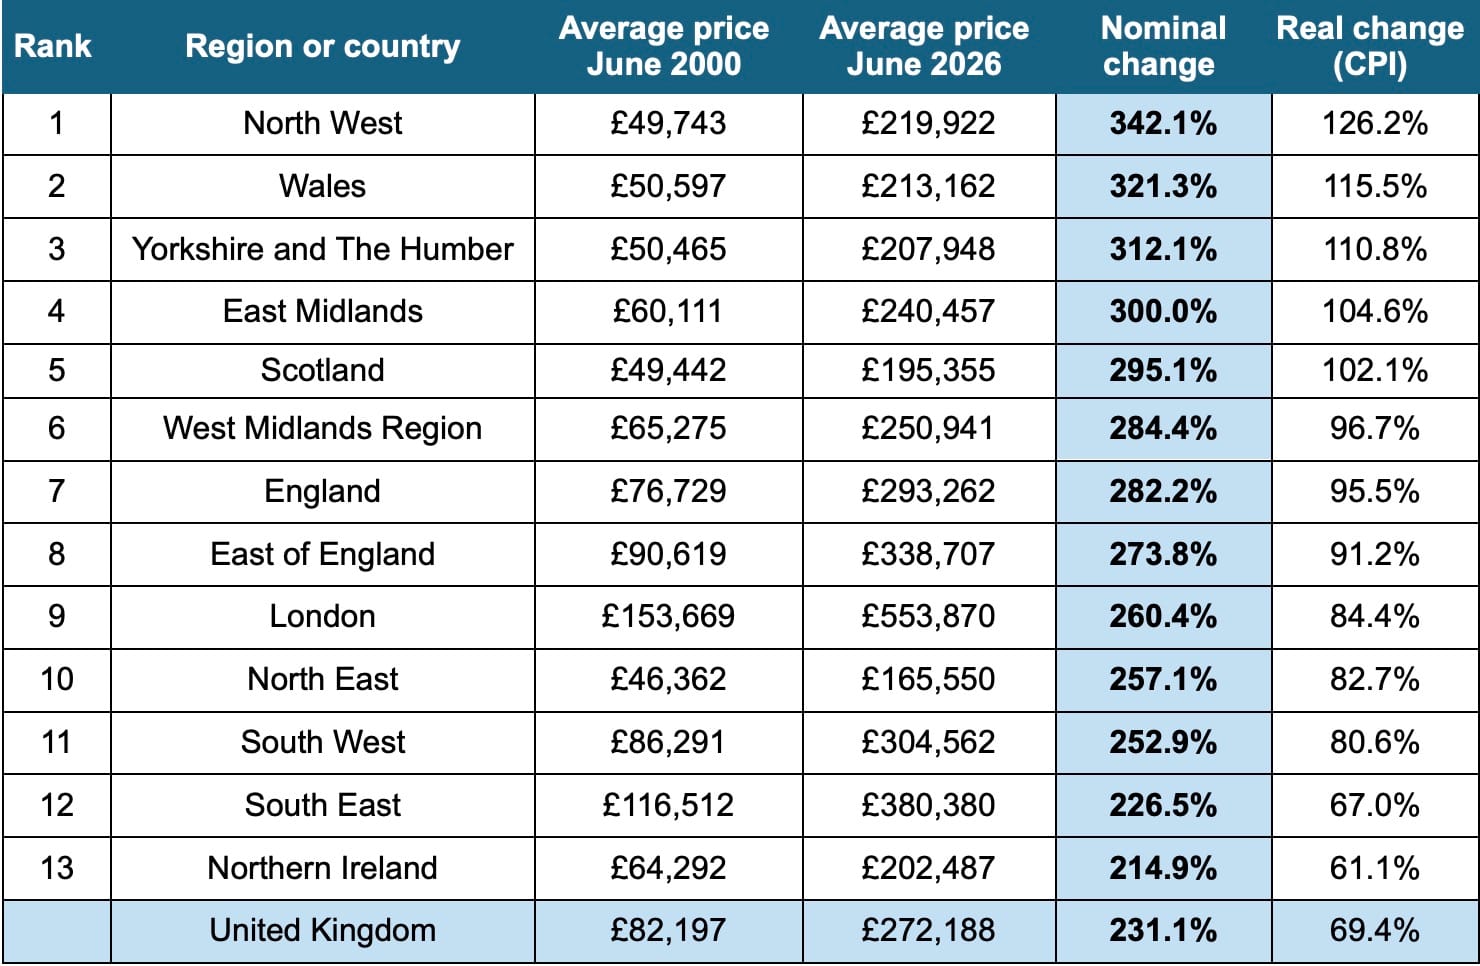
The national average house price rose from £82,197 in June 2000 to £272,188 in June 2026, representing a nominal increase (the raw, unadjusted rise in the cash price of a property over time) of 231.1%. After inflation is taken into account, the increase stands at 69.4%, according to the study.
London remains the most expensive region in the figures, with an average house price of £553,870 in June 2026, up from £153,669 in June 2000. That represents a rise of 260.4% in nominal terms and 84.4% after accounting for inflation.
The South East recorded an average house price of £380,380, compared with £116,512 at the start of the period. Despite remaining one of the UK’s most expensive regions, its nominal increase of 226.5% was below the national figure.
The East of England also remained above the national average for property prices, with homes costing an average of £338,707 in June 2026. This was a nominal increase of 273.8% from £90,619 in June 2000.
READ MORE
Regional price winners
The North West recorded the largest regional increase, with average house prices climbing by 342.1% from £49,743 in June 2000 to £219,922 in June 2026. After adjusting for inflation, the increase was 126.2%.
Wales followed with a nominal rise of 321.3%, taking average house prices from £50,597 to £213,162. Yorkshire and the Humber ranked third, with prices increasing by 312.1% to £207,948.
The East Midlands saw average prices rise by 300% to £240,457, while Scotland recorded an increase of 295.1%, taking its average to £195,355.
At the other end of the regional rankings, Northern Ireland recorded the smallest nominal increase, at 214.9%, with average prices rising from £64,292 to £202,487. The South East had the next-smallest increase, at 226.5%.
Among local authority areas in England and Wales, Manchester experienced the steepest increase, with average house prices rising by 511.7% between June 2000 and June 2026. Prices climbed from £41,071 to £251,250, representing a real increase of 213% after inflation.
Salford ranked second, with prices increasing by 449.8% from £42,180 to £231,890. Oldham came third, recording a nominal rise of 426.5%.
Bolsover in Derbyshire ranked fourth, with average prices climbing from £37,493 to £188,025, an increase of 401.5%. Rhondda Cynon Taf in Wales completed the top five, with prices rising by 393.3% from £33,964 to £167,559.
The figures show that some areas where homes remain cheaper than in London and the South East have nevertheless experienced much faster percentage growth over the period.
Areas with slower growth
Surrey Heath recorded the smallest nominal increase among local authority areas in England and Wales, at 178.3%. Average prices rose over the period, but the increase was considerably below the national figure of 231.1%.
Other areas with relatively modest increases included Tandridge, where prices rose by 180.2%, Woking at 188.1% and Guildford at 191.2%. All three are in Surrey.
Tower Hamlets and Hammersmith and Fulham in Greater London also featured among the areas with the lowest nominal increases, at 184.7% and 184.9% respectively.
However, a smaller percentage increase does not necessarily mean a property is affordable. Starting prices, current local prices, mortgage costs and household incomes all influence how accessible homeownership is for buyers.
Jakob Thorselius, from the Låneguiden.se, said: “The average UK house price has risen around 3.3 times in the first quarter of the 21st century, and with inflation figures not keeping in line, the figures depict the challenges homebuyers face in today’s market.
“Interestingly, among local authority areas in England and Wales, our findings revealed that it is North West areas that have seen the greatest increases, while the South East has seen the lowest. This somewhat turns the assumption on its head that the North is more affordable. While prices are lower in many top-ranking areas, the rate at which prices are increasing is almost triple in some locations.”


