

The decade of cheap money feels like a long-distant memory after a seemingly never-ending parade of black-swan events.
 The latest unrest in the Middle East has quashed early-year optimism that interest rates would fall from their elevated levels to around 3.5% in 2026, particularly after the Bank of England held rates at 3.75% last month amid ongoing inflation risks.
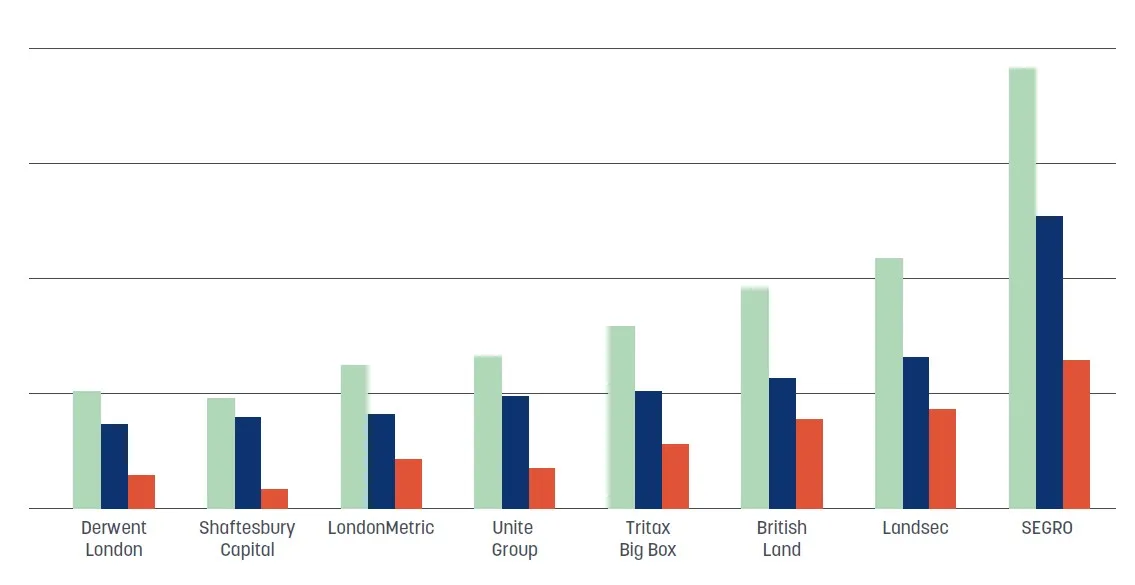
Against this higher-interest-rate and inflationary environment, companies have had to sharpen their resilience and adapt. Forward planning, being proactive and maintaining strong lender relationships are key to this. To understand how market pressures are feeding through to balance sheets, Property Week analysed the latest full-year financial reports of 17 listed property companies (see methodology, p33). The results show that total net debt rose 19% to £34.4bn in 2025, from £29bn in 2024. Median net debt stands at £1.5bn, up from £1.4bn the previous year, according to Property Week’s analysis.
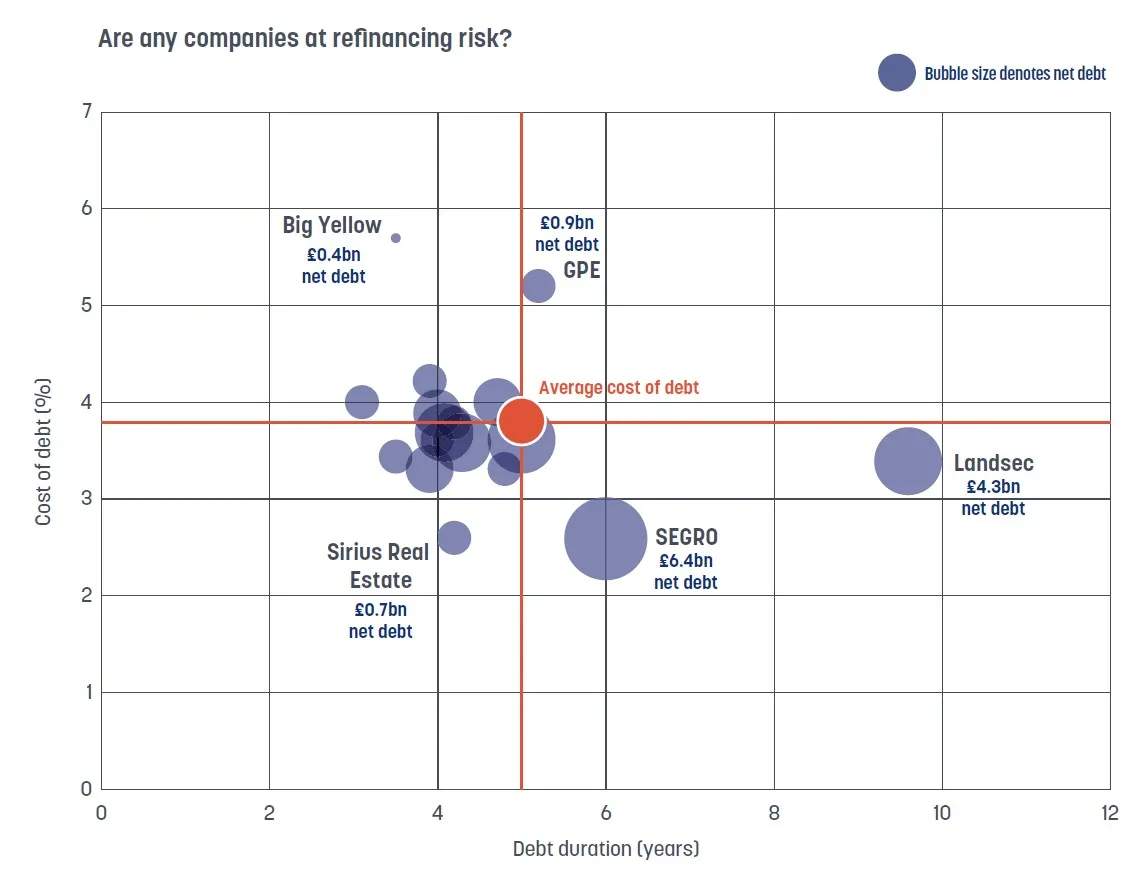
Analysts say the key things investors want to know are whether debt can be serviced comfortably from income, how exposed companies are to refinancing risk and what happens as legacy low-cost borrowing gradually rolls off over the next five years.
Property Week’s analysis of the sector’s financial reports suggests leverage remains broadly within acceptable bounds, but key metrics are drifting with debt costs rising and a fundamental shift is under way in how financial risk is assessed.
What the GFC taught the sector was the importance of a more prudent approach to leverage
Andrew Saunders, Shore Capital Markets
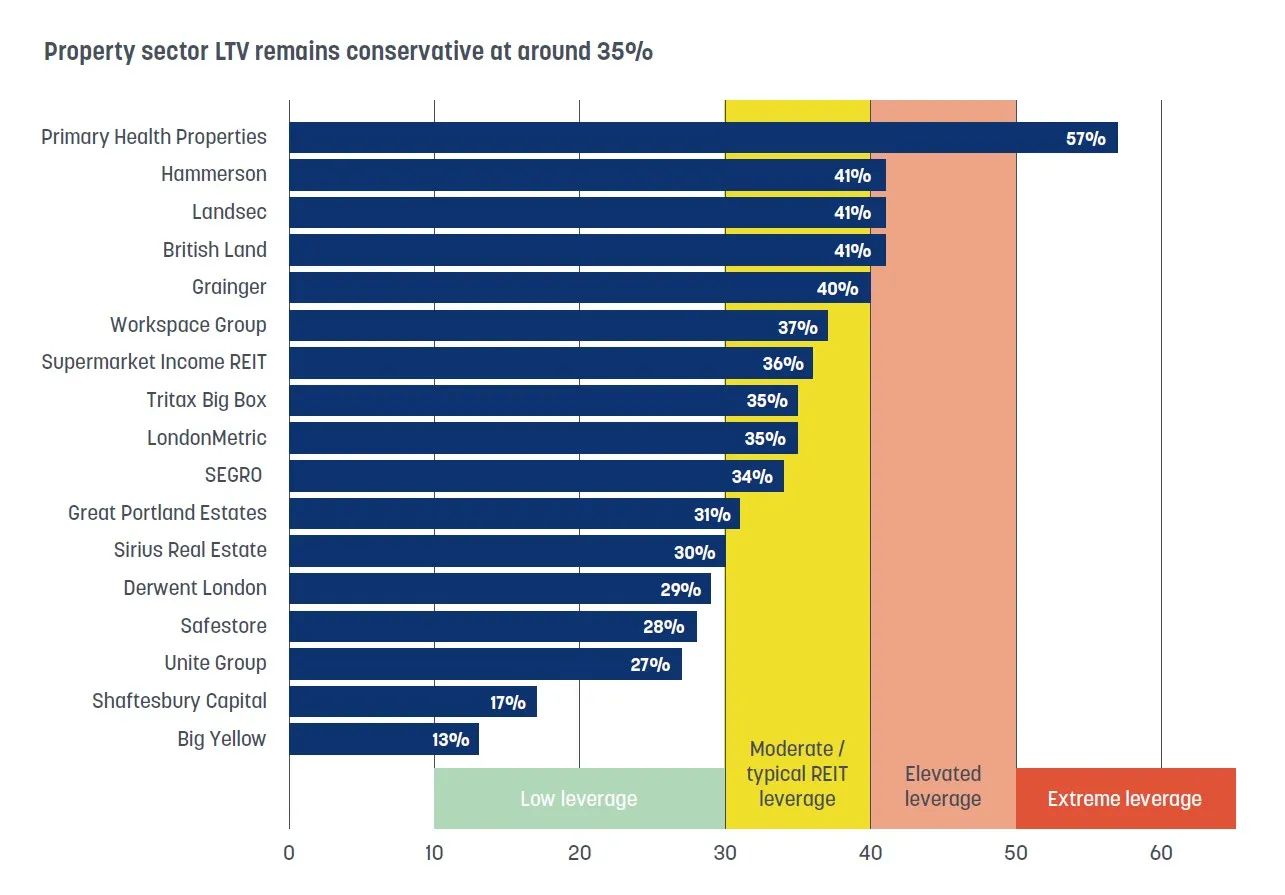
One of the key measures is loan-to-value (LTV), which helps gauge how much debt a company carries relative to the value of its assets. The median LTV (using EPRA data where available) in our group is 35.1%, up from 32.6% the previous year but comfortably below the 40% level that many analysts view as a threshold for concern.
The companies with the lowest LTV include Big Yellow (13%), Shaftesbury Capital (16.8%), Unite (27%), Safestore (28.1%), Derwent London (29.4%) and Sirius (30.4%).
Shaftesbury Capital has a strong balance sheet and its LTV of 16.8% in 2025 fell from 27.4% in 2024 aided by the £574m sale of a 25% stake in its Covent Garden estate to Norges Bank in April 2025. The firm reported net debt of £0.8bn, and its ratio of net debt to EBITDA reduced to 6.6x in 2025 from 10.9x in 2024. It also had substantial headroom against debt covenants and access to liquidity, including undrawn facilities of £675m.
 A spokesperson for Shaftesbury Capital says: “We remain disciplined in our approach to capital allocation and continue to look at opportunities to expand selectively, adding to our growth prospects, ensuring that we deploy resources to enhance the overall portfolio and generate long-term value for shareholders.”
Unite also has a low LTV. A spokesperson says the group will ensure it maintains leverage appropriate for the operational and capital intensity of the business.
Following its circa £723m acquisition of rival Empiric, Unite has retained its leverage targets for net debt to EBITDA of 6x to 7x and an LTV ratio of 30% to 35% on a built-out basis (including the projected value of assets under development). “We have strong liquidity and a clear path to managing leverage, supported by our disposal programme,” the spokesperson says.
Office-focused Derwent London also reported a healthy LTV. The company carried out a lot of refinancing last year, putting it in a strong position. Its chief financial officer Damian Wisniewski says: “The key thing to understand with Derwent is that we operate in a relatively low-yielding sector and have a meaningful development pipeline.”
He adds: “Given our low-yielding assets and development exposure, we believe we should operate with lower leverage than peers. Maintaining a very strong balance sheet has always been a core part of Derwent’s strategy, and that will continue.”
 The company with the highest leverage in our study is Primary Health Properties (PHP) with an LTV of 57%. In most contexts, that figure would be a cause for concern – but not for PHP, analysts say. The reason lies in income security, as around 80% to 90% of PHP’s rental income is effectively backed by the UK government, with long leases typically extending beyond a decade. “That income is extremely secure,” says Peel Hunt’s equity research real estate analyst James Carswell. “This means the business can support higher leverage than some other REITs.”
PHP’s current level of debt also reflects the acquisition of rival healthcare REIT Assura. The £1.79bn cash-and-shares deal pushed leverage higher, but was undertaken with a plan to deleverage through disposals and joint ventures (JVs). “It was essentially a condition of doing the deal,” says Andrew Saunders, equity analyst at Shore Capital Markets. “The expectation was that disposals would follow to bring leverage back down.”
This process is already under way, with asset injections into JVs expected to reduce LTV towards 50% in the near term. Speaking to Property Week last month, on
the day of the 2025 financial results, PHP chief executive Mark Davies said: “It’s important to note that healthcare assets are highly resilient and secure, which allows for higher leverage than other sectors. That said, we are committed to returning to our target range [between 40% and 50%].”
EPRA metrics
EPRA (European Public Real Estate Association) metrics, used in this analysis, were introduced in 2003 to address inconsistency in reporting. Historically, property companies reported financial metrics in different ways.
Hassan Sabir, finance director at EPRA, says: “Companies reported metrics as they saw fit, with different adjustments, making comparisons difficult. EPRA’s mission is to provide transparency and comparability across the sector through harmonised metrics with consistent methodologies.”
Today, the EPRA framework has expanded to include a full suite of measures, including EPRA NAV, EPRA earnings, net initial yield, cost ratios and most recently EPRA LTV, which was introduced in 2022. These metrics help draw comparisons between companies.
Sabir says: “For example, if an investor picks up an EPRA NAV, it will have the same building blocks as another company’s EPRA NAV. The real value often lies in the breakdown in terms of how adjustments are made, how financial instruments are treated and so on.”
One key difference lies in the treatment of hybrid debt. While rating agencies often classify hybrid instruments as 50% debt and 50% equity, EPRA treats them as 100% debt until conversion. This typically results in higher reported leverage but arguably provides a more conservative and transparent view.
Importantly, these metrics are not imposed unilaterally. They are developed through EPRA’s Reporting & Accounting Committee, which includes 16 property companies as well as buy- and sell-side representatives. Changes can take years of technical debate.
“These are non-GAAP [Generally Accepted Accounting Principles] measures, but widely used by analysts,” Sabir says. “We align with regulatory guidance, including ESMA [European Securities and Markets Authority] guidelines and upcoming IFRS [International Financial Reporting Standards] requirements.”
Meanwhile, sectors with higher operational risk, such as development-heavy offices, tend to operate with lower leverage – examples include Great Portland Estates (GPE), which has an LTV of 30.8%.
“I’m more relaxed about PHP having around 50% LTV than if GPE had the same,” says Oli Creasey, head of property research at Quilter Cheviot. “The reason is that companies like GPE do a lot of non-income-producing development work, which carries operational risk. So, they have an extremely prudent balance sheet.”
However, LTV as a metric is not without its limitations. LTV is heavily influenced by asset values, which can drop quickly in volatile markets. The downturn in property values since 2022, driven by rising interest rates, has already pushed some companies towards the upper end of their target ranges without any corresponding increase in borrowing. There is also a structural issue as most listed property companies now operate within a relatively narrow band of leverage, typically between 20% and 40%. Historically, this was not the case. Prior to the global financial crisis (GFC), leverage levels were significantly higher and movements in LTV carried greater consequences.
“What the GFC taught the sector was the importance of a more prudent approach to leverage,” says Saunders. “If you’re running at a high LTV in normal markets and values fall sharply, as they did [by 40% to 45%] between 2007 and 2009, then a 50% LTV, for example, can very quickly become 80%.”
He adds: “That’s what happened. Most REITs had to carry out deeply discounted rights issues. It was a very painful wake-up call.”
Earnings-based metrics
Meanwhile, attention is increasingly shifting towards earnings-based metrics, particularly net debt to EBITDA. The reason is that in a higher-interest-rate environment, the ability to service debt matters more than the nominal level of that debt. “Historically, LTV was the primary focus, particularly pre-2008 when leverage levels were much higher,” says Jonty McNuff, director of group finance at British Land. “Over the past decade, that’s shifted.”
He explains: “Net debt to EBITDA reflects earning and debt serviceability. Ultimately, it tells us whether we can service our debt over time, which is a key determinant of balance sheet strength.”
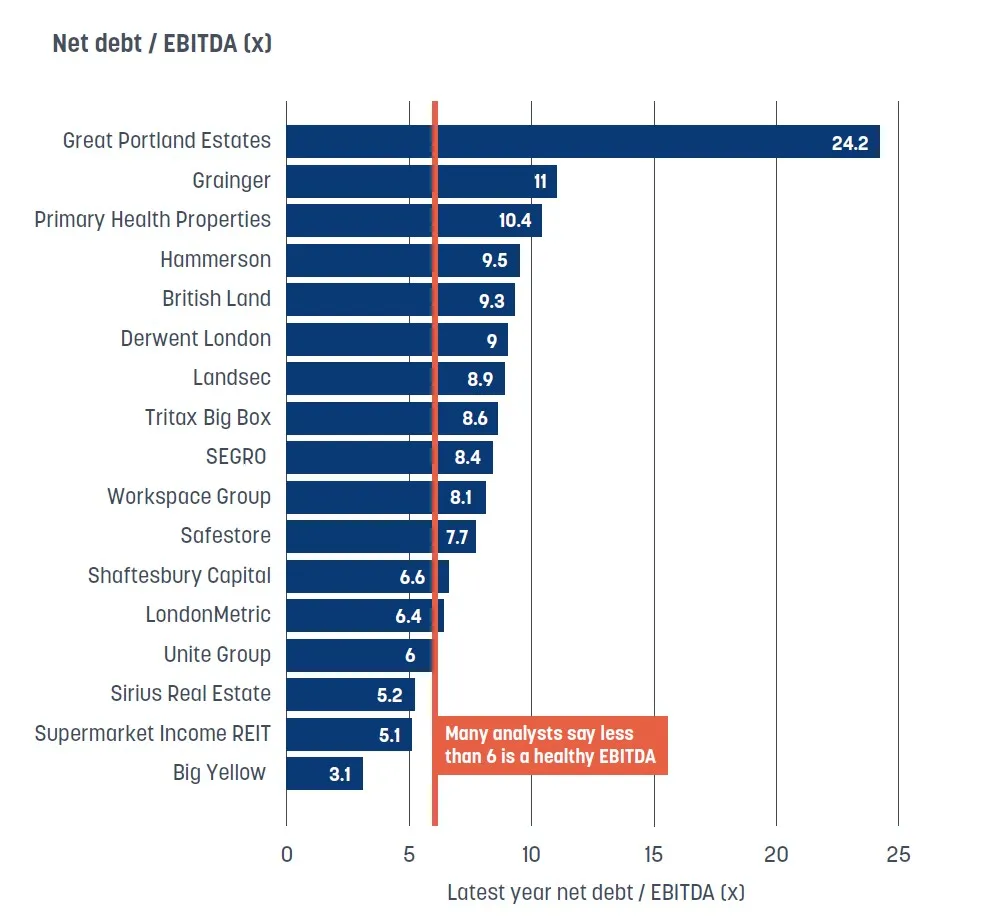 Across the sector, the median net debt to EBITDA ratio stands at around 8.4x. But there is significant variation among individual firms. At the higher end are companies such as GPE (24.2x), Grainger (11x) and PHP (10.4x). However, elevated ratios can sometimes be more reflective of business model differences rather than underlying weakness. Development-led companies, for example, often report higher multiples because a significant portion of their assets are not yet income-generating. For example, around 40% of GPE’s portfolio is in refurbishment. These assets are being repositioned for future capital growth and currently generate limited income, which inflates the ratio.
At the other end of the spectrum are income-focused businesses such as Big Yellow (3.1x), Supermarket Income REIT (5.1x) and Unite (6x), where stable, high-yielding portfolios support lower-leverage multiples.
The shift towards EBITDA metrics also reflects a broader change in the sector as the cost of debt has become more relevant amid higher interest rates. One of the key concerns in a higher-rate environment is refinancing risk. As debt matures, companies must replace it, which can come at a significantly higher cost. However, Peel Hunt’s Carswell says: “When you think about companies in the listed sector, they almost all without exception now have high-quality portfolios in cost-efficient structures, with sensible balance sheets and leverage. So, across the sector, we don’t really see companies that would face serious problems if borrowing costs increased.”
Net debt to EBITDA tells us whether we can service our debt over time
Jonty McNuff, British Land
So, despite a higher-rate environment, analysts remain broadly comfortable with refinancing risk across the listed sector, with lenders continuing to show strong appetite for providing debt.
The confidence also reflects relatively low leverage levels and strong asset backing. Listed property companies typically operate with lower gearing than private real estate funds, which makes them more attractive borrowers. Property Week’s analysis shows the average cost of debt is currently around 4%, with average duration of about five years. New borrowing, however, is closer to 5.25%.
That implies a gradual increase in interest costs as existing debt is refinanced but the impact is likely to be manageable, according to Peel Hunt’s real estate equity analyst Matt Saperia. “In very simple terms, moving from 4% to 5.25% over roughly 10 years works out at about 10 to 15 basis points per year, and that’s a relatively manageable increase,” he explains.
Additionally, rental growth is expected to offset much of that increase. As long as income continues to rise, Saperia expects that companies should be able to absorb higher financing costs without significant pressure on earnings or dividends.
 Beyond the headline metrics, the structure of debt is becoming increasingly important. Companies are placing greater emphasis on extending maturities and avoiding major refinancing events. British Land, for example, has no requirement to refinance until mid-2029. “That gives us significant flexibility,” McNuff says. “We don’t need to raise capital in volatile markets.”
Charlie Turrell, head of commercial finance at GPE, says: “We seek to maintain a disciplined balance sheet with low leverage throughout the cycle. We have a strong core banking group who have supported us over the years, providing over £1bn of bank facilities since 2020. Alongside this, we receive strong support from our private placement and sustainable public bond investors, underpinning our flexible and diversified debt book.
“Combined with a well-laddered maturity profile and limited exposure to variable-rate facilities, we are well positioned to navigate periods of macroeconomic volatility and avoid ‘cliff-edge’ refinancing events.”
The market seems to be becoming more vanilla
Oli Creasey, Quilter Cheviot
According to analysts, longer maturities help reduce exposure to short-term volatility, while fixed-rate borrowing provides protection against rising interest rates.
Diversification of funding sources is also key. For example, in addition to bank lending, firms can access capital through bonds, private placements and JVs. As balance sheet discipline becomes more important, JVs can offer a solution to help manage leverage. “JVs are increasingly common as a way to recycle capital,” says Saunders. “You can sell, say, 50% of an asset, realise cash, but still retain exposure.”
This approach allows companies to free up capital for new investments without significantly increasing net debt. It is particularly common in development where capital requirements are highest. Creasey describes it as “another form of operational gearing”, which allows companies to retain control while bringing in external capital.
In some cases, JVs are seeded with existing assets, providing a way to validate valuations while releasing cash. More broadly, however, financing structures have become simpler in recent years. Complex instruments such as convertible bonds are less common, while US private placements have become less attractive due to higher costs. “The market seems to be becoming more vanilla,” Creasey observes.
Unsecured borrowing
Another trend analysts observe is the shift towards unsecured borrowing. “Increasingly, companies borrow on an unsecured basis, which gives them more flexibility,” says Saperia. If debt is secured against specific assets, companies may face restrictions on sales or capital allocation, but unsecured funding avoids those constraints.
Saperia says: “Until recently, the bond market had been one of the most competitive sources of financing, so several companies raised debt through bonds. More broadly, access to debt has been very strong, although recent market volatility may have changed conditions slightly.”
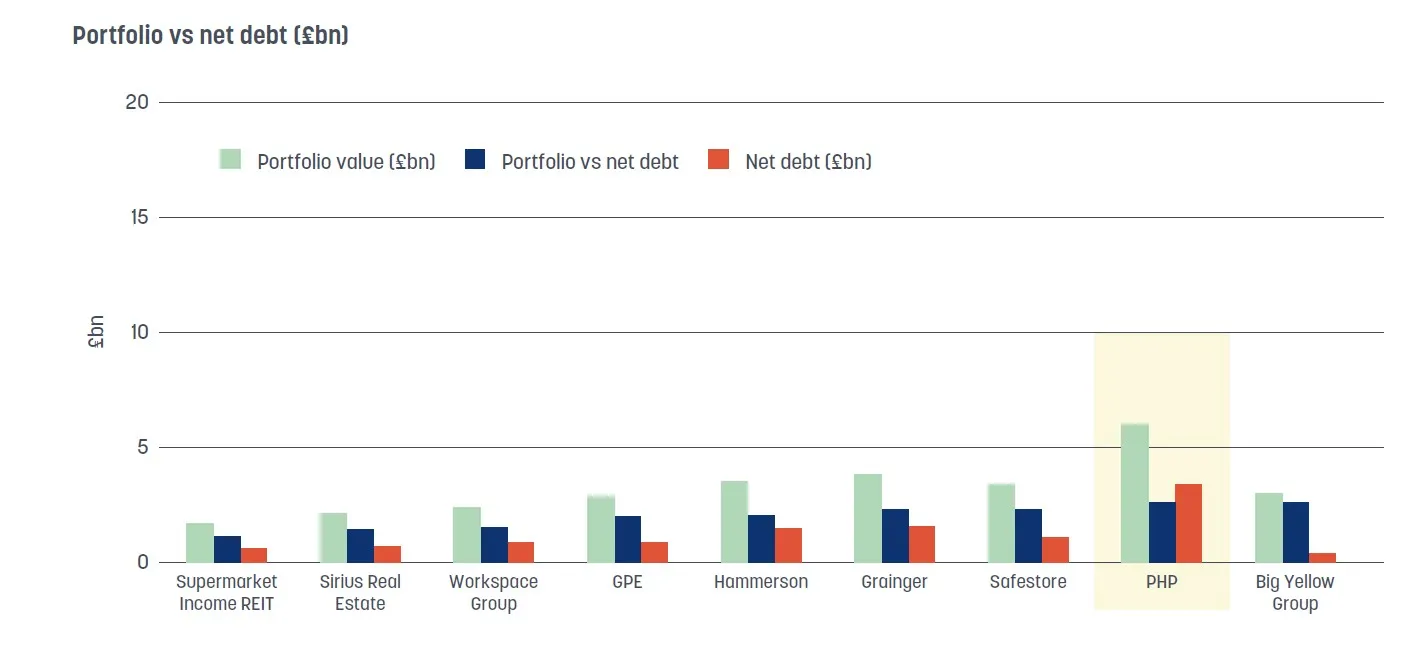
The company with the largest net debt in Property Week’s analysis is SEGRO, which also has the largest portfolio, valued at £19.1bn. SEGRO’s net debt came in at £6.4bn for 2025, up 17% from the prior year. The company has recently made a strategic pivot towards fully fitted data centres in a move that is significantly more capital-intensive than its traditional logistics model. “They’ve shifted towards fully building the facilities themselves. It’s more capital-intensive but higher-returning,” says Creasey.
Increasingly, companies borrow on an unsecured basis, which gives them more flexibility
Matt Saperia, Peel Hunt
Speaking to Property Week on the day of SEGRO’s 2025 financial results, chief executive David Sleath said: “Fully fitted data centres require significantly more capital, as well as technical and commercial expertise we don’t currently have in-house. So, for now, we will deliver fully fitted schemes through JVs with experienced partners who have both operational capability and established relationships with hyperscalers.”
According to SEGRO, developing fully fitted data centres on the most scarce and sought-after sites will significantly enhance the income and value it can generate from its powered land bank.
The strategy raises a broader question around whether listed property companies can still pursue capital-heavy growth in a higher-rate environment. SEGRO’s answer is to combine debt with JV capital and asset-level financing, which reduces the burden on its balance sheet. “This first project will essentially be a test case: to see how the economics work and whether investors want to fund more of these developments,” says Peel Hunt’s Saperia.
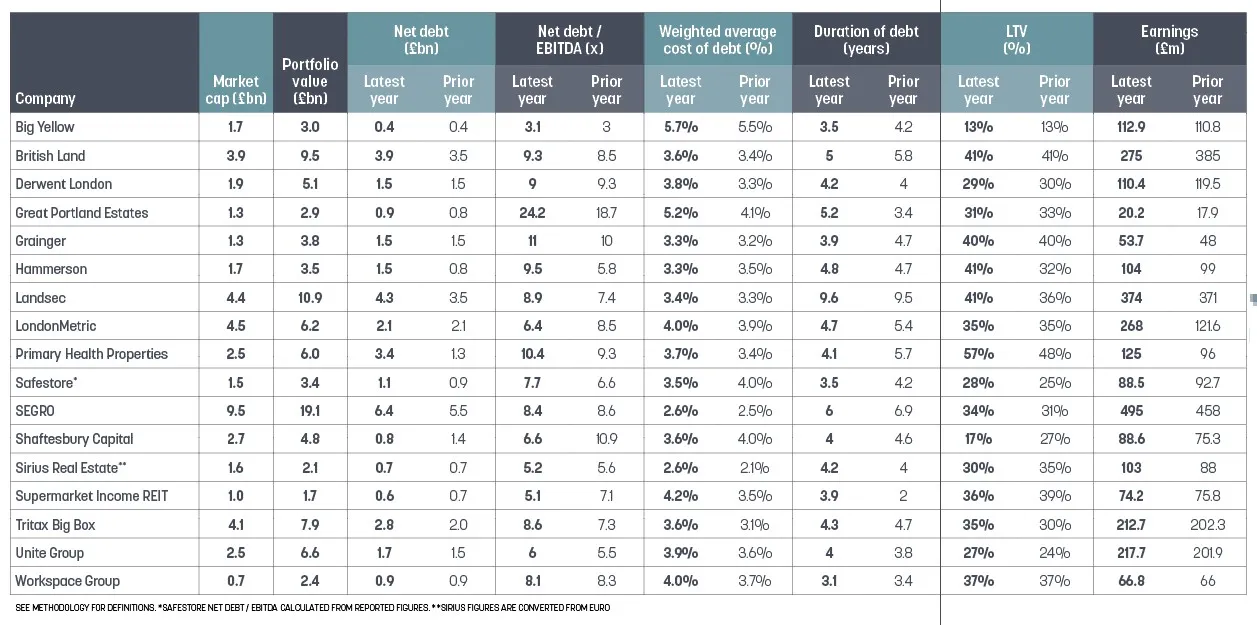 Despite SEGRO having the largest net debt, however, it was PHP that saw the largest net debt increase year on year – from £1.3bn in 2024 to £3.4bn in 2025, following its Assura acquisition. Hammerson followed with an increase from £0.8bn to £1.5bn, which the company says reflects capital investment in three JV acquisition transactions in the year. During the year, Hammerson acquired its JV partners’ stakes in shopping centres at Brent Cross in London, Bullring and Grand Central in Birmingham and The Oracle in Reading. This boosted its portfolio value to £3.5bn.
Across the companies Property Week analysed, the median net debt increase was 11% year on year. While debt levels are rising, much of this reflects strategic activity, including Hammerson’s acquisitions and SEGRO’s pivot into fully fitted data centres, rather than balance sheet strain.
So, for now, the UK listed property sector looks financially robust: balance sheets are stronger than they were heading into the GFC, leverage is lower, debt maturities are longer and funding sources are more diversified.
Methodology
This analysis covers UK‑listed property companies but excludes housebuilders and other companies whose reporting structures are not comparable for this exercise. Property Week sourced the data from companies’ latest annual reports and accounts. The cut-off date for data collection was 17 March 2026 – except for the market cap data, which was collected on 15 April.
All reporting periods relate to FY2025. To enhance comparability, EPRA metrics were used where available, alongside proportionally consolidated figures to capture each company’s share of joint venture (JV) exposure. EPRA metrics include net debt, earnings and loan-to-value (LTV). In cases where EPRA LTV is not applicable due to valuation methodology, such as Big Yellow, which values assets on an operational rather than investment property basis, alternative ratios (such as net debt to gross property assets) have been used instead.
Net debt and net debt/EBITDA are shown on a proportionally consolidated basis where possible, incorporating each company’s share of JV debt, cash and income. Differences in reporting treatment, timing and JV structures mean these metrics should not be considered strictly like for like.
Definitions of weighted average interest cost (WACD) vary between companies and are calculated using different methodologies. Some base the metric on gross debt, others on drawn debt, and individual definitions may include interest, amortised costs, commitment fees or other financing charges. For companies using a proportionally consolidated basis, WACD figures typically include the group’s share of JV debt and exclude non‑controlling interests. As a result, WACD figures are not directly comparable across the sector.
Earnings metrics are based on reported EPRA earnings, which exclude valuation movements, gains and losses on disposals and other non‑recurring or non‑cash items, providing a clearer measure of underlying operational performance.
Property Week has used median figures in this analysis for net debt, net debt to EBITDA and LTV, but used the average for cost of debt, as there is less variation in this data. Figures in this analysis, including net debt, have been rounded and may therefore result in minor inconsistencies.

