
China’s Outbound Investment Shrugs Off the Iran War | American Enterprise Institute
Key Points
- The US-Iran war is an obvious obstacle for China’s global investment and construction. Nonetheless, authentic investment—disclosed by participating firms—had a solid performance January–June. Canada reemerged as a major recipient thanks to a large acquisition. Energy was the top industry, ahead of metals. Frozen projects in the Middle East prevented any country leading in construction; energy and transport saw the most activity.
- According to China’s Ministry of Commerce, COVID did not harm outbound investment, and it has climbed (very) steadily higher since. Yet recently reported totals show much less impact than similar levels in 2016–17. The ministry’s figures represent money parked offshore more than money actually spent.
- China’s investment in the US has been minor for almost a decade. The main issues in economic relations are continued Chinese theft of technology, now featuring AI, and leverage over supply chains, now featuring pharmaceuticals. America’s failure to respond is increasingly dangerous.
Introduction
Visibility into China’s international economic activity has declined. One cause is Chinese firms are becoming less transparent, with their websites more frequently inaccessible outside China and information about their operations deliberately limited, even at home. There’s also a research problem. Scraping the internet is a common and poor approach. Doing so overstates transactions because many news sources struggle with accuracy, thanks chiefly to local officials boasting of large deals that may not occur. The increasing prevalence of artificial intelligence means bad information is spread more easily.
The China Global Investment Tracker (CGIT) has never relied on local officials or news media as sources. It relies on corporate disclosure, only recording when firms have indicated a transaction is in progress or has occurred and have provided a financial value. The CGIT is the most complete public record of China’s investment and construction globally, with 5,400 transactions documented from 2005 on.1 It excludes transactions until they can be valued; it also excludes transactions smaller than $95 million. When small deals are common, it underestimates China’s activity. But almost all large deals are captured. These became much less numerous in 2020, and the CGIT shows a brutal spending drop then.
Like many Chinese government organs, the Ministry of Commerce (MOFCOM) reports all is well all the time. It claims COVID and “zero COVID” somehow boosted outbound spending, with a 30 percent increase in the 2023 outlay over 2019, featuring a 12 percent rise in 2020.2 MOFCOM’s final figure for 2025 is not available yet, but the large majority of investment is always reported in Hong Kong, followed by offshore financial centers such as the British Virgin Islands. National recipients, such as Australia, have become much less important. The US is the leading national recipient historically, yet it saw only $18 billion in total Chinese investment during the first half of this decade. Other transparent economies also show weak investment over this period.3
COVID and zero-COVID restrictions caused that drop, of course, and are also associated with the reduced transparency. This is one reason the People’s Republic of China’s (PRC) verifiable investment and construction have not reattained pre-pandemic levels. Verifiable investment was about 9 percent higher in 2025 than 2024, with the number of recorded transactions also rising. The first half of 2026 was then roughly stable—a robust result given the US-Iran war and one that may portend a strong second half. Canada has surprisingly topped the country charts thus far this year, on the back of Zijin Mining’s acquisition of Allied Gold. Energy edged out metals as the busiest industry.
Investment involves (partial) ownership and an indefinite presence in the host country. It’s often conflated with construction projects such as power plants and highways. The latter usually do not include ownership rights and have fixed terms. There are nearly as many construction transactions in the CGIT as investment transactions, though the construction transactions are of lower value. COVID and zero COVID naturally also depressed construction until a powerful recovery in 2023–24. That faded a bit in 2025, but construction is holding firm so far in 2026. The Middle East is a prime location for Chinese engineers, and some projects there are on hold, so the full year could see solid growth. There is no clear country leader yet in 2026, while energy beat transport slightly among sectors.
Conflation of investment and construction distorts discussions of the Belt and Road Initiative (BRI). China’s portal lists 143 member countries,4 whose officials typically deny large-scale PRC ownership in their countries while loudly advertising major investments (even before they happen). BRI projects are in fact not primarily owned by China. The CGIT documents construction and engineering worth $720 billion versus investment worth $480 billion in BRI countries since the program’s inception.
The BRI has in this way been only a limited substitute for China’s loss of investment access to suspicious rich economies, which feature the US. Chinese spending in the US was $55 billion in 2016 alone, triple that for 2020–25. The attention still being paid to farmland is off target—the PRC has barely invested in America for years, in anything. It’s the rest of American economic policy toward China that’s the disaster.
President Trump’s once seemingly aggressive stance toward China is open appeasement now, apparently in fear of the PRC’s dominance in mineral processing.5 A much more dangerous dependence has emerged in pharmaceuticals, and the US just talks endlessly.6 The failure to respond to China’s illegal training of its AI on American models will certainly cost the US global market share in coming years and, if AI is transformative, might eventually cost America tens of trillions of dollars.7 The US should keep an eye on Chinese investment aimed at controlling global supply chains, but this is just one part of a much larger problem.
CGIT vs. MOFCOM
This section focuses on differences in data from MOFCOM and CGIT since 2020 and the flaws in both. But first, a warning: Using AI can produce near nonsense, taking the form of research. Without strict oversight, scraping news on Chinese activity can involve absurdly unreliable sources. Reports say companies will make huge investments they have nothing like the money for, and host countries announce surprising amounts of inbound capital because they were mentioned in a meeting. There is plenty of click chasing, portraying an omnipresent China, based essentially on chatter. Highlighting more fake transactions now than last year is unhelpful at best. All of this will eventually be recognized, as the PRC’s global footprint does not match the hype. For now, characterizations of that footprint should be viewed very skeptically.
The CGIT helps solve this problem. Transactions are not included unless participating companies disclose them as in progress or completed in statements to stock exchanges, annual reports, press releases, or other authoritative documentation. Local media or claims by political figures, if used, are only the first step of the research process. From 2005 through the first half of 2026, the CGIT documents well over 2,500 investments of the required size, worth more than $1.6 trillion. There are nearly 2,500 construction projects, worth $1.1 trillion. There are 430 troubled transactions, implicating almost $480 billion.
Companies often revise transactions after disclosing, and the CGIT is revised semiannually. It’s generally not possible to provide accurate year-by-year estimates for individual transactions, so the full amount is attributed at a specified date, and the best single date for a transaction can change. The CGIT shows shifts over time clearly, shifts from year to year less so. For tractability, transactions worth less than $95 million are excluded. Chinese involvement in sectors of small economies is therefore understated. Moreover, when firms become more hesitant and the average transaction size drops, the CGIT misses more. For example, this may have occurred in 2021, when the pandemic first started to wane.
CGIT investment figures are gross outlays. PRC enterprises typically do not disclose depreciation, so the CGIT does not incorporate it. Naturally, Chinese companies can disinvest as well as invest. If this disinvestment comes at a loss, it appears in “troubled transactions”—transactions impaired in some fashion after the final commercial agreement. Disinvestment is not subtracted from totals after the fact. Bonds, loans, and trade do not qualify for inclusion.
In turn, MOFCOM data suffer from multiple flaws. The first is unavoidable: a legal requirement to treat Hong Kong as an external customs port. This explains Hong Kong’s dominant share of “outward investment” totals, which has consistently approximated 60 percent over time. Most funds proceeding through Hong Kong are on the way elsewhere, unmeasured by the ministry. This gap is compounded by a global issue: The second- and third-largest supposed destinations are offshore financial centers in the Caribbean region.8 Funds parked there are not genuine outward investment; funds moving on are not captured by MOFCOM. The ministry’s by-country investment figures are incorrect.
Money can also return to China from these locations, known as “round tripping.” This distorts MOFCOM’s totals and may account for bizarre historical results. In 2020, on official data, investment flows into the Cayman Islands were less than $9 billion, but investment stock was said to jump $180 billion. In 2021, flows were near $11 billion, and stock plunged $225 billion. Also in 2021, flows to the British Virgin Islands were $7 billion, yet stock soared $290 billion. The total stock of investment rose $390 billion in 2020, of all years, while falling in 2022. In 2024, “leasing and business services” saw positive investment flows yet a large stock drop, while IT saw negligible flows, yet stock tripled.9 MOFCOM is publishing impossibly contradictory numbers.
The changing nature of the investment also leaves it emptier. Total investment in 2024 almost matched the 2016 record. In 2016, new equity constituted 58 percent and reinvestment 16 percent, while in 2024 this was 38 percent and 41 percent, respectively. Mergers-and-acquisition spending was at least 21 percent of the total until 2019, then below 13 percent in 2019–24. Reinvestment was 40 percent of the total once before 2019, while it was above that for all of 2019–24.10 This scale of reinvestment should be unmissable. The amounts are only sensible if reinvestment is intense in rich economies that previously absorbed most PRC investment. Yet these countries have neither praised nor feared this event, suggesting it’s not real.
A last statistical oddity may be getting fixed. China in the past reported “nonfinancial” outbound direct investment on a monthly basis, occasionally upgrading that to the total for outbound investment. Then a final figure would appear much later that would somehow be still larger. Now, nonfinancial outbound is falling, and coincidentally, total outbound investment has started to be reported monthly. It remains to be seen whether there will be another mysterious revision upward after year’s end.
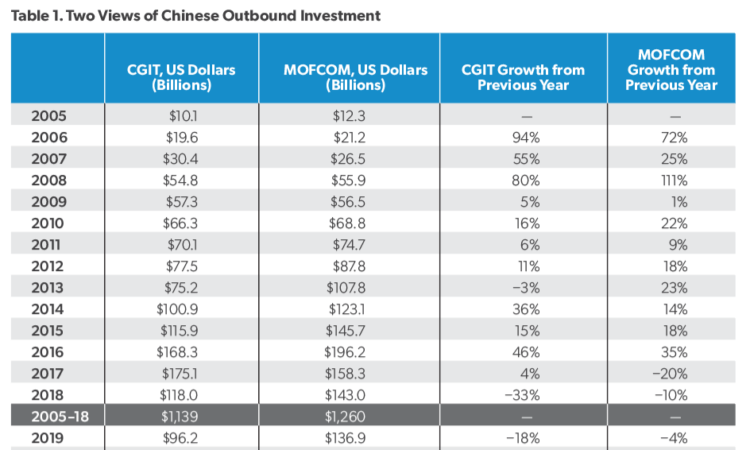
For 2025, a mysterious revision is still pending: We do not have the final official number. Outbound nonfinancial investment inched barely 1 percent higher, to about $145 billion in 2025, while the first estimate for total outbound investment was a 7 percent rise to $174 billion.11 Because the latter should be closer to the final, highest figure, that is what’s presented in Table 1. (But note that nonfinancial figures are still reported and look quite different at the moment.)
The data from CGIT and MOFCOM fit well from 2005 to 2019 (Table 1). The rise of Chinese investment seemed unstoppable through 2016, generating predictions of trillions of dollars more to come. Both sources then illustrate the effects of Beijing tightening outbound capital controls in late 2016 and major partners starting to limit Chinese inflows in 2017.12 From 2005 through 2018, the CGIT provided detailed information on nearly 90 percent of the totals the ministry announced, with the missing volumes most likely a function of the CGIT size requirement.

The two sources split when COVID prevented late-2019 transactions from closing. MOFCOM may have recorded the transactions anyway, fitting its treatment of COVID as a nonevent (at worst). The CGIT naturally reflects the pandemic and related multiyear restrictions as a body blow. There was also a decline in corporate transparency starting in 2020. Sometimes this is obvious—for example, the ministry puts PRC investment in Russia at $4 billion in 2024,13 though no Chinese firms acknowledge this. More broadly, firms frequently suppress monetary values for announced transactions. This plagues the CGIT, while MOFCOM manages to find suspiciously consistent growth in 2023–26, with the twist of deemphasizing nonfinancial figures when they worsened.
Another part of the divergence is from the smaller average transaction size in the 2020s than most of the 2010s, as more private firms got in on the outbound act. The CGIT should thus in recent years miss more transactions because they are below its $95-million threshold. But missing $50-million payments cannot compensate for the disappearance of multibillion-dollar state acquisitions. These were the bedrock of Chinese outbound investment, then they vanished, yet investment somehow held. It’s all too familiar when a Chinese government body refuses to admit bad news.14 Instead, the flood of money in and out of the offshores just makes official Chinese figures unverifiable. Since 2020, MOFCOM might still be presenting the location of China’s overseas capital; it’s certainly not presenting funds actually used.
The disparity with the CGIT could therefore be understood as spending changing in character—funds dumped offshore rather than used for greenfield projects or acquisitions in national economies. Until ministry data highlight the latter, the hefty gap with the CGIT will persist, though growth rates may be similar. If spending has an impact confirmed by China’s partners, there will be less need to puff up official numbers. Finally, even if the ministry’s current totals are taken as gospel, its bilateral figures are invariably wrong. The CGIT was created largely to follow investment past Hong Kong and offers a much more accurate bilateral picture.
Investment is often confused with construction and engineering services, which do not necessarily involve ownership. PRC enterprises can own few assets in a host country yet contribute intensely to building housing and airports, for example. Construction is concentrated in less transparent partners and hence harder to track. The CGIT missed some activity in the 2000s because participating firms did not regularly disclose. The CGIT may also miss transactions in the early 2020s because, as with investment, the average size fell and fewer qualified for inclusion. The CGIT also currently understates 2026 construction, because construction typically requires more time to confirm than investment.
For these reasons, the MOFCOM figures most directly comparable with CGIT construction are considerably larger than what CGIT has. However, the ministry triple counts. If a railway or road crosses the PRC’s border, its foreign and domestic components are both included in the data. More importantly, if a Chinese entity invests in whole or in part paying for construction activity by another Chinese entity, MOFCOM counts them both, in different buckets. It’s all part of the same transaction, and the CGIT treats it as investment, therefore “robbing” construction.
The CGIT-MOFCOM construction contrast does contain a few surprises. In 2020, MOFCOM’s volume fell modestly, while the CGIT’s plunged.15 The clashing bases again affect the rest of this decade. But here, the CGIT also has official data on its side—the number of workers the ministry reports overseas plunged in 2020 and generally fits CGIT’s construction better than MOFCOM’s. In 2022, the overseas labor force fell 19 percent on MOFCOM’s tally, and the CGIT showed revenue decline, yet MOFCOM claimed it was stable.16 In 2024, the number of workers jumped, as did CGIT construction, while the ministry reported only a small gain.17
For 2025, MOFCOM shows a moderate increase in construction activity,18 while the CGIT is stable. The totals diverge due to the 2020 effect. Comparing 2025 to 2019 shows a 4 percent rise for MOFCOM, which is much more reasonable than for investment, while the CGIT shows a low double-digit decline. At the time of writing, neither the ministry nor the CGIT can offer genuinely complete construction revenue for the first half of 2026. MOFCOM yet again has growth steady through May,19 while the CGIT is on course for an acceleration, mirroring their 2025 difference.
One place the ministry and CGIT entirely agree is BRI construction dominance. Investment in the BRI remains a secondary part of China’s global investment, with about a 20 percent share according to MOFCOM20 and 30 percent according to the CGIT. The BRI dominates China’s global construction. The CGIT has the BRI construction share frequently above 90 percent, while MOFCOM has it consistently around 85 percent.21 Within the BRI itself, construction historically leads, half again as large as investment since inception according to the CGIT. Finally, China’s official loans to BRI members fit CGIT construction figures.22
The role of Hong Kong and the offshores means MOFCOM does not correctly portray bilateral spending. Funds may flow to other recipients, sit as cash at the nonnational destinations, or even return to the Chinese mainland. The CGIT’s corporate disclosures reveal where capital ended up.
The US remains historically the top target for Chinese investment, but this is a 2010s, not 2020s, result. Negligible PRC spending in recent years has dropped the ratio of its investment to American GDP to the lowest among top 10 recipients (Figure 1). The top 10’s proportion of the China total is now below 52 percent, versus 59 percent in 2017. The best signal of a true resurgence in Chinese outbound investment would be shifts in this long-stale group. Russia is a prospect. It has been receiving unverifiable amounts of Chinese funds since its invasion of Ukraine and will likely see a slew of deals if it returns to sanity.

If the investment top 10 does not change, the BRI as a whole is the obvious alternative recipient. Official Chinese investment in the BRI outperformed in 2025 and, to date, 2026. For the CGIT, the full version of the BRI has been outperforming in investment since 2022. Before rich economies began to shut out PRC enterprises, BRI members trailed distantly, simply due to a dearth of attractive assets. Most transactions at least appear to be unprofitable, so that high-volume corporate investment in the BRI would require incentives from Beijing. Egypt is currently claiming intense Chinese interest, but that will not play out unless the first set of firms does well. Down the line, Iran and Ukraine could boost BRI results.
Otherwise, the BRI will remain chiefly composed of construction projects. The PRC’s global building is smaller than investment, but within the BRI, it’s a much larger percentage. The CGIT provides sector and country information for construction, which the Chinese government does not do on a regular basis. Power generation and transportation see the most activity. Nine of the top 10 countries for China’s overseas construction are in the BRI (Figure 2). Construction is historically less concentrated than investment, though the Middle East was seeing disproportionate attention before the US-Iran war. The CGIT documents the ownership status of all participating companies. Construction is utterly dominated by state-owned enterprises (SOE) such as China Railway Engineering. The CGIT shows 24 of the top 25 builders as SOEs. (The top 75 investors have a more private flavor.) These have for decades been assigned challenging projects at home. Heading out, state support means they can absorb financial losses when conditions are difficult. Construction is less valuable dollar for dollar than investment but, possibly for the same reason, faces less opposition. Even if the PRC’s investment is glorified recirculation among Hong Kong and the offshores, its engineering and construction will be globally pervasive and a strategic advantage.

Construction projects can stretch many years but have fixed terms. Investment is indefinite. Conflating them is generally a mistake for this and other reasons, but the combined value does show the spread of PRC companies without even considering trade. As with trade, Beijing chases diversification in host countries and, to some extent, regions. The US-Iran war will only intensify this effort. Counting Australia in east Asia, each region sees $300 billion or more in activity, with a dozen different countries clearing $60 billion (Figure 3). Combined global investment and construction from 2005 through the first half of 2026 stands at $2.7 trillion.

Before COVID, Chinese firms geographically migrated every few years because bursts of Chinese activity strained host society and polity. Yet another sign of weaker-than-stated Chinese investment this decade is no such strained hosts—or migration. According to the ministry, investment volumes in 2021–25 were well above any five-year period before the pandemic, yet a dozen or more countries started screening PRC entities in 2017 and 2018. Now, there’s nothing of the sort.
Geographic diversification of the PRC’s activity is driven by policymaker concerns over dependence on China or, for Beijing, on a few of its partners. In contrast, companies would prefer just to chase profits, possibly by securing preeminent positions in single markets. The pattern by industry shows activity to be quite concentrated (Table 2).

Energy, topped by oil, accounts for 31 percent of investment. Transport and metals continue to power ahead via the electric battery boom. Property investment is much larger than it looks, due to purchases of homes cheaper than the CGIT’s $95-million cutoff. An area of potential growth and controversy is health, where Chinese firms are now technologically and financially capable of rapid global expansion. Energy also leads construction, spurred by hydropower. Transport construction is substantial. While ports win attention as strategic, it’s railways, then roads that see the highest volumes. Property construction also exceeds $100 billion. All other sectors combined account for only 20 percent. (Troubled transactions are addressed below.)
Does Beijing Prefer Fake Investment?
The end of zero-COVID restrictions in 2023 enabled a partial rebound in the PRC’s authentic outbound investment. This was no surprise. The surprise is the rebound flattened out well below pre-pandemic performance, at least in terms of what reached other national economies. Beijing is of course capable of publishing fake data indefinitely, but it will not be long before this period of record-breaking investment is understood as somewhat empty.
The true peak for China’s outbound spending to date was 2016–17. This came after government encouragement to “Go Out,” featuring headline deal after headline deal and companies entirely willing to detail their activities. The amount of capital exit caused Beijing to reverse course and impose restrictions. MOFCOM says we’ve been in an equivalent period since 2021, but it has come without headlines, transparency, or much government support. The most clear-cut policy step has been to start blocking outward investment that embodies what’s deemed to be sensitive technology.23
The trend may be for more restrictions. Endless yapping about a “globalized” yuan aside, China’s currency is still unimportant. Through March 2026, the dollar’s share of allocated foreign exchange reserves was 58 percent; the yuan’s was 2.1 percent.24 In May 2026, the yuan share of global payments was 2.8 percent, three-fourths of it in Hong Kong. The dollar share was near 51 percent.25 There are yuan transactions hidden in the small China-run financial network, the Cross-Border Interbank Payment System, but it serves banks and trade settlement. Global investment and construction belongs to the dollar.
This may not seem to be a problem. China’s official foreign exchange reserves are the world’s largest, and they are still probably understated by sizable hidden holdings at state banks.26 Behind them is China’s world-changing export performance. But if something cannot go on forever, it must end, and the PRC’s trade surpluses cannot rise forever. External demands for reciprocity are one risk to surpluses; the shrinking internal labor pool27 is another. And there are multiple threats to reserves beyond net exports.
Overseas construction frequently incurs losses, with enterprises either absorbing losses themselves or the PRC’s banks doing so.28 Foreign investment into the PRC has plunged since 2021.29 Gross capital flight already occurs in quantities much larger than even MOFCOM’s inflated figures for outward investment indicate.30 Genuine $200-billion levels of outbound direct investment could depress domestic sentiment further, to the point of spot shortages, with foreign funds veering away and more local funds leaving. If in a few years, Beijing runs “only” an $800-billion trade surplus, reserves will fall, and the stability-obsessed Communist Party will begin eyeing outbound investment as a lever to limit financial exposure.
The other aspect of the issue is foreign aversion to PRC entities taking a still larger role in their economies than trade already gives them. Beijing is sometimes said to trick gullible partners into “debt traps” to fund large-scale construction projects, but the debt incursion is voluntary. As some BRI members have become wary of borrowing still more money, China’s construction has been partially capped. The result has been a greater concentration of activity in financially sounder economies in the past few years, led by Middle East energy exporters.
Investment narrowed prior to that. Capital-short economies remain very solicitous of Chinese firms, but those who need Chinese money less and want Chinese market access more have tired of two decades of no reciprocity.31 The outbound investment peak a decade ago stemmed largely from seeking profit opportunities in richer economies. It occurred after several years of Xi Jinping’s rule, when his government took a series of actions to assist domestic companies to overpower foreign ones, at home and abroad.32 By 2019, MOFCOM, the CGIT, and other sources were portraying very similar results in terms of what had been the primary recipients of Chinese investment rejecting the unbalanced market access.
Until Xi is gone, China will be a global economic predator. He may, though, see greater inducements for some foreign investment into the PRC as fitting his goals, as long as there is no net loss of strategic leverage. While unlikely to be very appealing to anyone involved, this is the only path for substantially higher authentic Chinese outbound investment. The ministry can publish whatever stock and flow figures it pleases. But the rich economies that would draw the high volumes will not do so while both the number of “strategic” sectors the Chinese state must be able to control and the extent of that control continue to expand, precluding foreign success in these areas. The spring 2026 technology rules make clear that’s still the path forward.
Reciprocity is not the only barrier; there’s also state ownership. The CGIT compiles the top outbound investment firms historically, and these unsurprisingly feature SOEs (with some once-leading private firms, such as HNA Group, now dead). But foreign partners, especially those with vibrant private sectors, much prefer private Chinese investors. The ownership data show a shift toward such investors in the 2020s, though this is primarily a function of verifiable state spending shrinking (Table 3). The middle of this decade cannot equal the middle of last decade because the large SOE acquisitions of the past are no longer on the table and the PRC’s private sector actually has to think about profitability before proceeding with acquisitions at scale.

For authentic outbound investment to exceed $100 billion, state capital must become more acceptable to more host countries. Perhaps the only way this can be achieved is through 2020s greenfield spending becoming to some extent comparable to the acquisitions of 10 years ago.
Greenfield investment creates jobs for partners and does not transfer technology back to the PRC. Local governments and companies often claim a project is ongoing even if little has happened. For this reason, the CGIT is conservative with applying the greenfield label. Nonetheless, the greenfield share began rising in 2019 (Table 4), though again, this was more due to weakness in acquisitions. The first half of 2026 seems to show a reversal, but very large greenfield transactions have been proposed—for example, by ByteDance in Brazil. If these were to reach fruition, it would be a boom in a few countries and possibly spread further.

MOFCOM’s data do not disagree, with 2024 (the latest year available) acquisitions being worth less than they were in 2008—despite the ministry proclaiming that investment as a whole was more than three times as large in 2024. According to the ministry, 2021–24 were excellent years, yet acquisition spending for all four combined was less than in 2016 or 2017 alone. SOEs are not going to be permitted to make repeated, superlarge acquisitions again. Greenfield investment would not only avoid host country restrictions; it could improve China’s foreign relations overall due to the jobs effect. The prime candidate is low-end manufacturing moving out of the PRC as the labor force ages, though Xi would have to be more accepting of this than he has been to now.
It’s more likely that Chinese enterprises will continue to face limits in overseas investment due to technology, security, competition, and ecology concerns. Overseas construction will run into simple feasibility and financial challenges, especially in poorer economies.33 Agreements to build or invest may be reached with foreign companies, then halted by regulators or stalled by other political opposition. This is a way to be counted in CGIT troubled transactions. Partial or total failures can also rise from errors by the Chinese firms or intervention by Beijing. (The pandemic is not counted as a source of troubled transactions.)
Owning assets in foreign countries is more politically sensitive than just building, and the historical value of investments is larger than construction. Troubled investment thus easily exceeds troubled construction, with the former at more than $350 billion and the latter more than $125 billion.
The quantities involved also dictate energy as the most impaired sector and which countries see the most trouble. The US and Australia top the charts (Table 5) due to their popularity in the 2010s and ensuing unhappiness in both governments and populations. There have been comparatively fewer impaired transactions thus far in the 2020s, and they have been of less value, since all large transactions are rarer. It’s unquestionably the case that PRC firms are becoming more agile overseas actors, but few problems can develop with money just sitting in Hong Kong and the offshores.

MOFCOM claims COVID brought higher investment in 2020, then it claims ending the associated restrictions brought higher investment in 2023. This serves as the numerical base for supposedly high-flying investment since. The CGIT makes far more sense: The years 2020–22 were exceptionally weak, and the recovery has not been sufficient to generate the ministry’s numbers or have a global impact matching that in the 2010s. Construction sees a similar pattern, though with less exaggeration by Beijing.34 MOFCOM’s version of the pandemic was not even a blip. In the real world, the PRC’s global footprint has not yet fully rebounded. When and whether this happens will be primarily determined by how much this is desired by China itself.
American Policy Plumbs New Lows
What the US desires, apparently, is to sell soybeans and Boeings. There’s no sign the loud Trump administration or quiet Congress has the nerve to respond to Chinese economic aggression in any meaningful way. This is not about inbound investment—the PRC’s acquisition of American farms, technology, autos, and so on has not been a major threat for years. Land buys near military bases should be prevented, and this is already being done at the state level.35 The Committee on Foreign Investment in the United States has successfully contained technical risks in inbound acquisitions. Moreover, China has easier prey in Europe and possibly Canada.36
But other American policies range from untested to possibly disastrous. Direct investment into the PRC rose modestly in 2025.37 American portfolio investment is heavily clouded by the Cayman Islands being the number one recipient. The corrected data, treating the Caymans as a transit point, appear only once a year and are not available yet for 2025.
A reason for concern is that portfolio investment in China skyrocketed during the first Trump administration. From 2017 to 2020, US holdings of Chinese portfolio securities rose by more than three-quarters of a trillion dollars.38 Congress acted in late 2025 to limit outbound investment in the PRC, but the executive controls implementation,39 and President Trump has been exceptionally accommodating to Xi.40 Parts of the American financial community want again to pour money in, and the president’s record of allowing money to support Chinese companies is alarming.
That might become a risk. America’s choice to be more dependent on China is already a serious risk. Given Trump’s relationship with Xi, the eventual tariff structure may favor the PRC, especially if the US-Mexico-Canada Agreement (USMCA) is downsized and transshipment continues to be ignored (with Vietnam perhaps soon the largest source of the trade deficit).41 Worse, the administration initially went back down the tariff road, ignoring years of warnings about vulnerable supply chains that started during Trump’s first term.42 The US failed to respond to the pandemic, conflated supply chains with simple output during the Biden administration,43 and was utterly unprepared for Beijing to squeeze US-based automakers on magnets. Six months into the second Trump administration, it had already retreated on tariffs.
Remarkably, the US is doing more of the same, in a more frightening way. As with magnets and other goods, the PRC has long been able to deny Americans important pharmaceuticals.44 In the past few years, US drugmakers have rushed to make matters worse, turning to China for drug testing in a way that transfers technology and creates higher future dependence.45 Congress is basically just talking; the administration is not even doing that.
Technology loss is hardly restricted to pharmaceuticals. The Trump administration has been trying, without success yet, to provide the PRC with better semiconductors than what its companies can make themselves.46 The claim this will keep China dependent on the US is laughable. It will instead cut directly against the supposed administration goal of leading the AI systems market. The PRC will continue to intensively develop its own chips, as with so many products before, while looking to any imported chips to improve its AI. The Biden administration embarrassed itself by offering an AI rule in January 2025, which was of course then dismissed by the Trump administration.47 The perpetrators behind repeated leaks in existing AI controls go unpunished.48
As bad as the US record on technology loss to China has been, new lows may be set in 2026. American companies, Congress, and even the administration itself have warned for months that multiple Chinese firms have been illegally training and continue to illegally train their AI models on American models.49 Nothing has been done in response. Obviously, the administration’s AI export claims are fraudulent in that light. The US has already started the process of ceding commercial leadership of what may be a transformative industry.
The PRC’s true 2020s investment and construction patterns, by country and sector, are worth studying for their international impact and information about Beijing’s priorities. For example, what minerals is the PRC chasing most? American firms may need to compete globally with Chinese firms for both minerals and refining capacity, more so if Trump ends up gutting USMCA.50 This would obviously matter to supply-chain vulnerabilities.
If he had ever thought of outcompeting China, Trump abandoned the idea by autumn 2025, praising bilateral relations even while he acceded to coercion.51 If Congress or next the president is willing to do better, these are the most important (economic) actions to take:
- Monitor the PRC’s outbound investment and construction for foreign policy reasons and potential economic clashes over partners and resources. Beijing has looked to secure what it needs from the world for two decades;52 the US should pay attention. A rising Chinese investment presence in Russia or Iran is an obvious possibility.
- Start the extended process of cutting China out of vital supply chains. Though it will take several years, pharmaceuticals are most important. This is a national security matter, and the Defense Production Act can effect difficult changes over time.
- Identify the most egregious Chinese violators of American intellectual property and treat them as international criminal entities (designated by the Department of the Treasury). It’s impossible to do so comprehensively, but any steps would have some deterrent effect.
- Tighten the export control regime. This should include outright export bans and mandatory punishment of all parties to export control violations.
- Ban American portfolio and direct investment in the PRC in advanced technology. Require breakdowns by industry of the nationality-corrected outbound investment portfolio data to see where the US is financing China’s development.
If Beijing wants more genuine investment, not just storage in Hong Kong or offshore financial centers, it will have to circumvent barriers to large acquisitions by its SOEs. The US nonetheless faces rising global competition, especially in metals. Winning is out of the question until America meets China’s bids for coercive leverage in supply chains and technology.
About the Author
Derek Scissors is a senior fellow at the American Enterprise Institute and the admittedly besieged creator of the China Global Investment Tracker.


