


Key takeaways
History offers perspective, not certainty. Corrections are not necessarily catastrophes.
Housing markets move in cycles.
Credit shapes property market confidence. Overheated markets carry greater risks.
Falling prices create future opportunities.
Panic rarely improves investment decisions.
Every so often, a housing market forecast comes along that deserves a second look.
Not because it is necessarily wrong, but because the comparison being made is rather extraordinary.
Last weekend, I read commentary suggesting Australia could be facing its worst housing downturn since the Great Depression.
Really?
Take a beat.
I have spent much of my working life studying Australian housing cycles. They rise, they fall, they overshoot and they correct. Sometimes quite sharply.
But the Great Depression was something else entirely.
So, rather than reach for another headline, I thought it worthwhile to revisit some history.
What does 120 years tell us?
The first chart tracks Australia’s estimated median dwelling resale value from 1906 to September 2026.
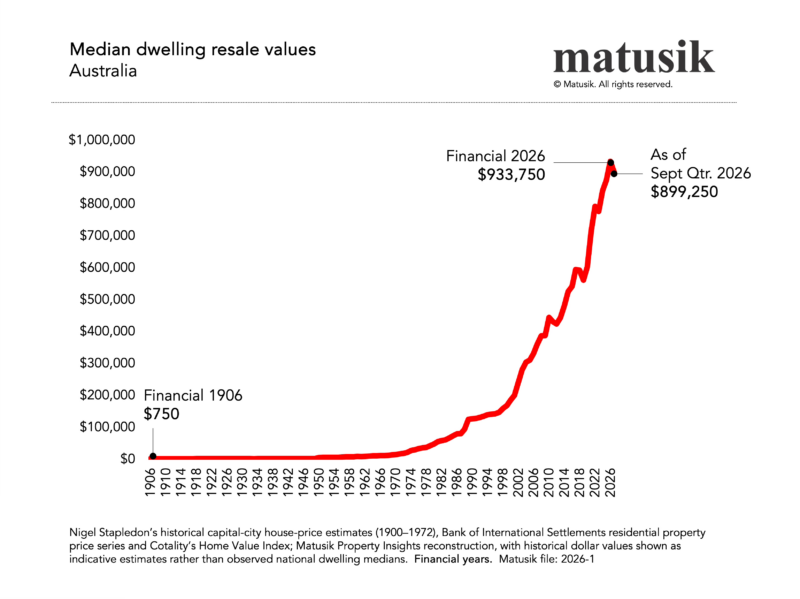
Over that period, the indicative median increased from just $750 to a peak of $933,750 in June 2026, before easing to approximately $899,250 in September.
The average annual change across the series was 6.6%.
And across the past 120 years, annual dwelling values fell in just 11 years. Roughly one year in ten.
In short, growth has been the prevailing condition.
But it has certainly not been uninterrupted.
What happened during the Great Depression?
The second chart shows annual changes in estimated dwelling resale values.
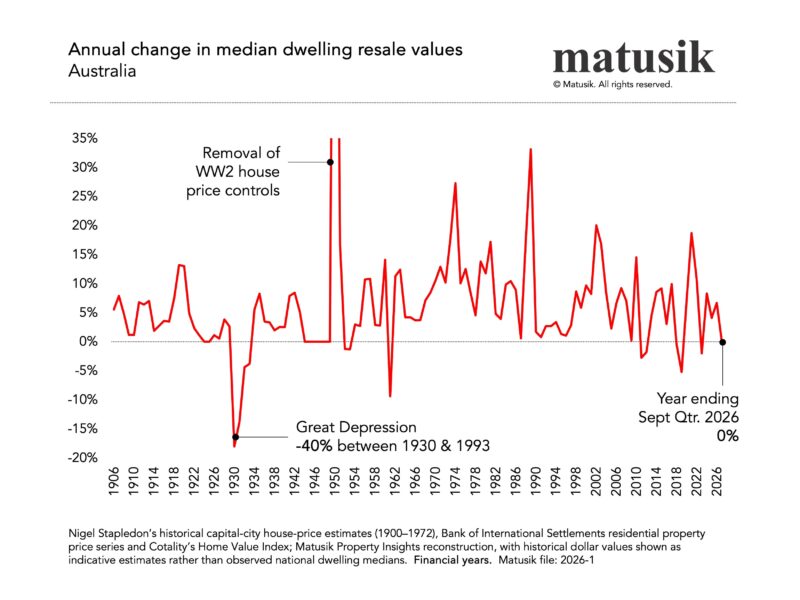
The chart shows that dwelling values declined by approximately 40% between 1930 and 1933.
Consider what accompanied that collapse.
Australia suffered a severe contraction in national income. Unemployment approached 30% on contemporary trade-union measures. Export prices collapsed. Credit became difficult to obtain. Wages and general prices fell.
Households were not simply postponing property purchases.
Many had lost their livelihoods.
That distinction matters.
What would a repeat look like today?
A 40% decline from the June 2026 median peak of $933,750 would wipe approximately $373,500 from the indicative national median.
It would fall to around $560,000. And that would take us back to what dwellings were reselling for about a decade ago.
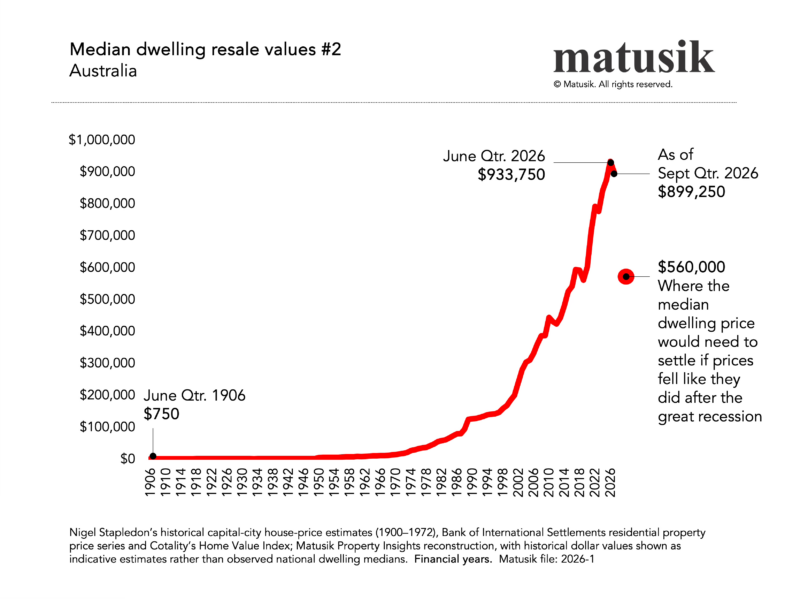
To contemplate that outcome over the next couple of years, I would expect several economic failures to coincide.
Unemployment would need to rise dramatically. Household incomes would contract. Mortgage arrears and forced selling would become widespread. Credit availability would deteriorate materially. Business failures would accelerate, while household and investor confidence collapsed.
A prolonged recession, potentially accompanied by financial-system stress, would be a much more plausible setting for such an outcome.
That is not my central forecast.
Where I think we are heading
I expect Australian dwelling values could fall by 10% to 15% in total from their recent peaks.
Some markets will fare worse.
Southeast Queensland, in particular, looks exposed after several years of exceptional price growth. Perth also deserves watching.
My outlook incorporates six quarter-point interest-rate increases this tightening cycle, five of which have now occurred, together with an extended period of economic stagnation and potentially a mild recession.
For context, Commonwealth Bank economists have just revised their forecasts, anticipating a 14% national decline and falls of approximately 18% in Brisbane and Perth, with stabilisation during the second half of 2027.
That is broadly consistent with my thinking.
It is also a long way from the Great Depression.
My two bobs worth
I am not suggesting the housing correction is over. Quite the opposite.
Higher borrowing costs, stretched household budgets, weaker confidence and the retreat of speculative buying have further to play out.
I also believe the May Budget changes accelerated a housing market correction that was already underway, rather than being its principal cause. As I wrote at the time, the changes were the straw that broke the camel’s back, not the weight the camel had been carrying all along.
Moreover, now that more reliable resale settlements are emerging, I will begin examining what is actually happening across individual markets over the coming weeks.
In early December, I also plan to publish another Matusik Deep Dive for paid subscribers, examining current market conditions and my outlook for calendar 2027.
There will be markets to avoid, others worth watching and opportunities created by the downturn.
But perspective matters.

Note: A housing correction is not necessarily a housing collapse. And a recession is not automatically another Great Depression.
Sometimes the most useful thing we can do is take a beat, study the evidence and resist the temptation to confuse a difficult cycle with an economic catastrophe.