

Both violent and property crime are far below their 1990s peak, but some crimes see periodic rises.
We all want to live somewhere we feel safe.
Crime is clearly a concern for many people. Nearly 60% of Americans say that reducing crime should be a top priority for the US president and Congress.1 A similar share says that violent crime is very important when making decisions about which political candidates to vote for.
Tracking crime rates is crucial to understanding whether strategies to reduce offenses are effective and for identifying areas of concern.
Unfortunately, the quality of crime data is often too poor to get a clear perspective of changes over the long term and to compare rates between countries.
This is true even for the crime with the most complete coverage, homicide.2 Comparisons are even more complicated for less severe crimes.
However, a few countries have higher-quality and longer-term estimates.
In this article, we’ll focus on the United States. The dataset published by the FBI goes back to 1979, giving us an almost 50-year perspective on how crime has changed.3 Since not all crimes are recorded, and reporting methodologies can change over time, the FBI produces a dataset that attempts to adjust for this. That means this data might be slightly different from the raw reported crime figures that you see elsewhere.
Several crimes fall within the category of violent crimes. In US statistics, this includes homicide (murder and non-negligent manslaughter), rape, robbery, and aggravated assault.4
In the chart below, you can see national rates of violent crime since 1979. This is measured as the number of offenses per 100,000 people.5
Violent crime rates increased during the 1980s, reaching a peak in the early 1990s at around 750 offenses per 100,000. Since then, rates have more than halved. Over the past three decades, rates have fluctuated slightly from year to year, but the overall trend has been downward.

Has this decline been the result of a drop in a specific type of violent crime, or have rates fallen across all categories?
In this second chart, you can again see the aggregate measure of violent crime rates, alongside the specific rates for homicide, aggravated assault, and violent robbery.
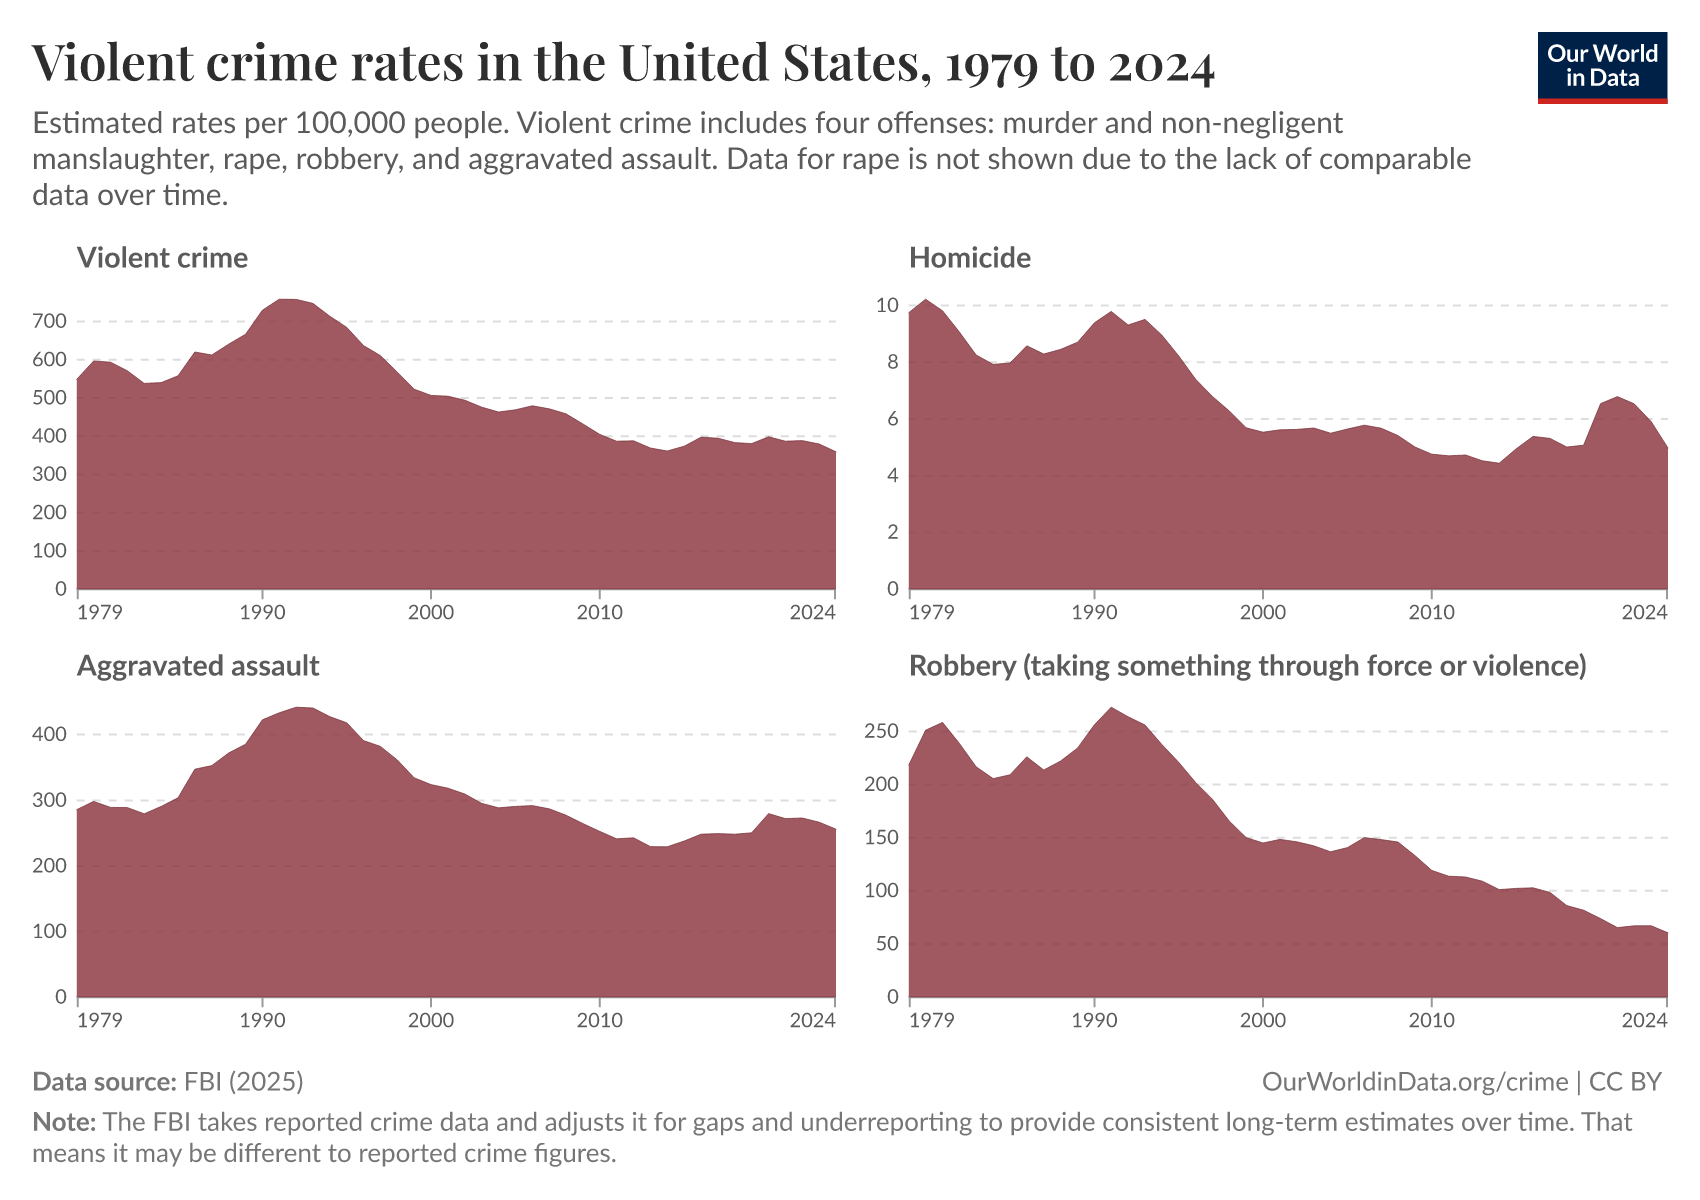
The first thing to notice is the differences in scale on the y-axis. Homicides are far less common than assaults or robberies.
But overall, there is a fairly consistent pattern across these crimes over these 50 years. Rates peaked in the early 1990s (although homicide and robbery rates were already high through the 1980s) and have seen a substantial decline since then. Homicide rates have approximately halved; aggravated assaults have dropped by 40%; and robberies by almost 80%.
Again, there is some variability over this period. Homicide and assault rates increased in 2020 and 2021, but have since fallen again.
Data on rape and sexual assault
In 2013, the FBI changed its definition of rape in its Uniform Crime Reporting Program. This was the first time it had done so in its 80-year history for a Part 1 offense. That means the data is not comparable over the entire 50-year period.
The legacy definition of rape was narrower in scope. It was defined as the “carnal knowledge of a female forcibly and against her will”. In other words, the forceful penetration of a woman against her consent. It did not include male victims, nor did it include other sexual assault offenses.
The revised definition is broader in two ways. First, it includes male and non-binary victims. Second, it includes other sexual assault crimes, including oral and anal sex against someone’s consent, and sexual assault with an object.
We have plotted both series — using the older, legacy definition, and the revised definition — in the chart below.
You can see that there is data available for both the legacy and revised definitions for several years. During those years, rape rates are, as we’d expect, higher in the revised definition, since it includes a broader set of victims and crimes.

The FBI published a breakdown of how the number of these crimes varied in 2013, using both the legacy and revised definitions. The number of rapes — defined as forcible penetration — with female victims was the same: 26,994 in each. But the count under the revised definition additionally included 611 cases of rape of male victims, 7,602 cases classified as “sodomy” (oral or anal sexual intercourse without consent), and 3,043 counts of “sexual assault with an object”.
This change in definition means we cannot get a complete understanding of how rape rates have changed since 1979. But the data does show that rape of women (using the narrower definition) became less common from a peak in the early 1990s, through to the early 2010s. After that point, rates start to climb slightly. The revised definition shows an increase to 2020, before falling back to rates equivalent to the mid-2010s.
What about non-violent crimes? These tend to fall under the banner of property crimes. Property crimes involve the stealing, damage, or destruction of someone’s property. This includes offenses such as burglary, larceny (which is more like pickpocketing, and without breaking and entering), theft, and arson.
In the chart below, you can see how property crime rates have changed over the past half-century.
The trend is similar to what we saw for violent crime. Rates were high throughout the 1980s and into the early 1990s, but have fallen by 60% in the last 30 years. Unlike violent crime rates, there has been less variability from year to year, resulting in a fairly consistent downward trend.
At the peak, there were around 5,000 offenses per 100,000 people. That’s one for every 20th person in the population, each year. Since then, it has fallen to fewer than 1 per 50 people.

Again, the chart below looks at trends for different types of property crime.6 Larceny and burglary have mirrored the steady decline since the 1990s.
Motor vehicle theft has been on a bumpier road, with a more distinct peak around the 1990s, a rebound in the early 2000s, and a smaller uptick in rates over the last five years. To put these numbers in absolute terms: in 1991, around 1.7 million vehicles were stolen in the United States. In recent years, that number has fluctuated between 700,000 and 1 million.

The overall trend in both violent and property crimes has been downward over the last 30 years. Americans in the 1990s were at least twice as likely to be victims of crime as they are today. This is also true at a global level. While we don’t have consistent data on theft and assaults, we see that global homicide rates have gone down in recent decades.
This is not necessarily how the public perceives it.
The polling agency Gallup has conducted numerous surveys asking Americans how they perceive changes in crime rates since 1993. In 23 out of the 27 annual surveys, the majority said that they believed crime rates had increased from the previous year.
Americans in the 1990s were at least twice as likely to be victims of crime as they are today.
It is not true that crime has fallen every year; there have been periods of elevated rates along the way. The start of the 2020s is a clear example. But rates in most years have indeed been lower than in the previous year. Most of the time, the popular perception was therefore at odds with the data.
One reason why people often think that crime is rising is that they constantly see individual events on the news.7 As we showed in a recent article, homicides dominate coverage related to causes of death in leading news outlets across the political spectrum. Homicides received 40% to 50% of “causes of death” coverage, despite making up less than 1% of deaths.
This disconnect between perceptions and the reality of crime rates is understandable. It’s impossible to get a sense of the broader changes in crime from individual stories alone. To get a sense of perspective, we need to step back and look at consistent data over time.
Cite this work
Our articles and data visualizations rely on work from many different people and organizations. When citing this article, please also cite the underlying data sources. This article can be cited as:
Hannah Ritchie and Fiona Spooner (2026) - “How have crime rates in the United States changed over the last 50 years?” Published online at OurWorldinData.org. Retrieved from: 'https://archive.ourworldindata.org/20260304-094028/us-crime-rates.html' [Online Resource] (archived on March 4, 2026).BibTeX citation
@article{owid-us-crime-rates,
    author = {Hannah Ritchie and Fiona Spooner},
    title = {How have crime rates in the United States changed over the last 50 years?},
    journal = {Our World in Data},
    year = {2026},
    note = {https://archive.ourworldindata.org/20260304-094028/us-crime-rates.html}
}
Reuse this work freely
All visualizations, data, and code produced by Our World in Data are completely open access under the Creative Commons BY license. You have the permission to use, distribute, and reproduce these in any medium, provided the source and authors are credited.
The data produced by third parties and made available by Our World in Data is subject to the license terms from the original third-party authors. We will always indicate the original source of the data in our documentation, so you should always check the license of any such third-party data before use and redistribution.
All of our charts can be embedded in any site.


