

Key points
-
For control of the House of Representatives, Democrats currently have
the momentum. For the Senate, it’s a closer call. -
“The economy, stupid” still rings true today as voters seem fixated on
cost of living. AI data centre buildouts are also drawing ire. -
Regarding political party control of Congress, RBC Capital Markets
equity analysts see little overall impact on S&P 500 sectors. But
there are nuances if Democrats win the House and Senate, especially
for Consumer Staples and Utilities. -
Even if U.S. stock market volatility rises in the near term, we
believe other issues matter more to the market’s medium- and long-term
performance than elections, including Fed policy and innovation.
House control could flip
Less than two months away from the midterm election on Nov. 3,
multiple polls and other indicators point toward the Democrats winning
control of the House of Representatives.
Republicans currently hold a slim 218–214 majority; one Independent
caucuses with Republicans and two seats are vacant. Despite all 435 seats
being up for grabs and the lowest number of incumbents running for
reelection since records have been kept in 1930, only 42 seats are in
contention (defined as “toss up,” or “lean Democratic” or “lean
Republican”), according to poll aggregator 270toWin.
To retain House control, Republicans would need to defy history. Since
1906, the president’s party has added House seats in only three of the
past 30 midterm elections, and those additions were skimpy, ranging from
only five to nine seats.
The
track record for the president’s party
was worse when presidential approval was below 50 percent. President
Donald Trump’s job rating currently stands at 39.6 percent, according to
the RealClear Polling (RCP) average of 11 polls.
Importantly, Democrats have a 5.8 percentage point advantage in the
“generic ballot” poll, RCP’s aggregated data indicates.
Generic party preference polling for Congress tilts Democratic
Poll respondents were asked which of the two major political parties they
preferred (a.k.a. “generic party preference”) in the upcoming midterm
Congressional elections, without indicating specific candidates.
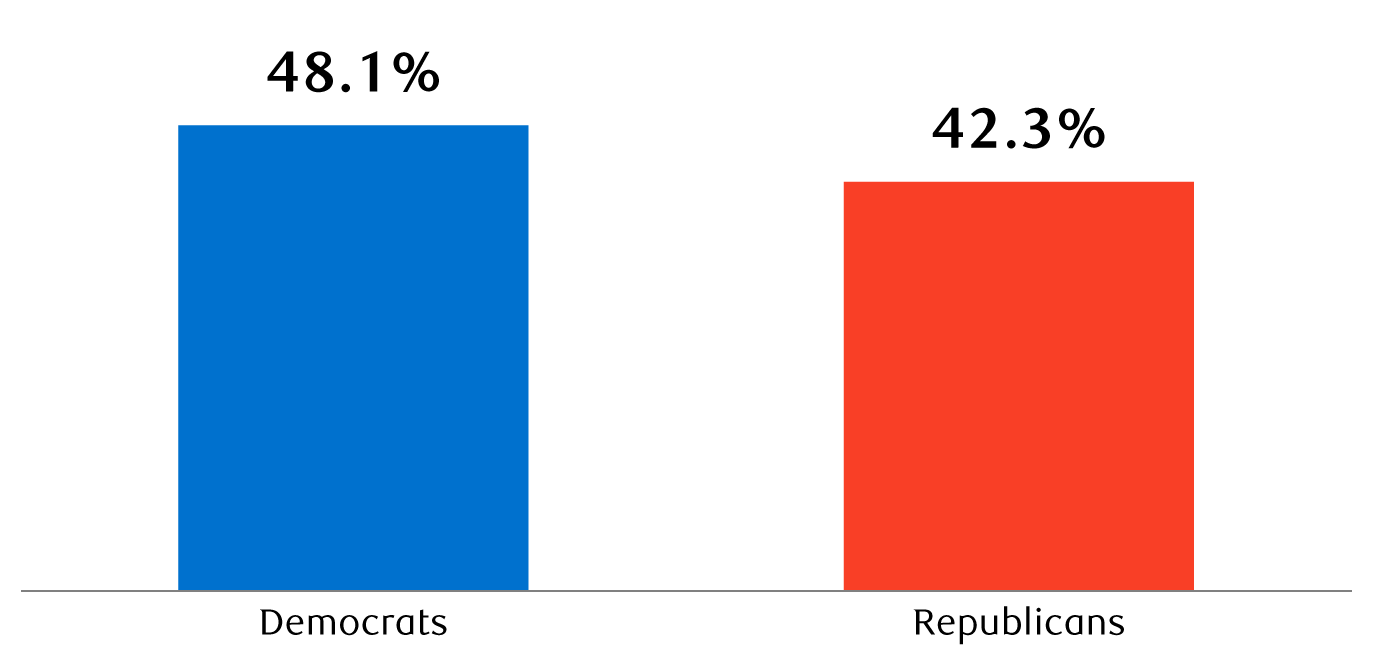
The RealClear Polling averages shown here represent an aggregate
of 15 independent poll results. Because the results of individual
polls are independent of one another, scores for Democrats and
Republicans may not add up to 100%.
Source – RealClear Polling (RCP) averages; polling data gathered
from July 22 through Sept. 2, 2026
The bar chart shows generic ballot poll results for the 2026 U.S.
midterm elections by political party preference. 48.1% of
respondents would vote for a Democrat and 42.3% would vote for a
Republican.
There are caveats to what seem like Democrats’ advantages, however.
Republican campaign structures lead their Democratic counterparts in
funding and Elon Musk, the world’s wealthiest man and first trillionaire,
financially backs the Grand Old Party (GOP).
In addition, pollsters could be underestimating Republicans’ recent
election cycle “get out the vote” successes and the president’s ability to
mobilize supporters. The impact of gerrymandering (redrawing districts to
suit political objectives) and GOP efforts to change voting rules in
certain states is also difficult to gauge.
Senate control unpredictable
While the Senate power balance seems close at this stage, control of the
upper chamber could conceivably flip to the Democrats as well—an unlikely
prospect earlier this year.
Republicans hold a 53 to 47 seat majority, and they need 50 seats to
maintain power given the vice president’s constitutional role as the tie
breaker. In other words, Democrats need to flip four Senate seats to gain
control.
Among the 35 of 100 Senate seats up for election in November (including
two that will be decided by special elections), 11 are considered “safe”
Republican seats, nine are labelled “safe” Democratic seats, and 15 seats
are in play (either toss up or likely/leaning toward one party or the
other), according to 270toWin. The six toss-up states are currently Texas,
Maine, Ohio, Iowa, Alaska and Michigan.
Voters laser-focused on cost of living
The most famous words in modern American politics, “the economy, stupid,”
coined 34 years ago, still apply today. That phrase was marked on a
whiteboard by James Carville, then-Governor Bill Clinton’s aggressive and
colourful presidential campaign manager, to keep the campaign focused on
what mattered the most to voters.
Today, inflation is the most important overall issue and economic issue,
according to The Economist’s tracking poll based on YouGov data.
Blame for the high cost of living is mainly falling on the party in power
and President Trump specifically.
The Consumer Price Index (CPI) year-over-year inflation rate has risen to
3.4 percent from 2.9 percent on Inauguration Day in Jan. 2025, despite
campaign promises to reduce inflation.
Cost-of-living angst has been renewed by the spring 2026 inflation
resurgence sparked by the U.S./Israeli military attacks on Iran, near halt
to Strait of Hormuz shipping, subsequent constraints on Red Sea oil
shipments and the related energy price spikes.
Even if inflation comes down to the Federal Reserve’s target rate of two
percent next year, we think Americans’ attitudes about the cost of living
will remain sour for quite some time.
Cumulative consumer prices are about 28 percent higher today, on average,
than they were in early 2020, just before the COVID-19 crisis began. The
population needs more time to absorb and adjust to this large price spike,
in our view.
In previous inflation waves in the mid-1970s and early 1980s (granted,
bigger inflation episodes), unease and fears about inflation lasted much
longer than was rational in hindsight, into the mid-1990s. All the while
inflation rates declined dramatically during that period.
We think the cost of living will once again be among the top voter issues
during the 2028 presidential election regardless of whether consumer
inflation data comes back down to the Fed’s target by then. Most voters
care more about the prices they see at the grocery store than what the
government reports as year-over-year inflation data.
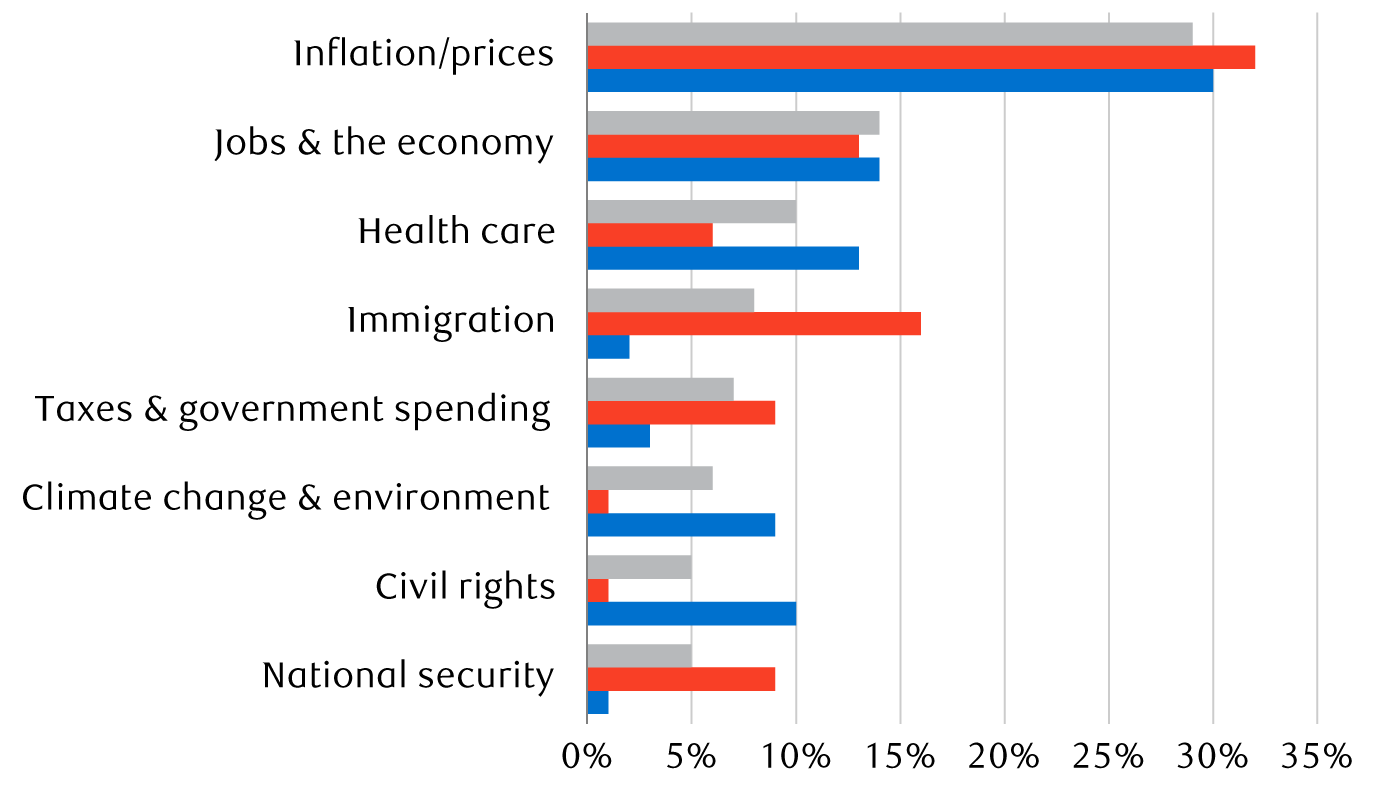
Inflation is the most important issue to Americans
Top issues of concern to adults ranked in order
-
All voters
-
Republicans
-
Democrats
Issues ranked by the “All voters” category, which includes
Republicans, Democrats and others. Three additional issues
registered smaller proportions than national security: abortion,
education and civil liberties.
Source – The Economist, “Tracking the presidency,” which tracks
YouGov polling, as of 9/1/26
The bar chart shows the top eight issues of concern for American
adults as of September 1, 2026 according to YouGov polling, with
each issue shown in three groups: All voters, Republicans, and
Democrats; the results are ranked in order by the “All voters”
category. The issue of greatest concern is inflation: 29% for all
voters, 32% for Republicans, and 30% for Democrats. For other
issues, the responses for each of the three categories are listed in
the same order. The second issue of concern is jobs and the economy:
14%, 13%, 14%. Health care is third: 10%, 6%, 13%. Immigration is
fourth: 8%, 16%, 2%. Taxes and government spending is fifth: 7%, 9%,
3%. Climate change and environment is sixth: 6%, 1%, 9%. Civil
rights is seventh: 5%, 1%, 10%. National security is eighth: 5%, 9%,
1%.
AI data centres drawing “NIMBY” ire
An issue that does not show up as being among the most important in
polling data may end up impacting some statewide and local races, and
possibly even a small number of House and Senate races: the buildout of AI
data centres. Over the past year, opposition has mounted.
From an investment perspective, AI and the related infrastructure buildout
have been extremely positive stories since AI technology took off in late
2022.
However, the permitting and construction of AI data centres is
increasingly being opposed in local communities and even on a statewide
level, in some cases. Public opinion polls indicate that Americans
overwhelmingly oppose having data centres built in their communities or
nearby mainly due to concerns about higher electricity and water prices
and potential noise implications. The anti-AI data centre attitude
prevails regardless of political affiliation, gender, income, age, etc.
It’s what Americans call a NIMBY issue: Not In My Backyard!
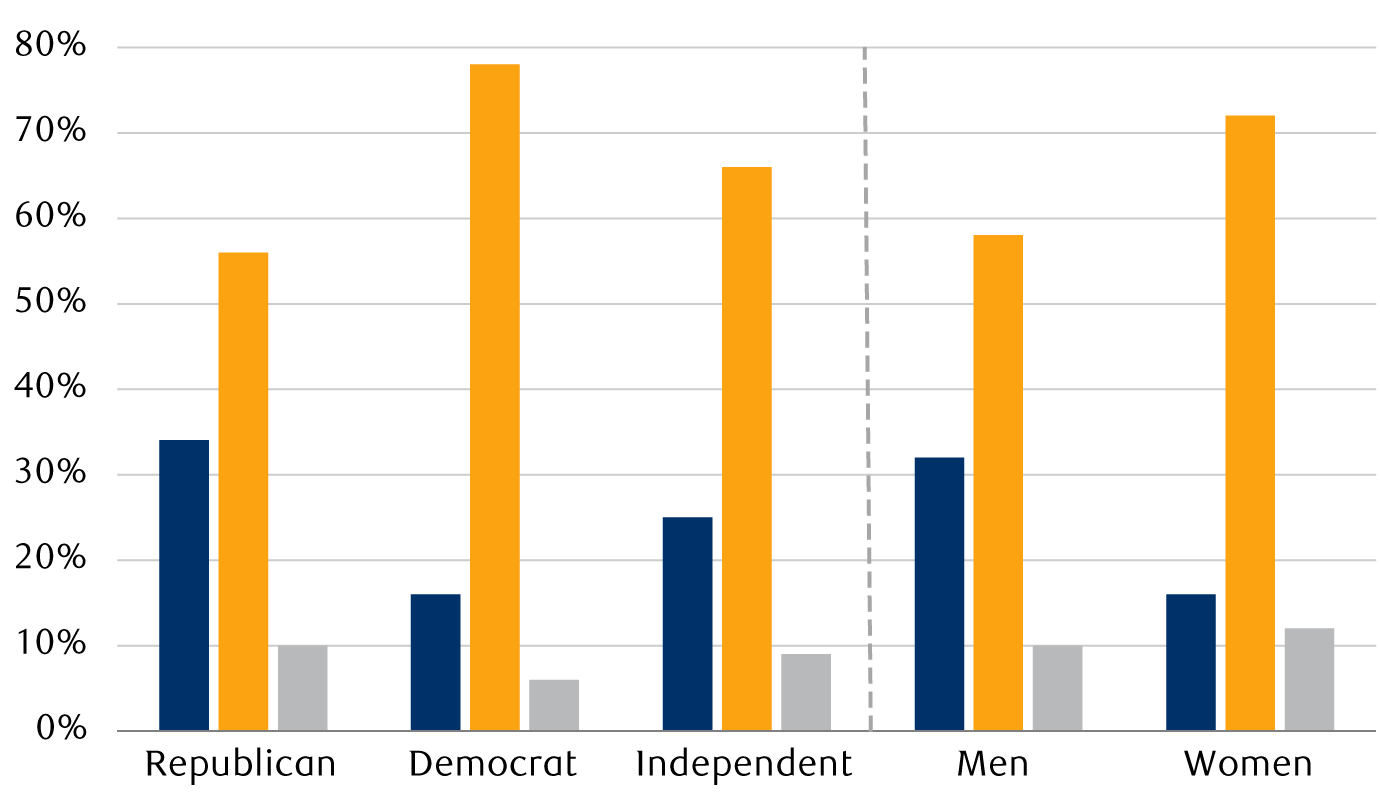
Opposition to AI data centres is widespread
Poll question: Would you support or oppose the building of an AI data
centre in your community?
-
Support
-
Oppose
-
Don’t know/NA
Source – Quinnipiac University poll of American adults; data
published in March 2026
The bar chart shows how American adults responded to a poll question
on whether they would support an AI data centre being built in their
communities. Responses are divided into three categories: support,
oppose, or don’t know/not applicable. The data is shown by political
party affiliation (Republican, Democrat, and Independent) and
gender. Republicans have the highest support for data centres at
34%, and 32% of men would support construction of a data centre.
Support among Democrats, Independents, and women is lower. The level
of opposition to AI data centres is high for all categories, with
Democrat opposition the highest at 78% compared to Republican
opposition at 56% and Independents at 66%. More women (72%) than men
(58%) oppose data centres.
Many Americans, like others around the world, are also concerned that AI
will displace jobs. This too is reflected by all age groups, and when the
data are sliced and diced into other categories such as political
affiliation, race, income bracket and gender, according to Quinnipiac
polling.
Does party control matter for S&P 500 sectors?
Despite voter anxiety about AI and economic issues, and the increasing
likelihood that party control could shift partially or fully in the next
Congress, RBC Capital Markets, LLC’s equity analysts don’t foresee much
impact on their industries under coverage, according to a study by the
firm’s Head of U.S. Equity Strategy Research Lori Calvasina.
When all sectors are combined, the analysts forecast a modestly positive
performance bias if Republicans retain control of both chambers, a neutral
impact if Democrats win the House and Republicans maintain the Senate
majority, and a modestly negative performance bias if Democrats win
control of both chambers.
RBC equity analysts see a small range of potential market impacts
RBC Capital Markets equity industry analysts’ combined assessment of 2026
midterm election scenarios for Congressional control
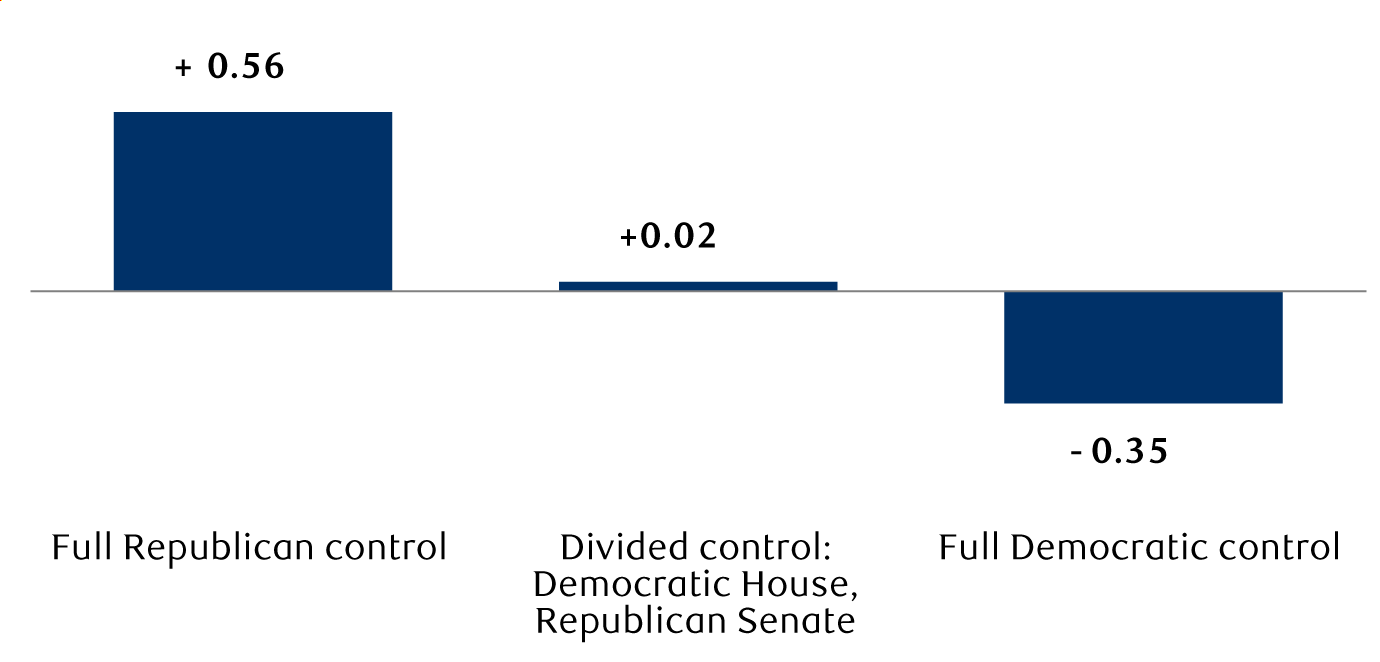
The RBC equity analyst survey points to a modestly positive
performance bias for stocks in a Republican control scenario (due
to views of friendlier regulation), a neutral view in a Democratic
House / Republican Senate scenario and a modestly negative
performance bias for stocks in a Democratic control scenario.
A higher number is generally more constructive, a lower number
generally more negative. Scale is +2.00 (very bullish) to -2.00
(very bearish).
Source – RBC U.S. Equity Strategy, RBC Capital Markets based on a
survey of industry analysts; results published on 8/11/26
The bar chart shows RBC Capital Markets equity industry analysts’
combined assessment of how three different scenarios of
Congressional control after the 2026 midterm election could impact
the U.S. equity market on a scale of +2.00 (very bullish) to -2.00
(very bearish). This reflects a combination of all sector
assessments. In the full Republican control scenario, the assessment
is +0.56%. In the divided control scenario where the Democrats
control the House and Republicans control the Senate, the assessment
is +0.02. In the full Democratic control scenario, the assessment is
-0.35.
But there are nuances associated with the latter scenario. While the
overall assessment is slightly negative for Democrats winning the House
and Senate, viewpoints vary by sector.
For example, there is a positive assessment for the Consumer Staples
sector, a very bearish assessment for the Utilities sector, and variation
in between with most sectors scoring slightly negatively, as the chart
below shows.
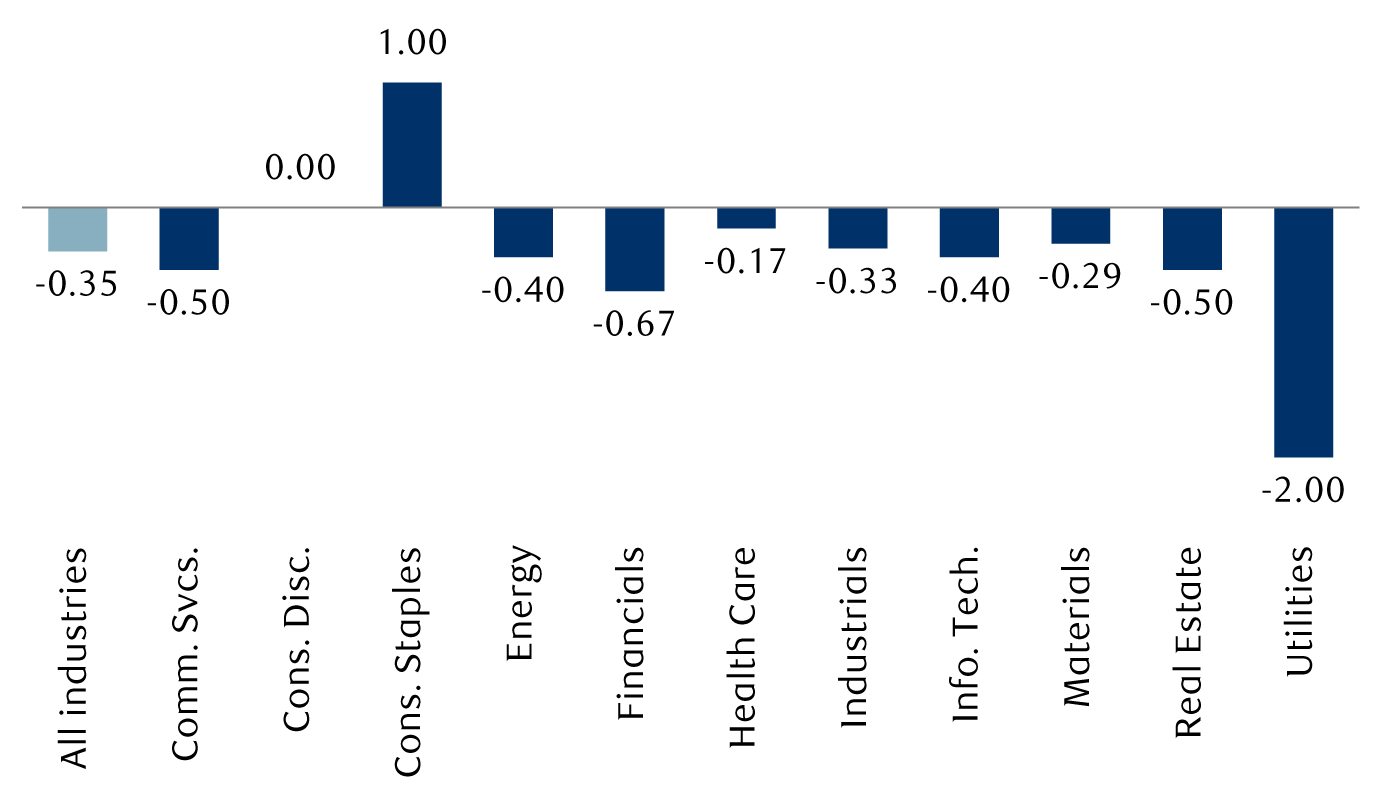
RBC equity analysts see full Democratic control of Congress as modestly
negative for all industries combined, but there are differences by sector
RBC Capital Markets equity industry analysts’ assessment of Democratic
control of the House and Senate
A higher number is generally more constructive, a lower number
generally more negative. Scale is +2.00 (very bullish) to -2.00
(very bearish).
Source – RBC U.S. Equity Strategy, RBC Capital Markets; based on
industry analyst survey results published 8/11/26
The bar chart shows RBC Capital Markets equity industry analysts
assessments’ of S&P 500 sector implications if the Democrats win
control of the U.S. House of Representatives and Senate. The scale
is +2.00 (very bullish) to -2.00 (very bearish). The figure for “all
industries” is -0.35. Figures are provided for each of the 11 S&P
500 sectors. The two that stand out the most are Consumer Staples at
+1.00 (the largest positive sector impact) and Utilities at -2.00
(the largest negative impact). Consumer Discretionary is 0.00. All
other sector impacts are moderately negative, ranging from -0.17 for
Health Care to -0.67 for Financials. Communications Services and
Real Estate impacts are assessed at -0.50.
Perhaps this explains one reason the Utilities sector has sold off
7.4 percent since late July, at the same time the S&P 500 has risen
4.1 percent—significant underperformance in such a short timeframe. The
“NIMBY” attitude about AI data centres could be contributing to concerns
about increased Utilities sector regulations should Democrats win both
chambers. Also, we think the sector has traded lower because bond yields
have jumped; the latter is considered a competing investment.
The sector details associated with all three midterm election scenarios
are shown in the table below with red representing Republicans retaining
control, purple indicating divided control and blue representing
Democrats winning the House and Senate.
RBC equity analyst survey results based on three midterm election
scenarios, by sector
| S&P 500 sectors | Full Republican control |
Divided control: Democratic House, Republican Senate |
Full Democratic control |
|---|---|---|---|
| Communication Services | 0.5 | 0 | -0.5 |
| Consumer Discretionary | 0.14 | -0.14 | 0 |
| Consumer Staples | -1 | 0 | 1 |
| Energy | 0.8 | 0.2 | -0.4 |
| Financials | 1 | 0 | -0.67 |
| Health Care | 0 | 0.5 | -0.17 |
| Industrials | 0.78 | -0.11 | -0.33 |
| Information Technology | 0.8 | -0.2 | -0.4 |
| Materials | 0.29 | 0 | -0.29 |
| Real Estate | 0.5 | 0 | -0.5 |
| Utilities | 2 | 0 | -2 |
A higher number is generally more constructive, a lower number generally
more negative. Scale is +2.00 (very bullish) to -2.00 (very bearish).
Source – RBC U.S. Equity Strategy, RBC Capital Markets; based on
industry analyst survey results published 8/11/26
Note that for this survey’s scale, the very bullish reading is +2.0 and
the very bearish reading is -2.0. The overwhelming proportion of the
designations are not close to those extremes, and this is relevant from a
portfolio-positioning perspective. We don’t think individual investors
with a long-term time horizon should make major sector changes in
anticipation of or because of the election outcome.
For portfolio construction, focus on what matters more
Typically, midterm election years bring volatility with them. It’s common
for the S&P 500 to pull back notably at some point in the year
preceding the election, and if it doesn’t, a pullback can happen right
after the election.
The S&P 500 has experienced an average 21 percent correction
surrounding midterm election years since 1934, as we pointed out in
this report.
Given the market already endured a brief nine percent pullback last
spring, this begs the question: has the usual midterm election-year
performance hiccup been satisfied? Maybe, but we can’t exclude the
possibility that another pullback could occur, especially if the Strait of
Hormuz remains largely closed, Treasury yields continue to rise due to
inflation risks and/or outright angst materializes surrounding the midterm
elections.
In the 2018 midterm election year, during Trump 1.0 when Republicans lost
the House to the Democrats, a sharp selloff occurred right after the
election—which was rare. In the 2022 midterm year, the low point for the
market occurred in mid-October, just ahead of the election. Republicans
narrowly took back House control, although the number of seats gained was
far less than pollsters expected.
Regardless of whether the midterm mindset seeps further into the U.S.
stock market and volatility rises in the near term, we firmly believe
other issues matter more to the market’s medium- and long-term performance
than elections:
- Corporate innovation trends
- The Federal Reserve’s monetary policy decisions
- The natural ebb-and-flow of the business cycle and economy
- Related corporate earnings trends
For additional thoughts about historical equity market performance
surrounding midterm elections, and what this might be—or might not
be—suggesting for this year and next, see our article titled, “Midterms, the market and what matters.”
The market has battled through multiple challenges that were much greater
than any election
S&P 500 Index performance and key events
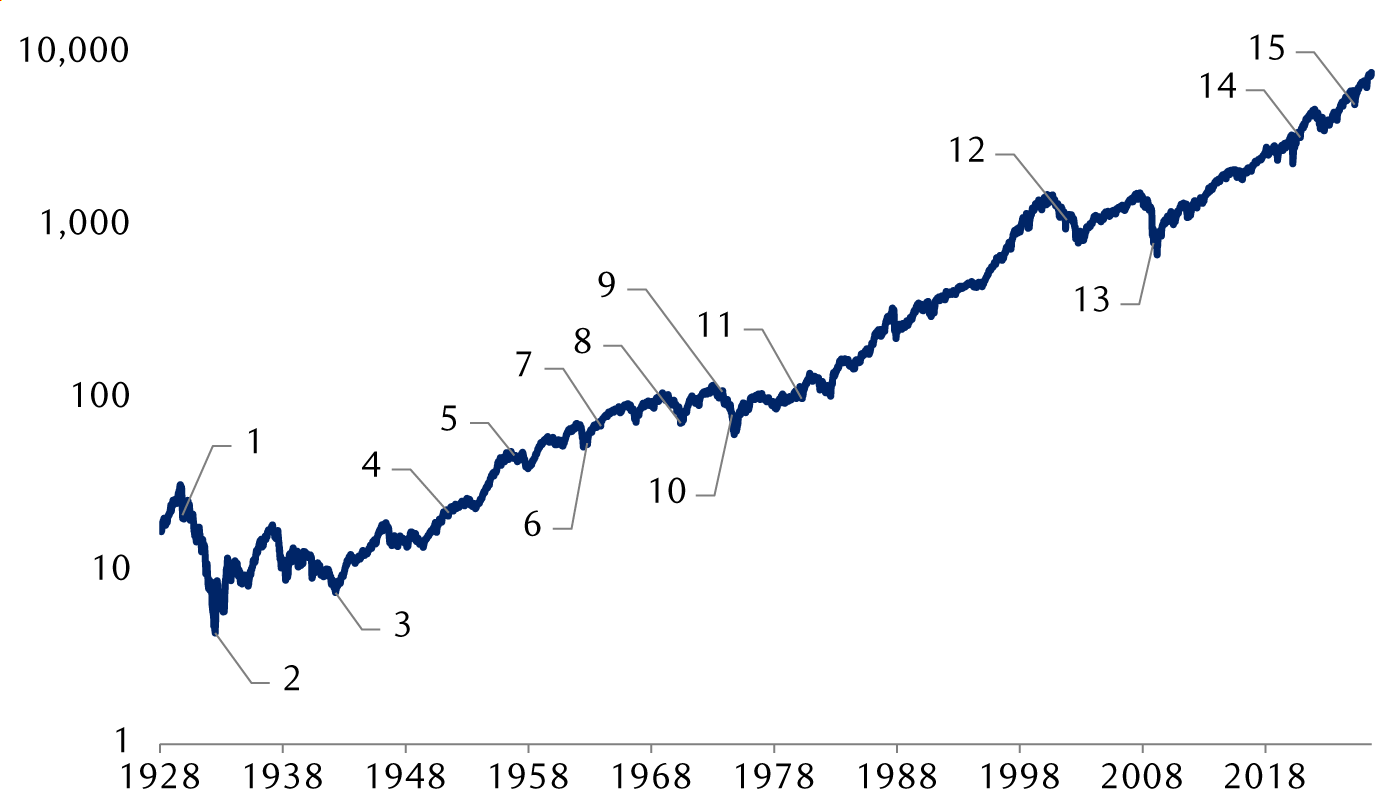
- Black Tuesday (1929)
- Great Depression (1929–1939)
- Second World War (1939–1945)
- Korean War (1951–1953)
- Suez Canal crisis (1956)
- Cuban Missile Crisis (1962)
- Kennedy assassinated (1963)
- Vietnam War (1964–1973)
- Arab oil embargo (1973)
- Nixon resigns (1974)
-
Oil crisis and Middle East instability (1979–1980);
inflation peaks at 14.8 percent - Tech Bubble bursts (2000–2002)
- Global Financial Crisis (2008)
- COVID-19 (2020)
- Ultra-high tariffs (2025)
Source – RBC Wealth Management, RBC Rochdale, Bloomberg; weekly
price data from 1/1/28 through 8/28/26 shown in logarithmic scale.
This is a line chart of the S&P 500 weekly data from 1928 to August
28, 2026 shown on a logarithmic scale. The chart highlights
significant historical events, starting with Black Tuesday (1929),
the Great Depression (1929 to 1939), Second World War (1939 to 1945),
the Suez Canal Crisis (1956), the Cuban Missile Crisis (1962),
President Kennedy’s assassination (1963), the Vietnam War (1964 to
1973), the Arab oil embargo (1973), President Nixon’s resignation
(1974), and the oil crisis and Middle East instability (1979 to
1980) when inflation peaked at 14.8%. In the era since 2000, the
following events are shown: the bursting of the Tech Bubble (2000 to
2002), the Global Financial Crisis (2008), the COVID-19 pandemic
(2020), and the introduction of ultra-high U.S. tariffs (2025).
Overall, the market has continued to advance despite short-term
negative impacts associated with these events.
RBC Wealth Management is a business segment of Royal Bank of Canada. Please click the “Legal” link at the bottom of this page for further information on the entities that are member companies of RBC Wealth Management. The content in this publication is provided for general information only and is not intended to provide any advice or endorse/recommend the content contained in the publication.
® / ™ Trademark(s) of Royal Bank of Canada. Used under licence. © Royal Bank of Canada 2026. All rights reserved.
Vice President, Portfolio Analyst
Portfolio Advisory Group – U.S.


