

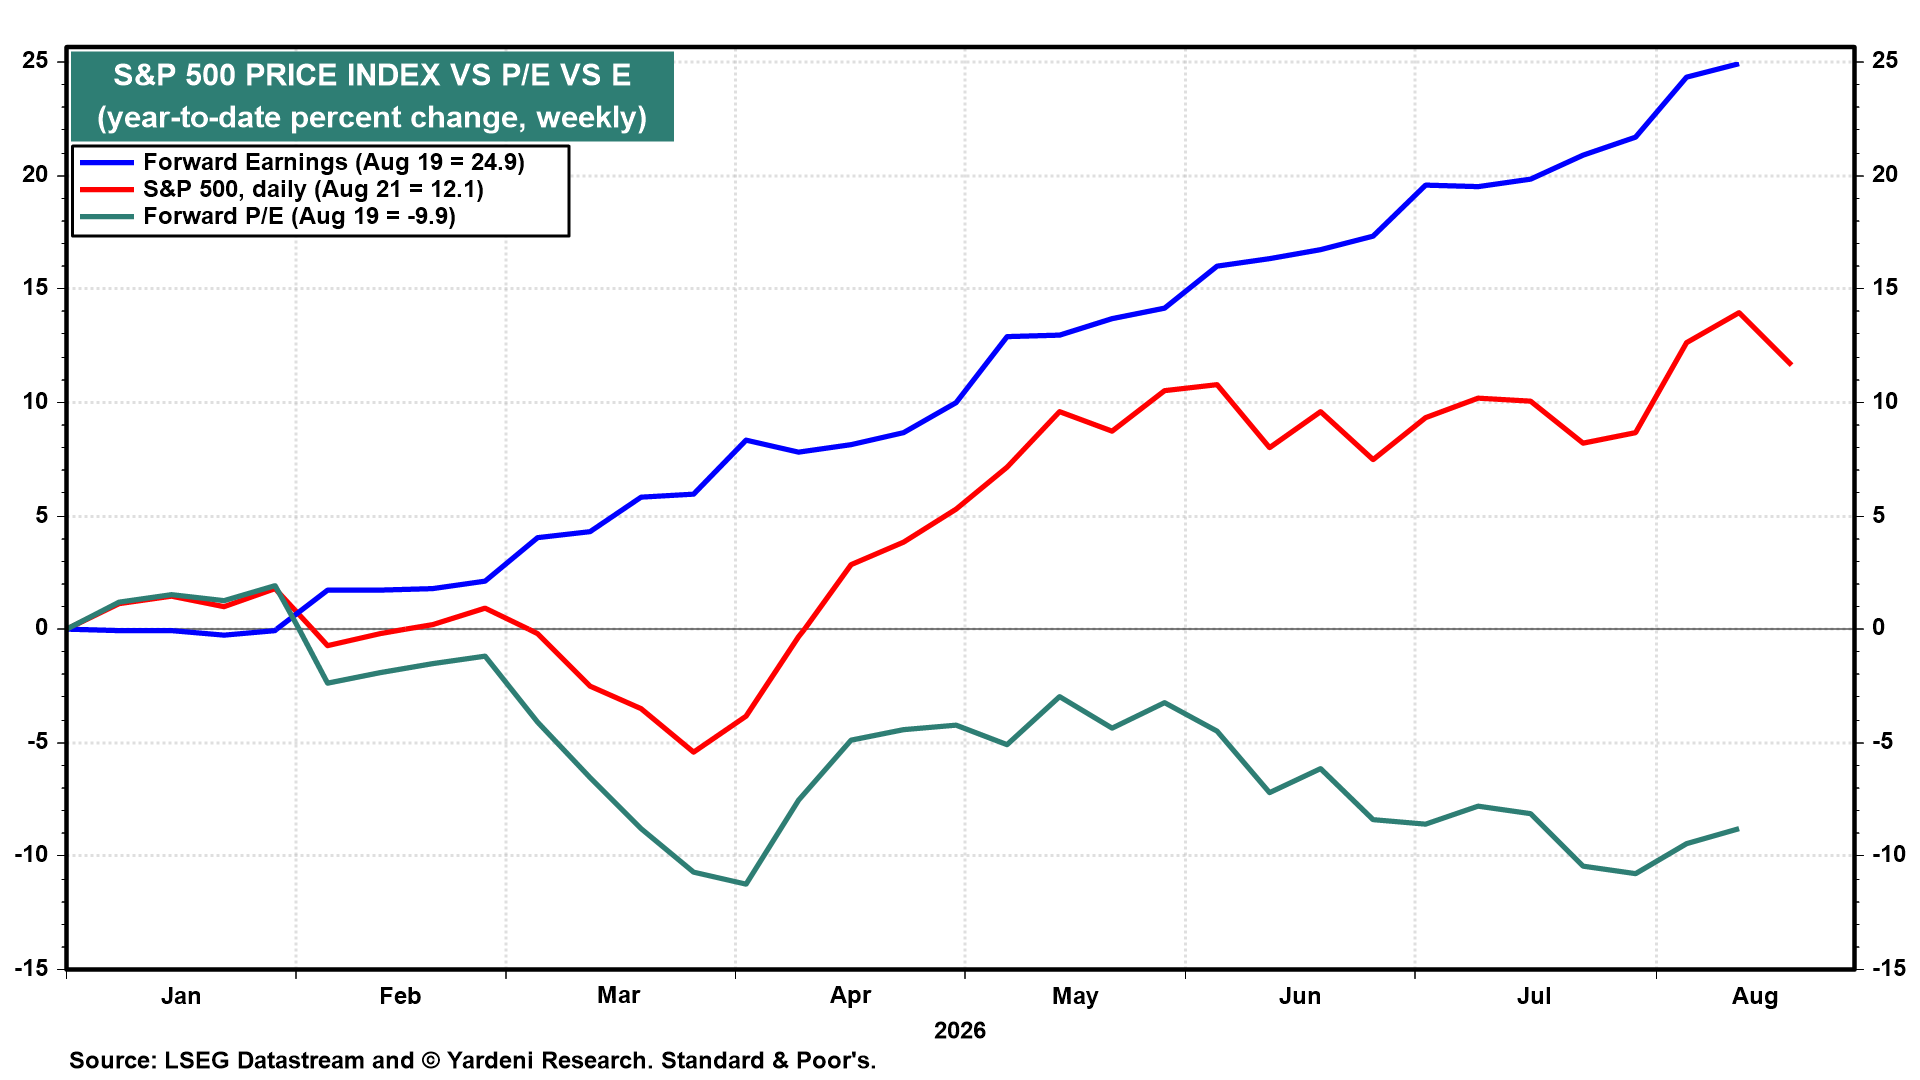
Stocks are cheaper than they were in January. S&P 500 forward earnings has risen twice as fast as the S&P 500 stock price index so far this year. So the forward P/E has declined as the index rose to record highs. The impetus was FEMO (fabulous earnings momentum) as opposed to FOMO (fear of missing out). Investors are getting more earnings for their money than they were eight months ago.
Here’s more:
I. Performance. The S&P 500’s forward earnings is up 24.9% ytd versus a 12.1% gain in the index, which has pushed the forward P/E down 9.9% (chart). Forward earnings has risen almost uninterrupted this year, while the price index has stalled and pulled back repeatedly.
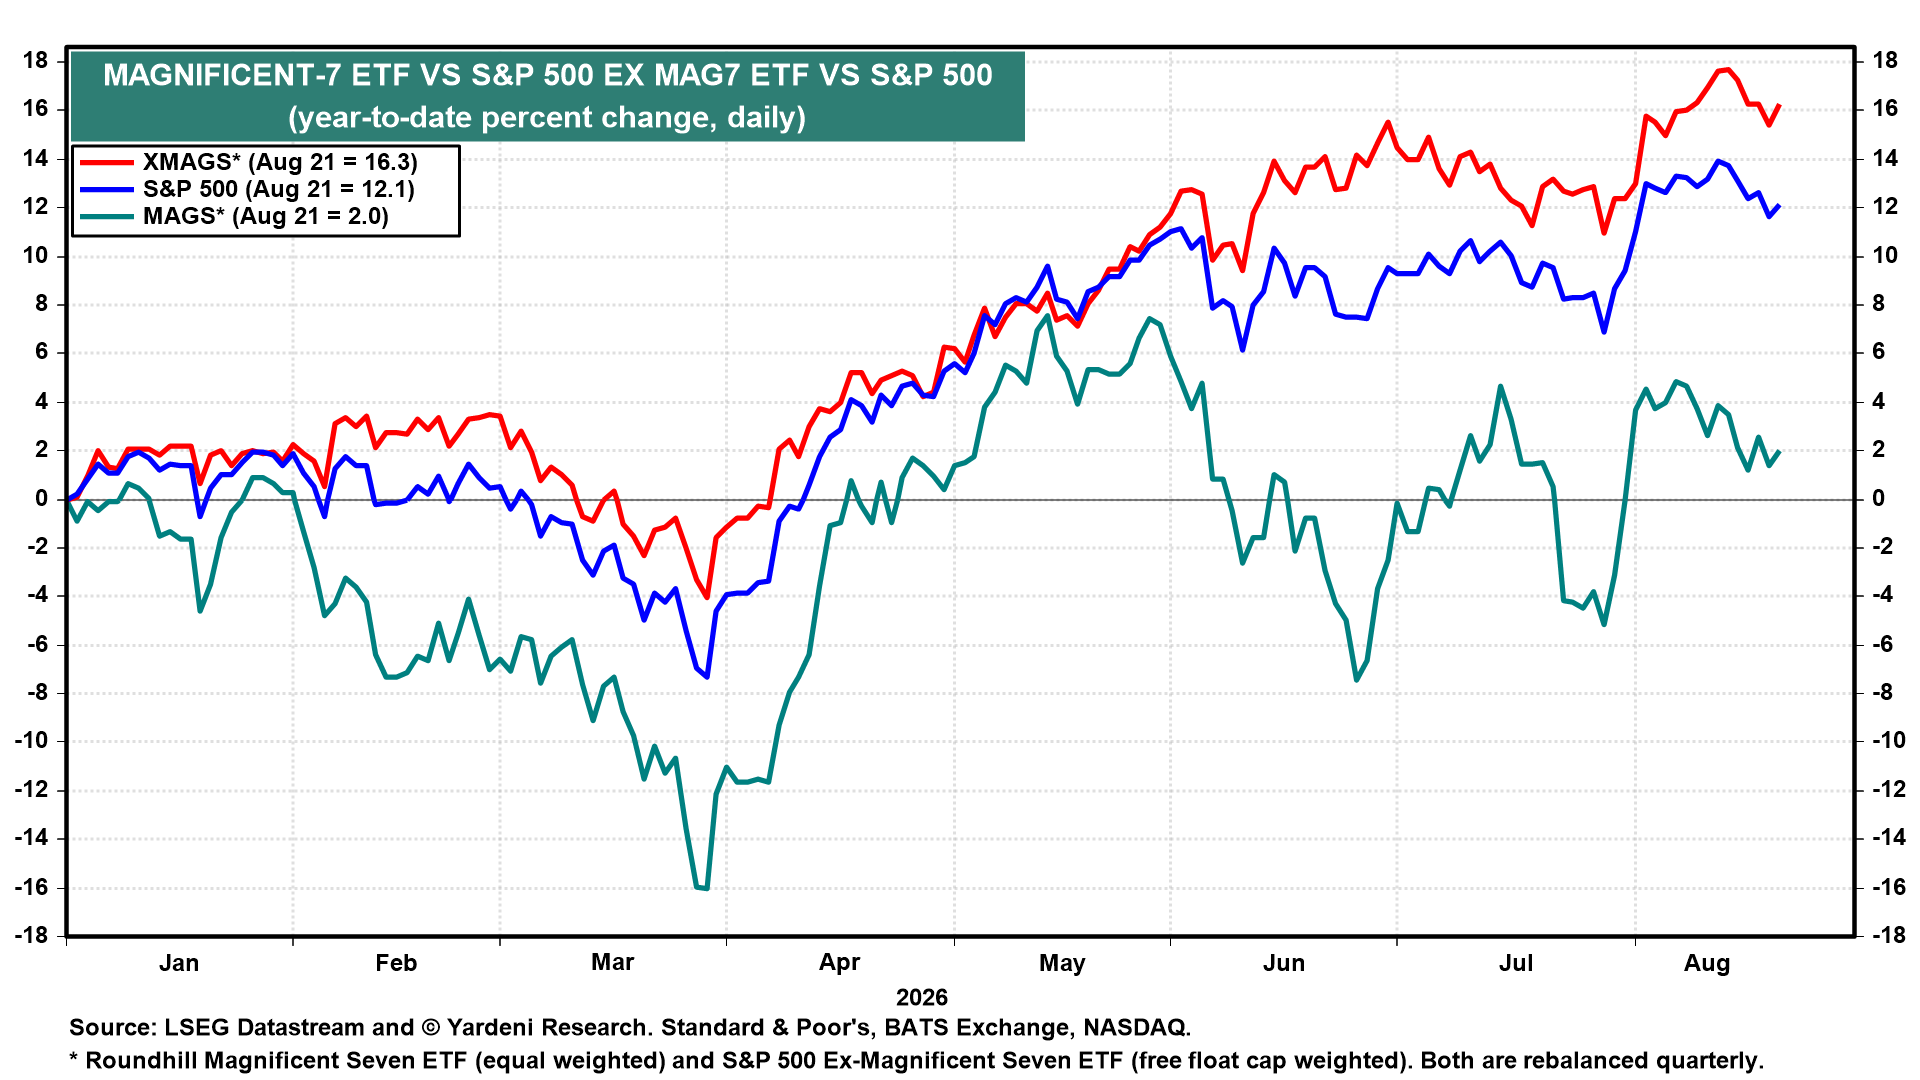
One would expect earnings momentum this strong to be showing up in the price action of the S&P 500’s biggest earnings producers. It isn’t. The Magnificent-7 is up 2.0% ytd versus 16.3% for the S&P 500 ex-Mag-7 and 12.1% for the index (chart).
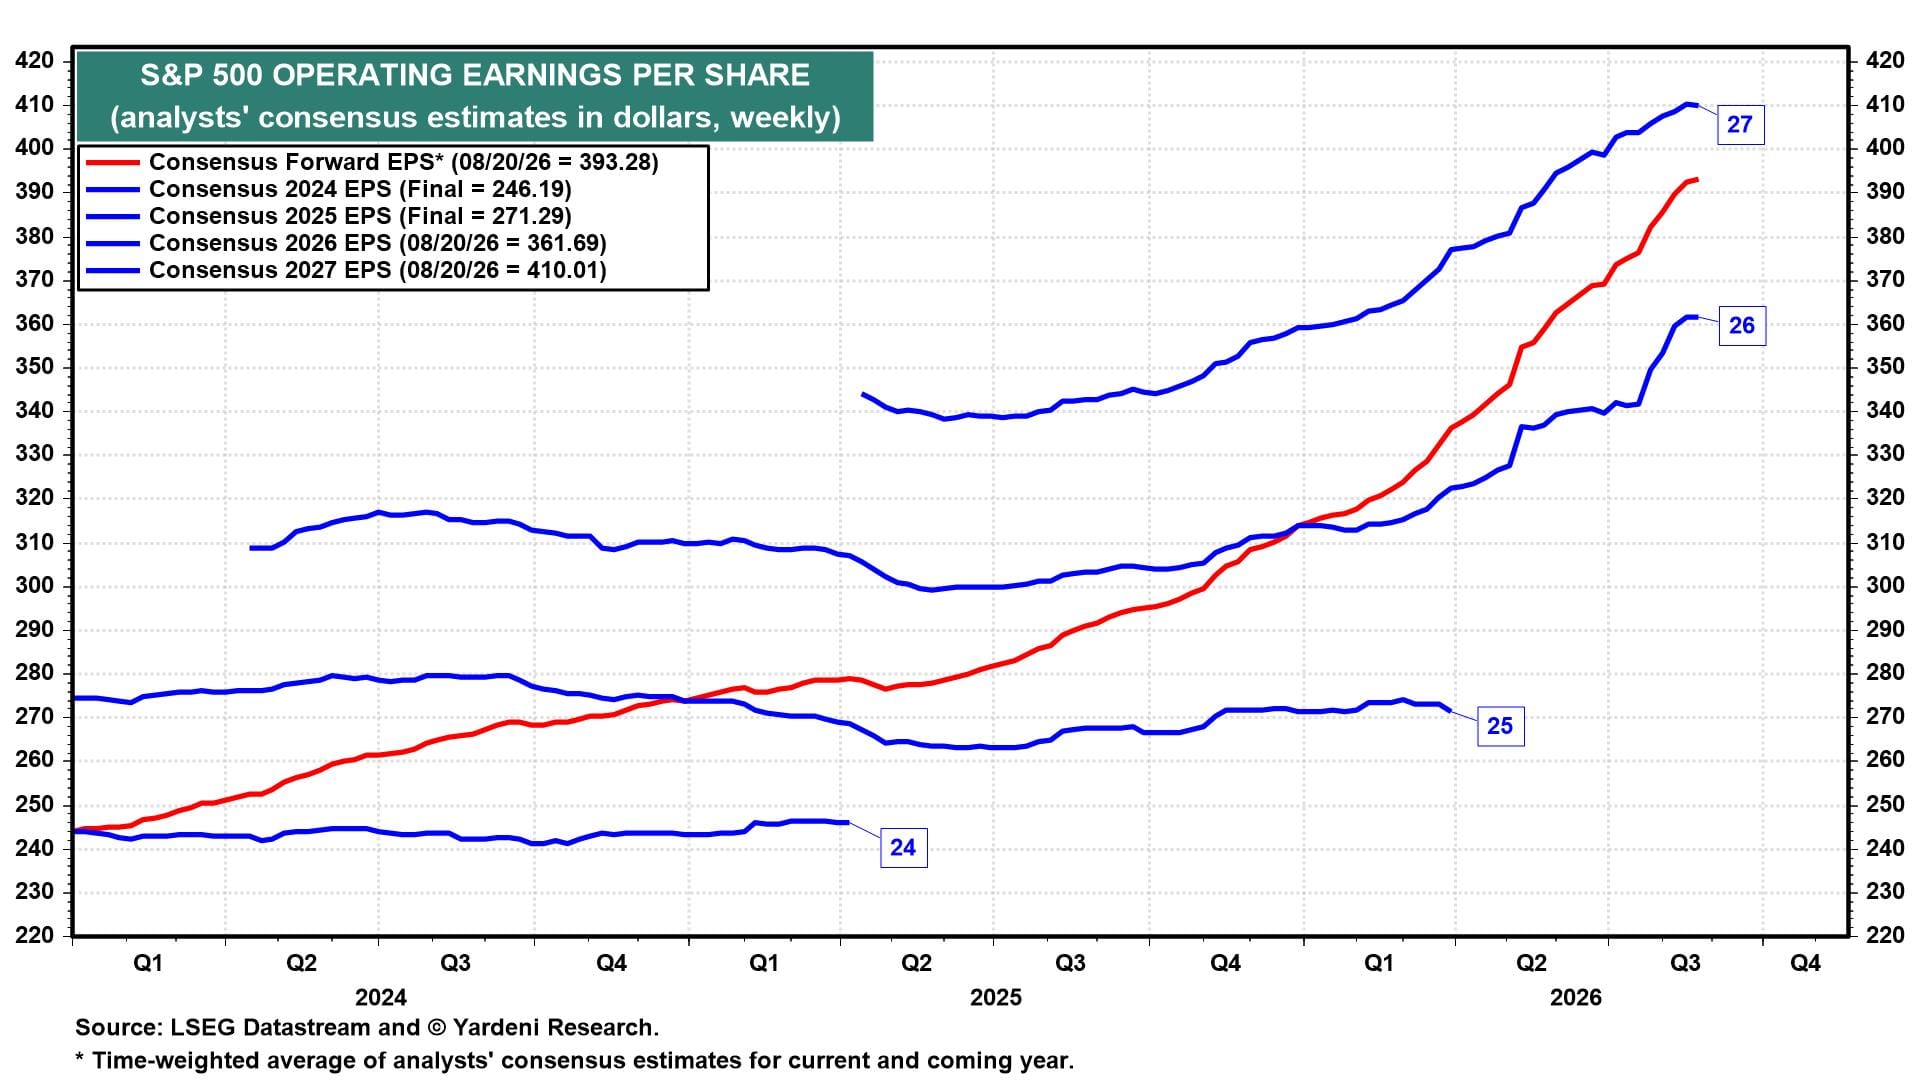
II. Earnings. The 2027 analysts’ consensus earnings estimate may be leveling off around $410 after climbing all year (chart). We expect it to finish this year near $415.00. The latest forward earnings of $393.28 should converge to our estimate as the year progresses. The S&P 500 should hit 8,400 by year-end if the forward P/E edges back up above 20.0.
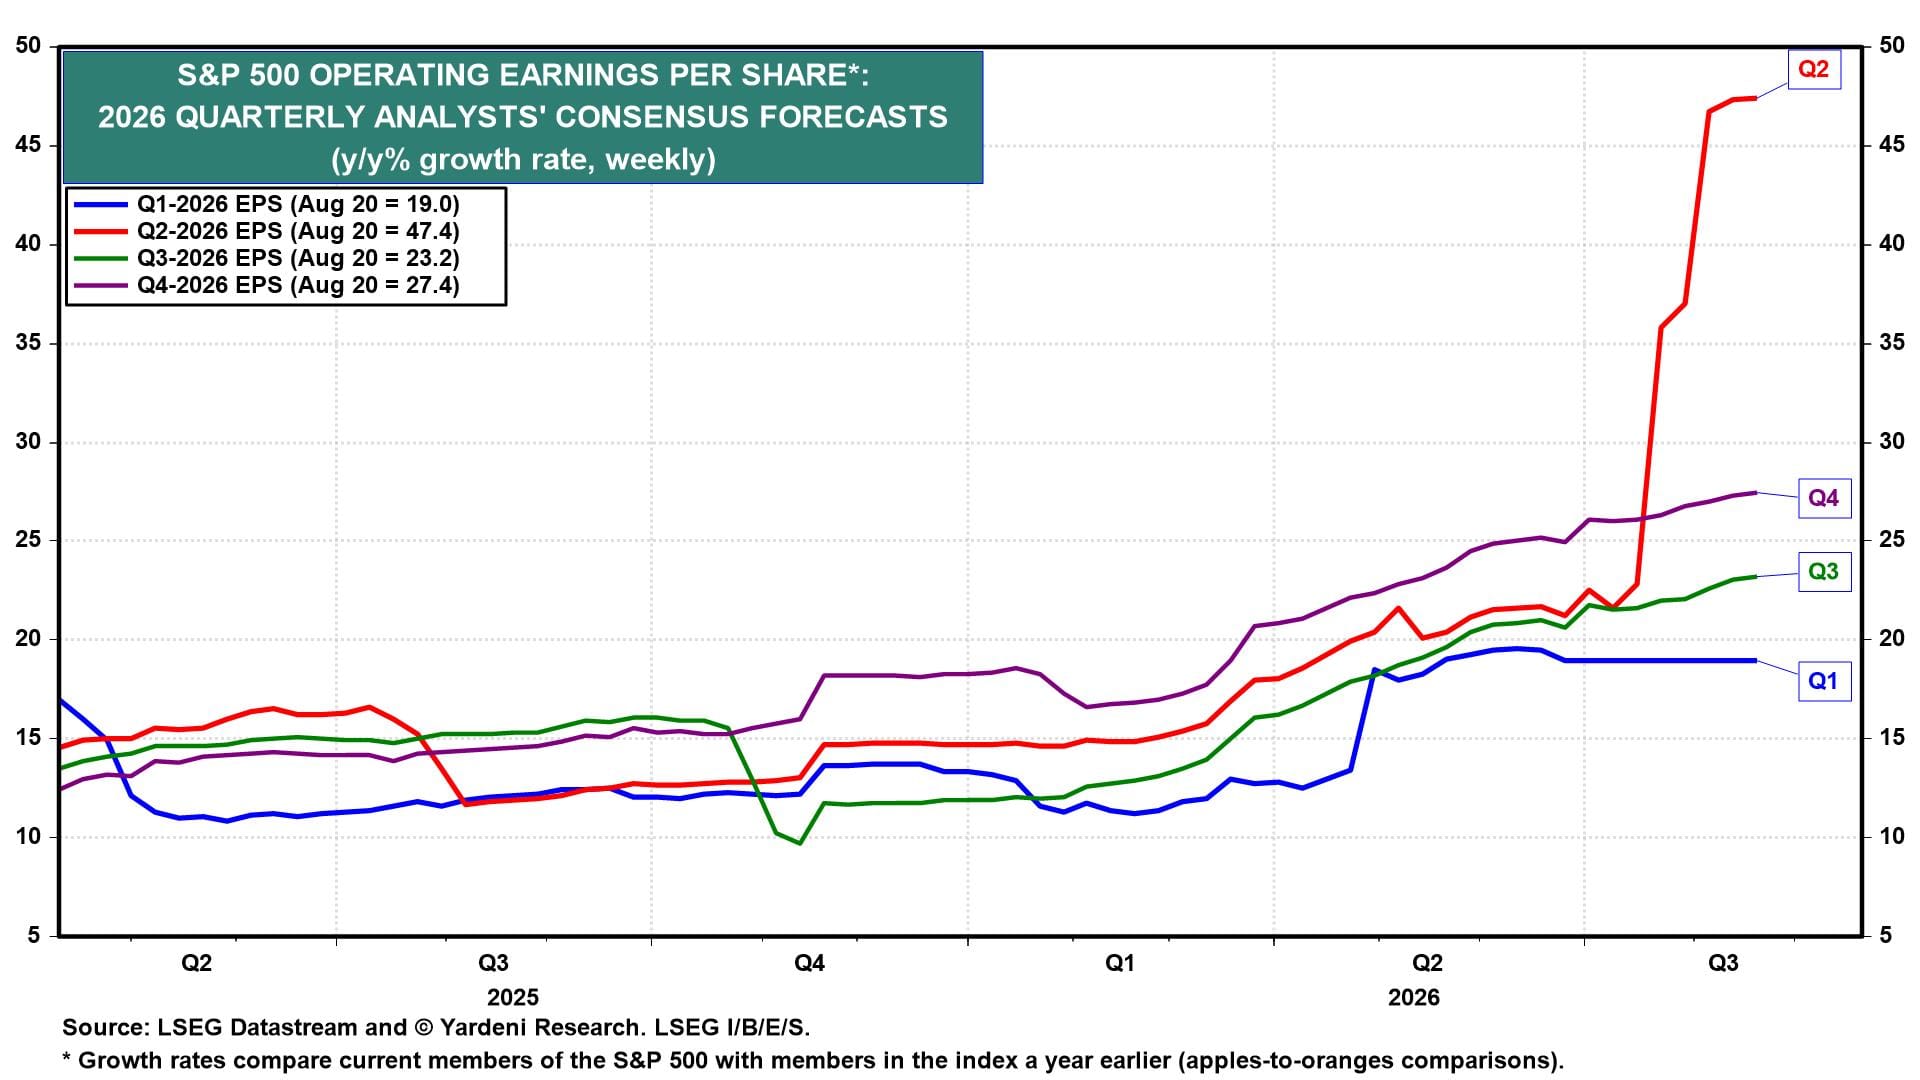
Analysts’ quarterly earnings expectations are still rising (chart). Projected y/y EPS growth rates are up to 23.2% for Q3 and 27.4% for Q4. Q2’s 47.4% is inflated by the mark-to-market (MTM) gains at Alphabet and Amazon that we have flagged for several weeks. Excluding these MTM gains, Q2 earnings rose 25.7%.
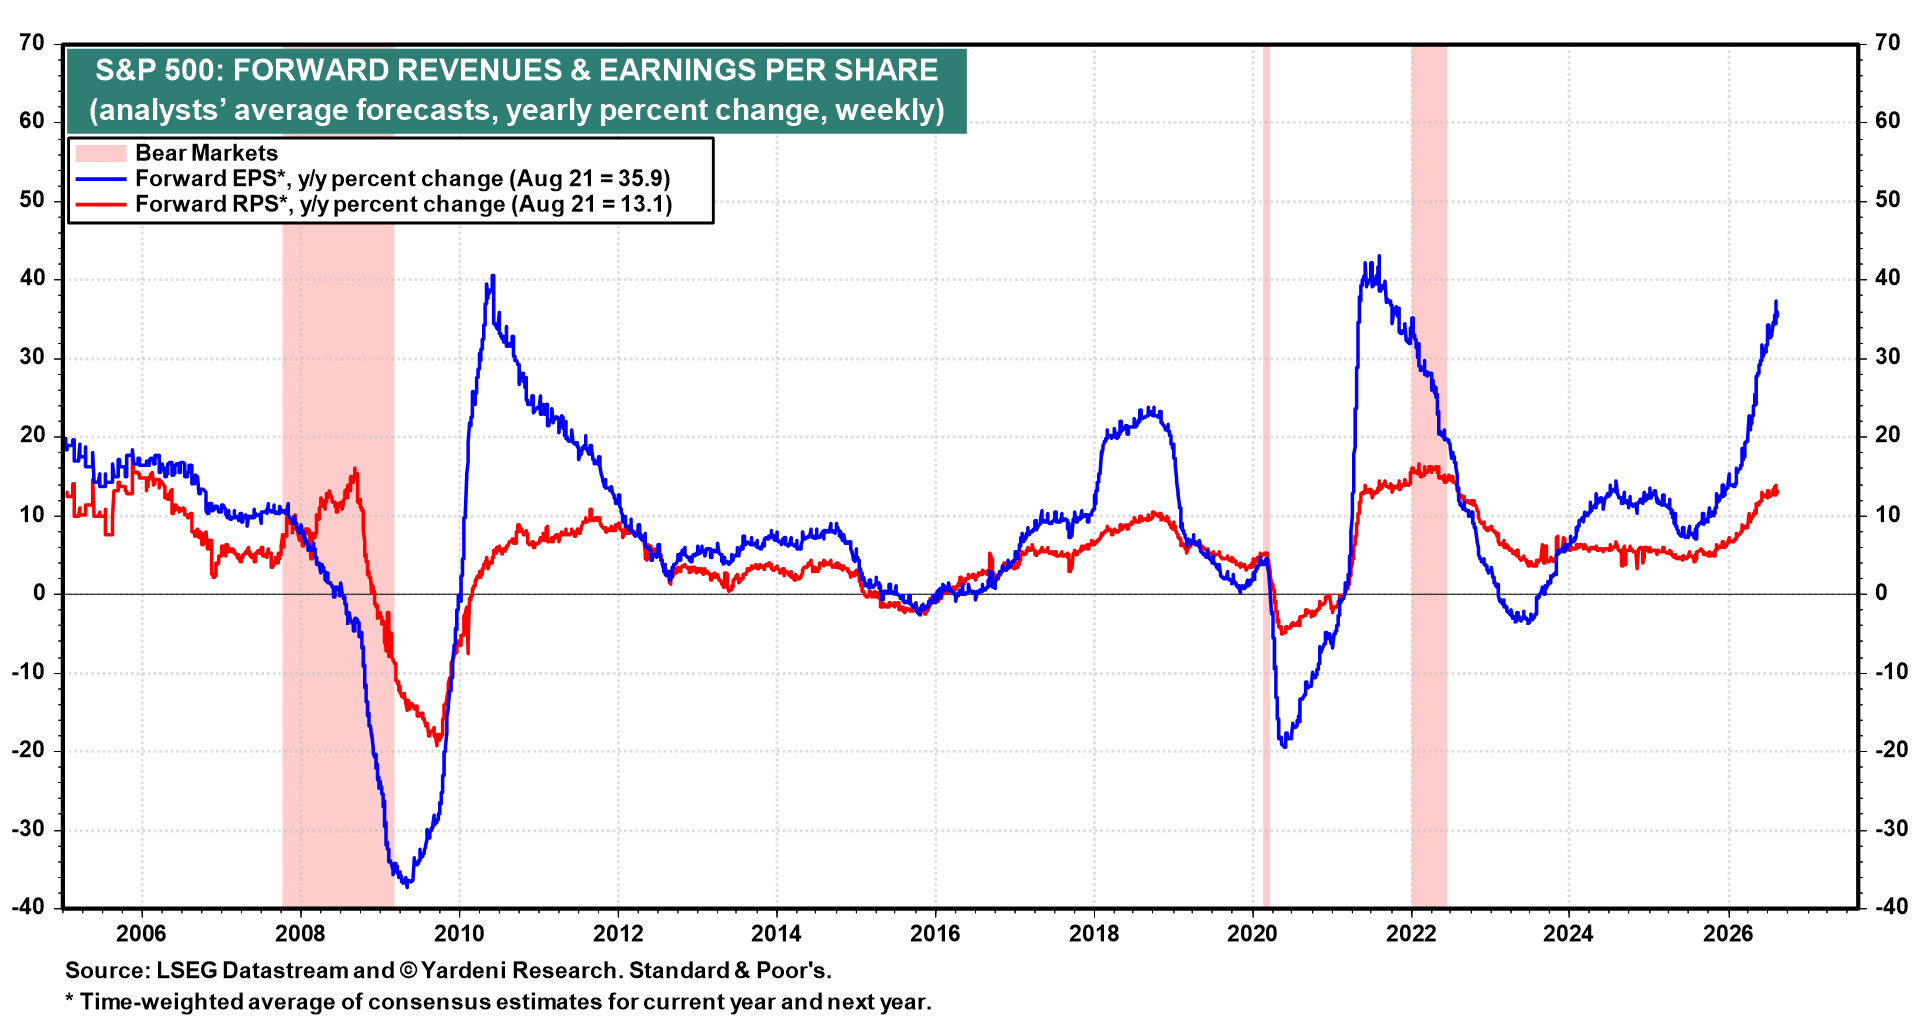
S&P 500 forward earnings is growing at 35.9% y/y, while forward revenues is up 13.1% (chart). That gap reflects widening profit margins. A margin gap this wide has appeared in the past only after recessions and bear markets. This pattern shows up early in bull markets rather than late. This time, the difference is that the margin expansion is not the usual cyclical bounce off a trough. In our view, it reflects structural productivity gains.
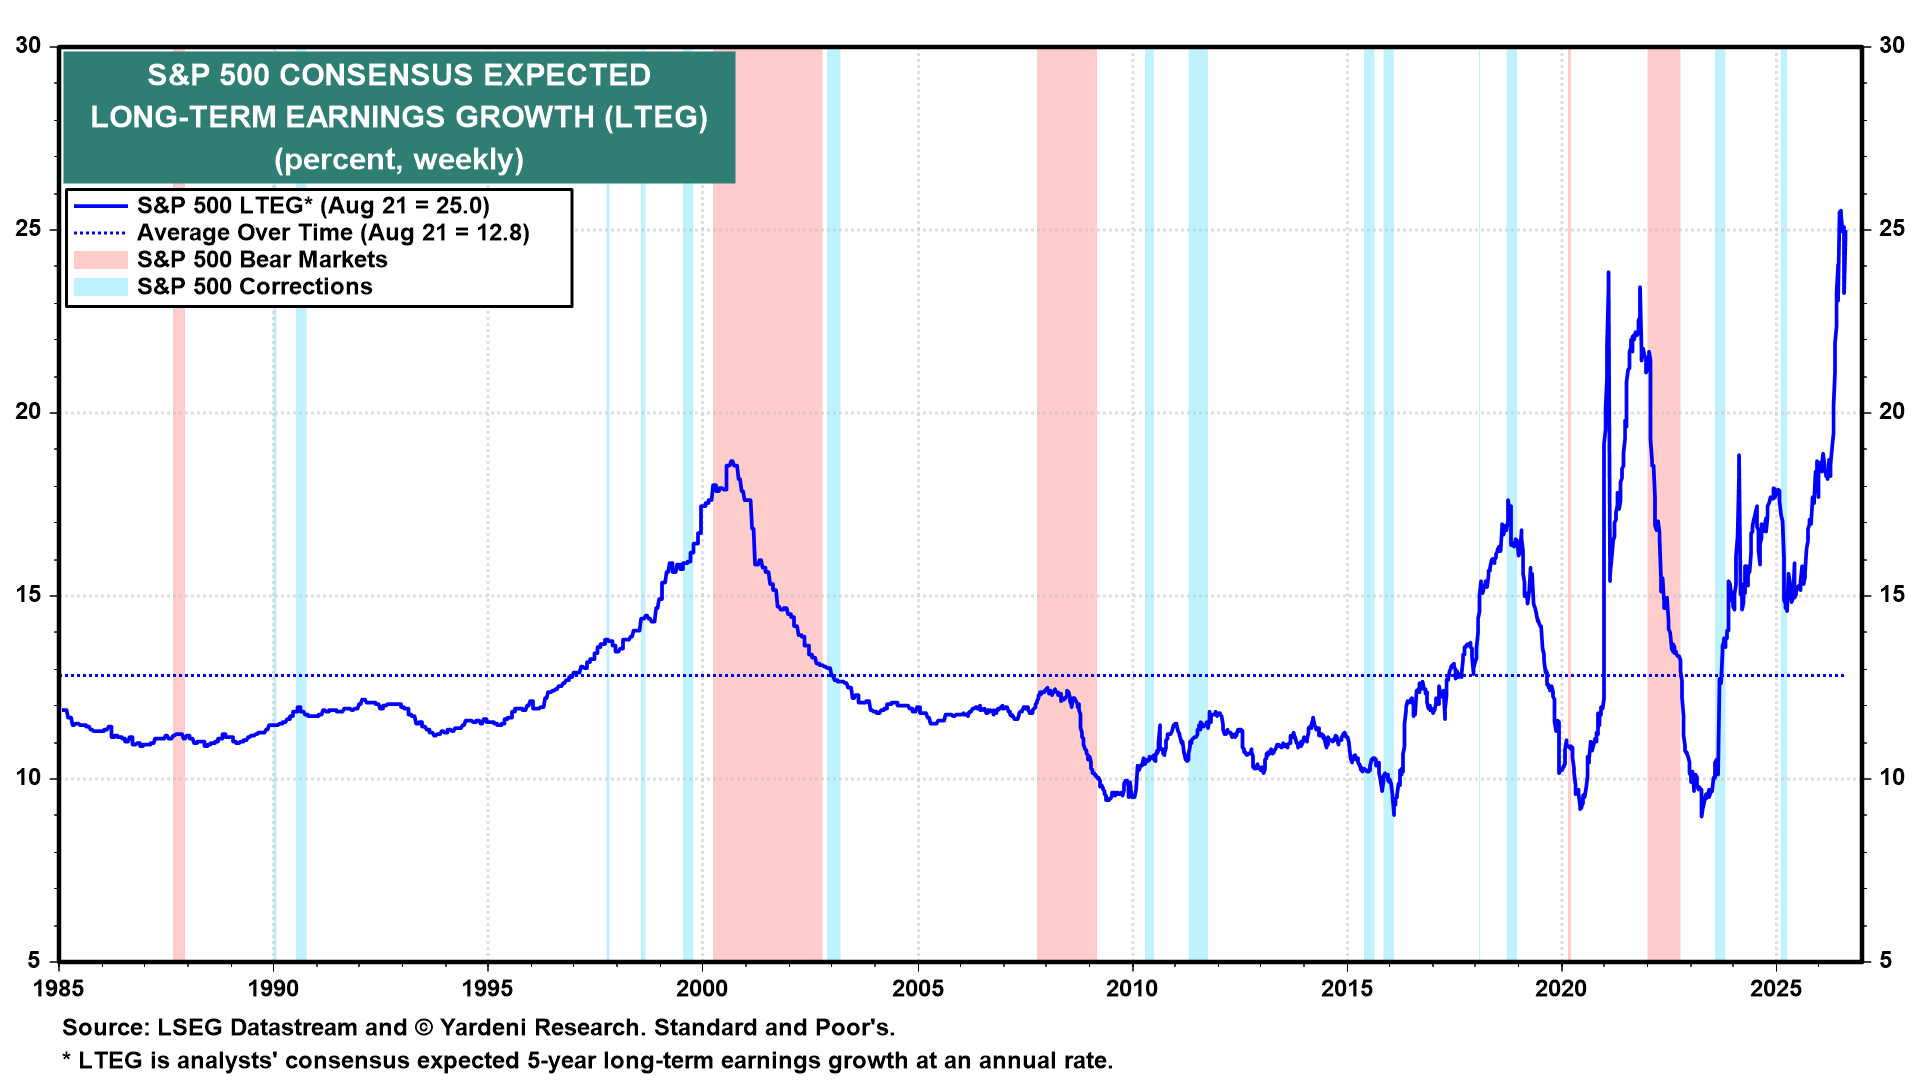
Consensus long-term earnings growth (analysts’ expected five-year annual growth rate) is currently 25.0%, nearly double the historical average of 12.8% (chart). This signals irrational exuberance in analysts’ earnings expectations. However, stronger-than-expected actual earnings have driven it.
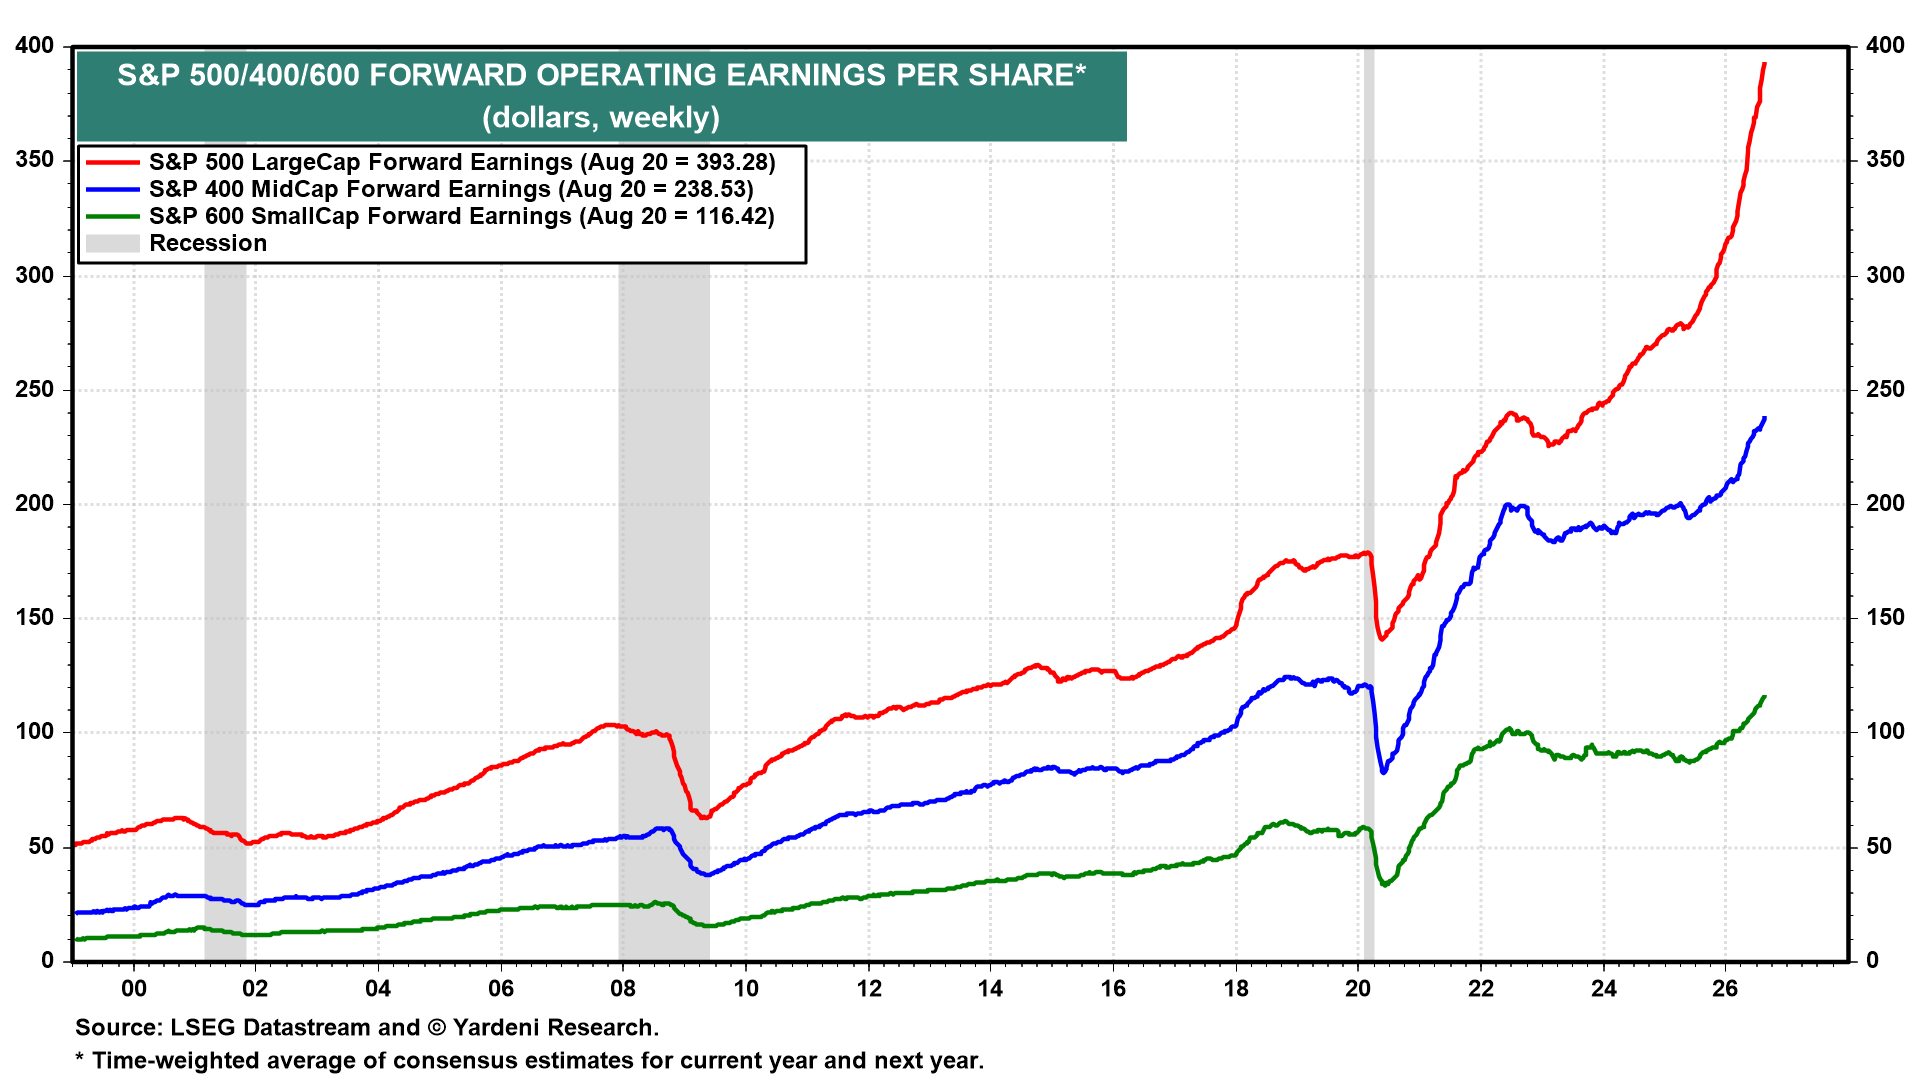
III. Earnings Breadth. Forward earnings are at a record high for the S&P 500, the S&P 400, and the S&P 600 (chart). FEMO is not just a LargeCap story.
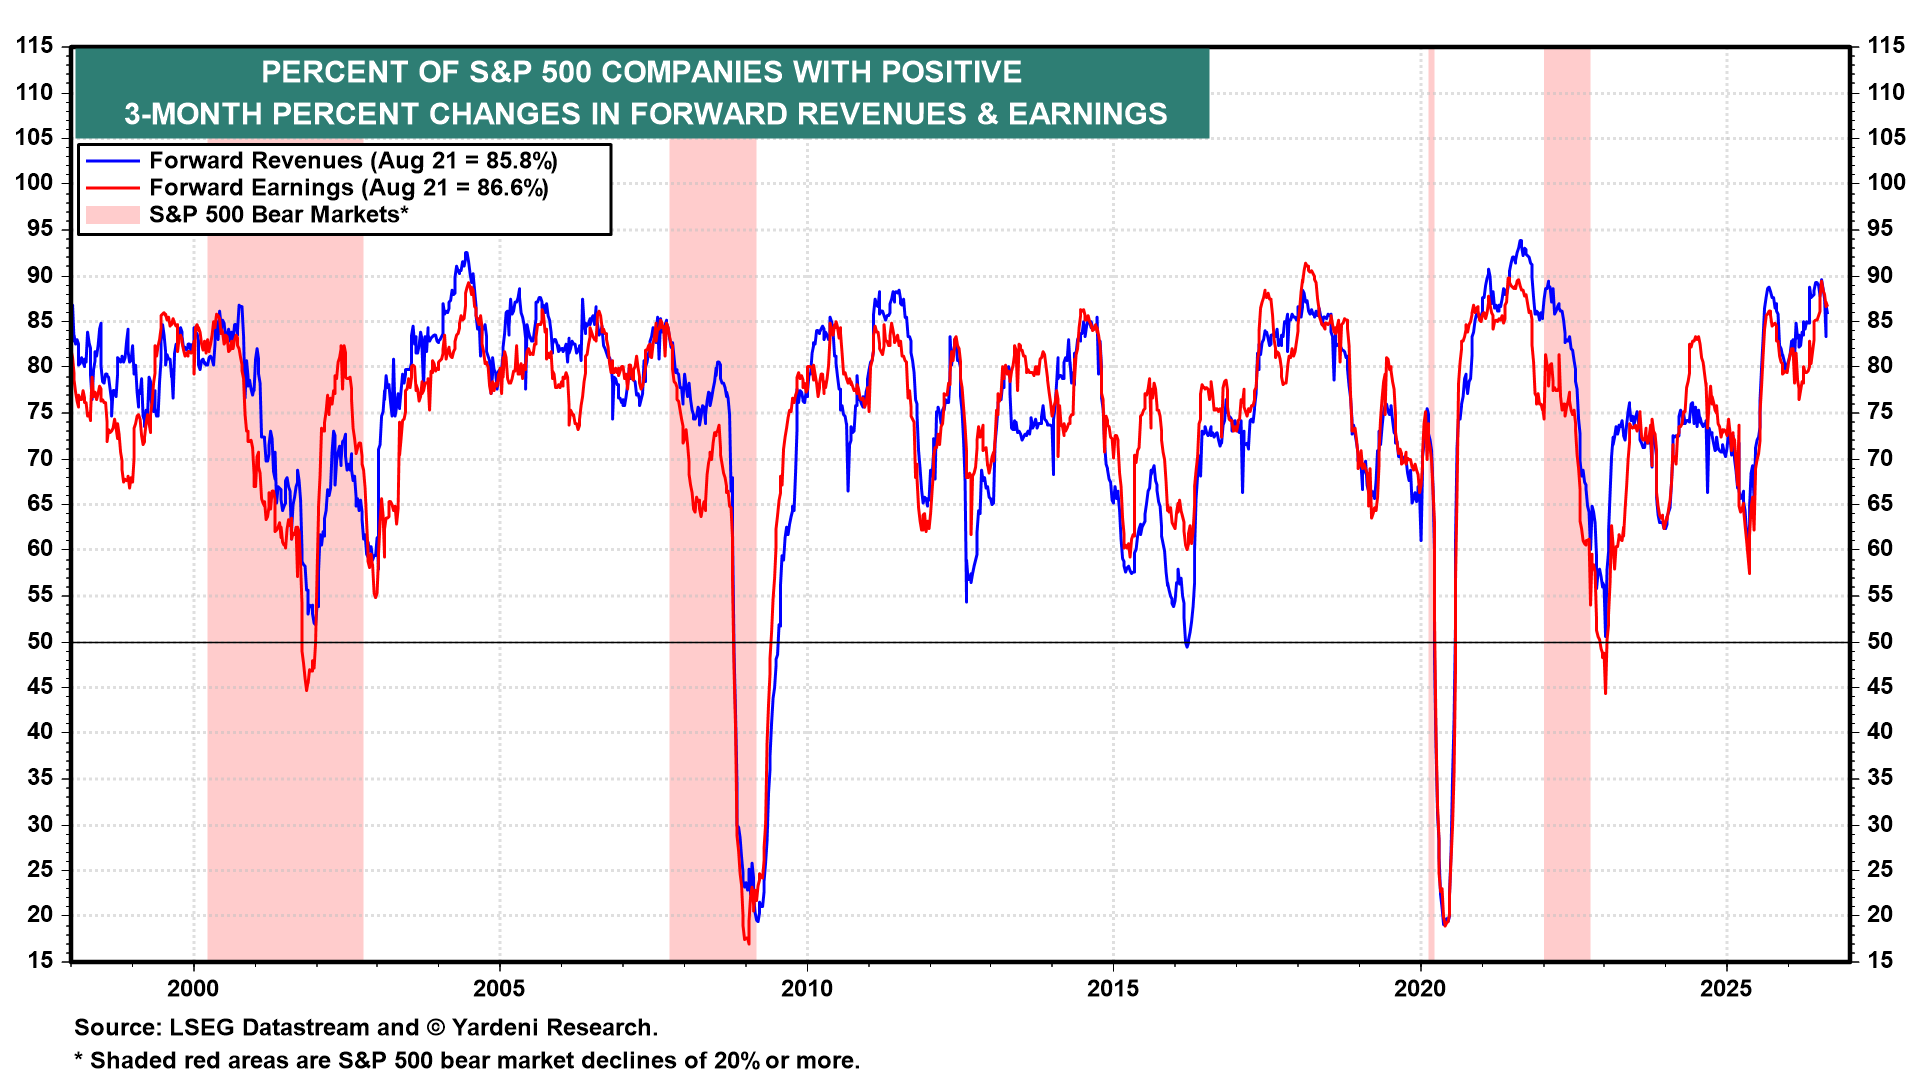
The breadth of earnings has improved. The dispersion in forward revenue and earnings increases is very high (chart).
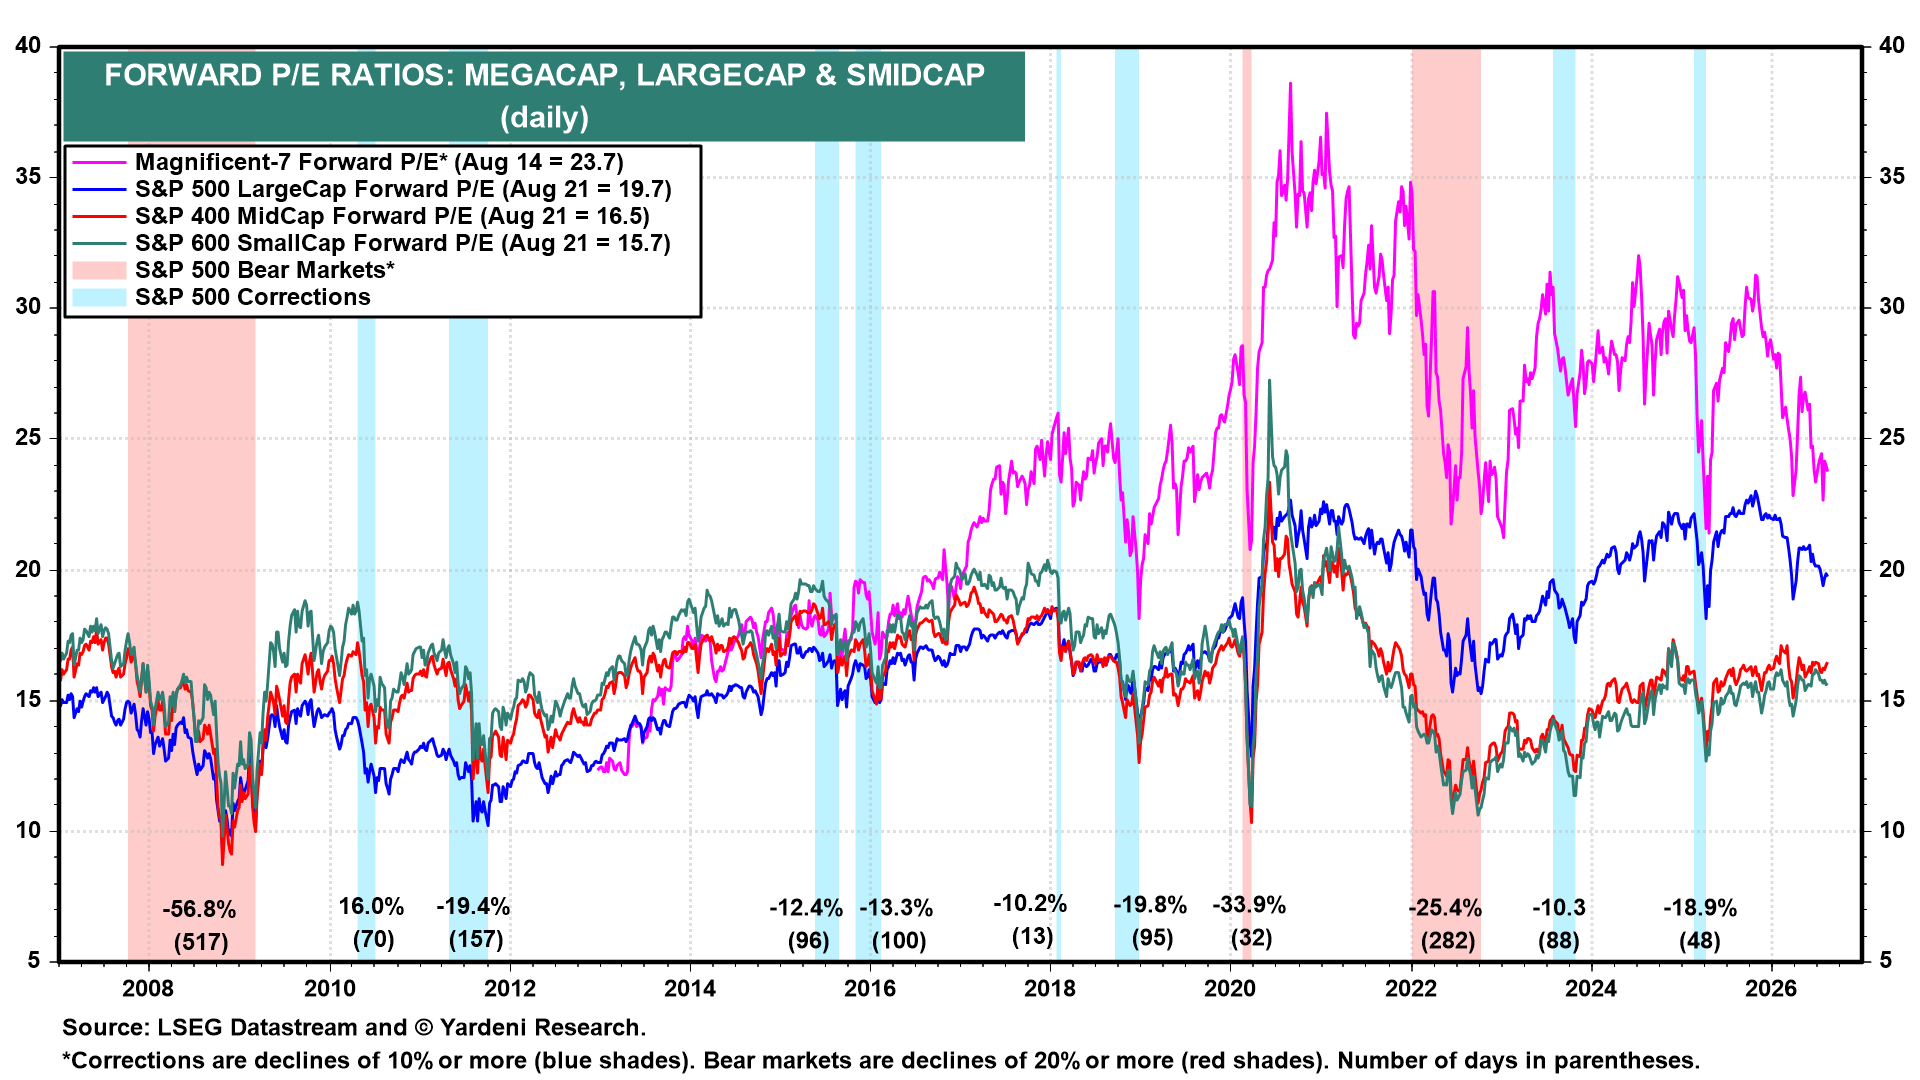
IV. Valuation. Earnings and expected earnings keep rising faster than prices, so multiples keep falling. The Magnificent-7’s forward P/E is down to 23.7, the narrowest premium to the S&P 500’s 19.7 since April 2025 (chart). The S&P 400 MidCaps at 16.5 and the S&P 600 SmallCaps at 15.7 are cheaper still, and they continue to outperform.
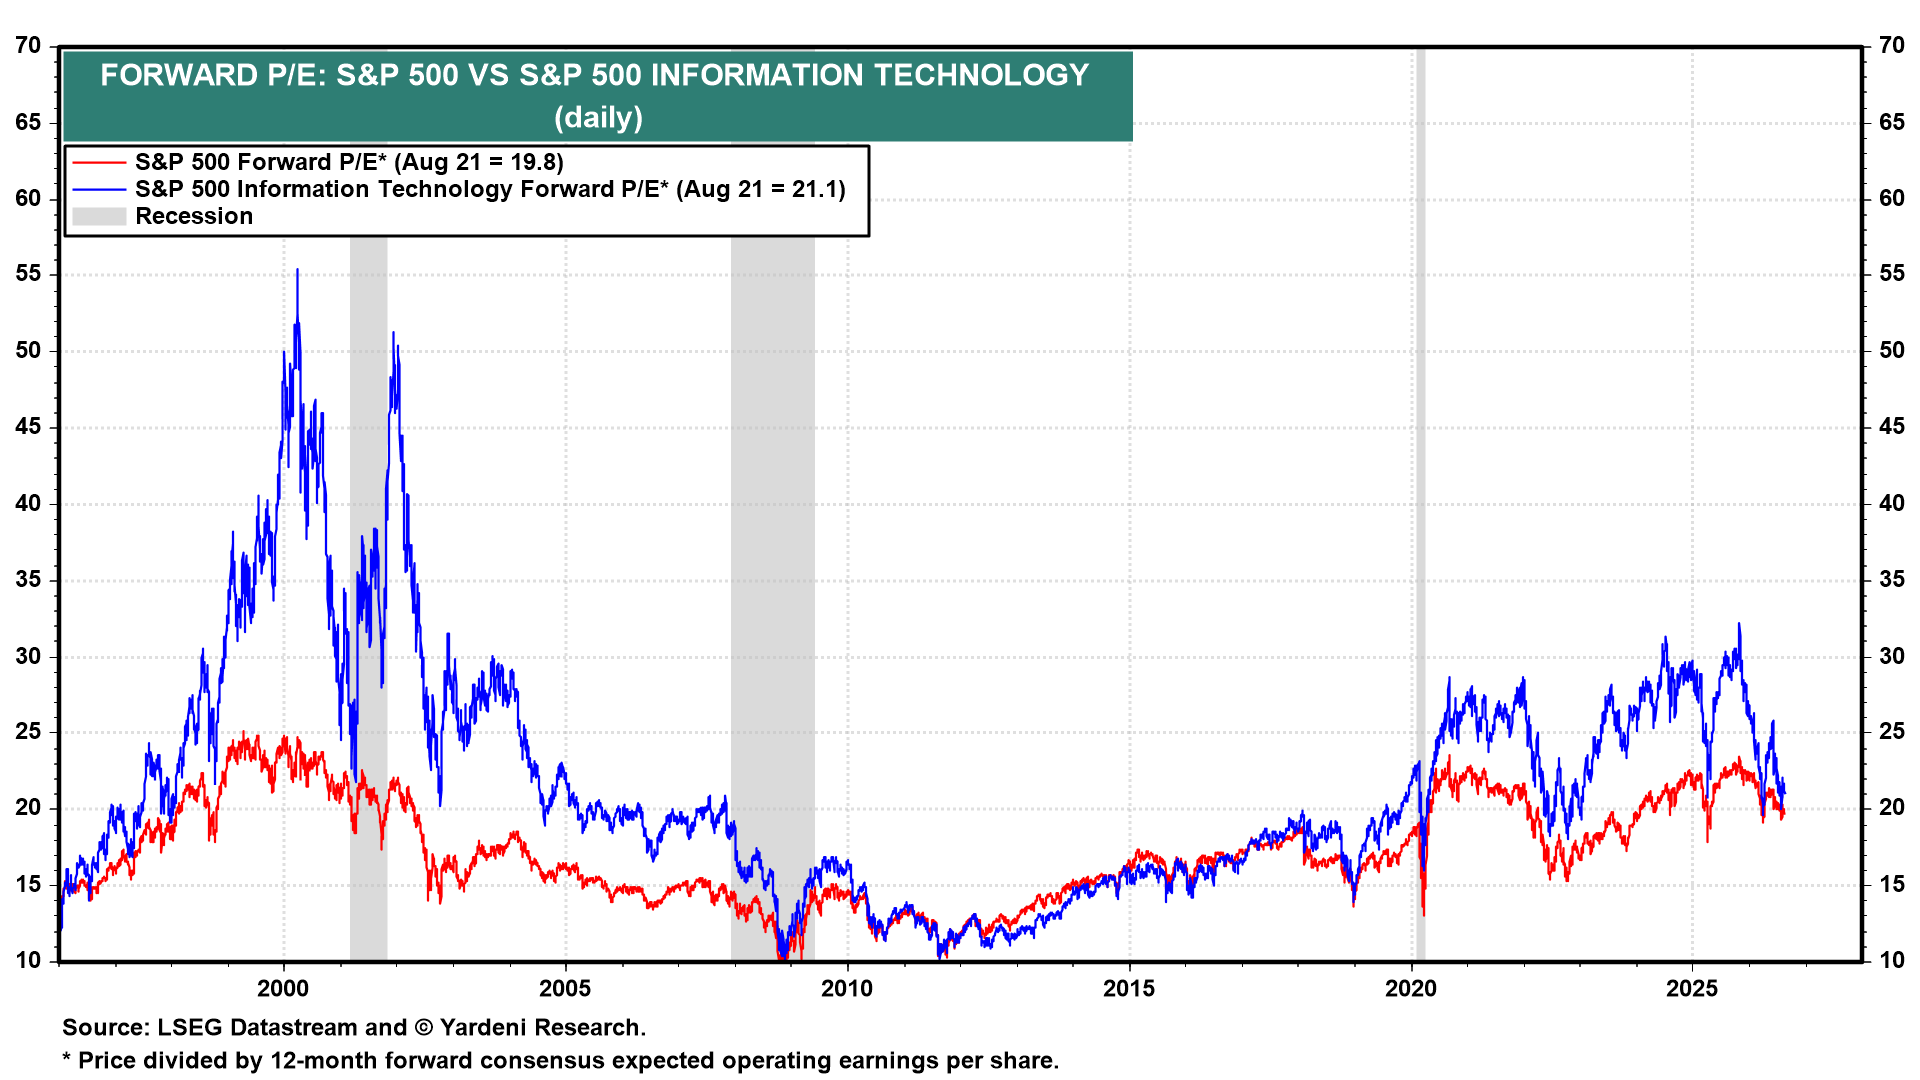
Information Technology has had an excellent earnings season, and its multiple barely reflects it. The sector’s forward P/E is 21.1 against 19.8 for the index (chart). This is not 1999, when tech stock price gains reflected overly inflated valuations (FOMO) that soon after deflated.
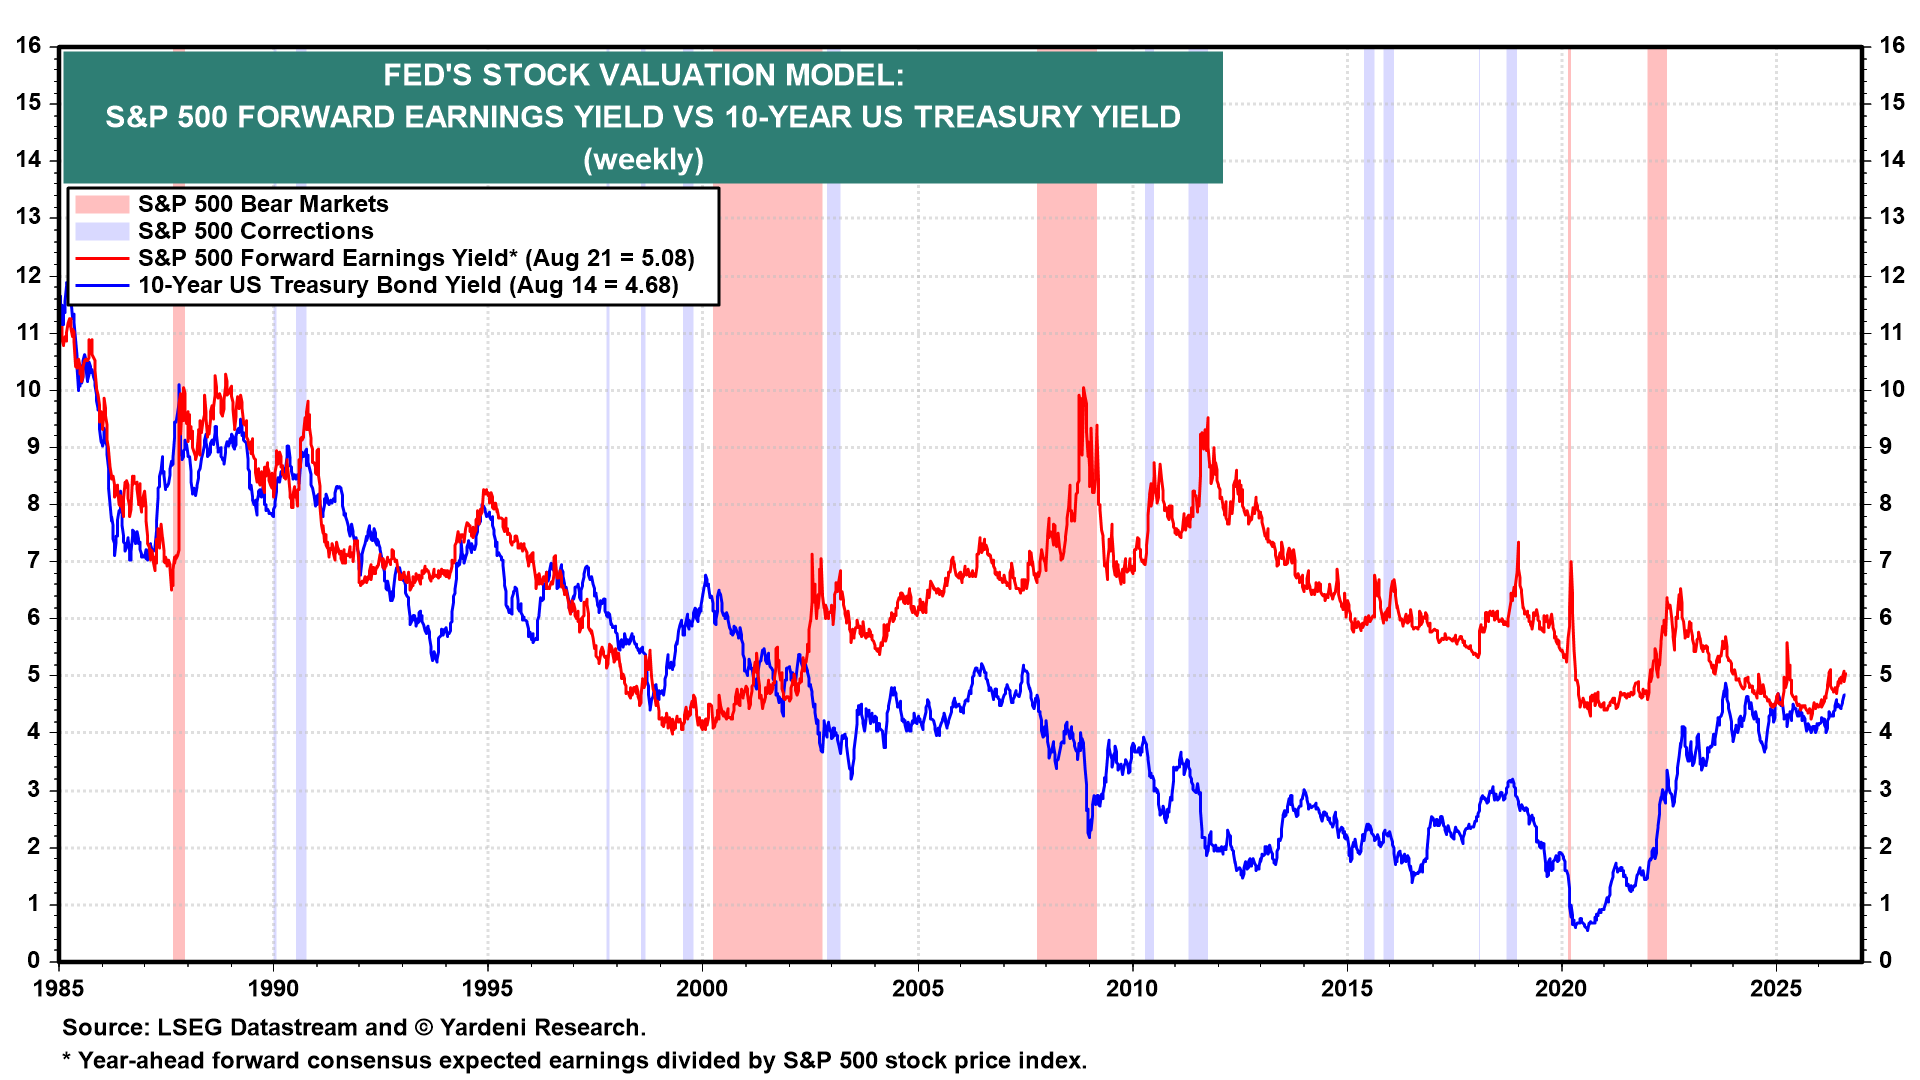
The 10-year Treasury yield is moving toward the top of our 4.00%-5.00% “old normal” range and toward the S&P 500’s forward earnings yield of 5.08% (chart). Convergence here does not mean that the forward P/E has to fall. Earnings are rising fast enough to keep the earnings yield ahead of the bond yield.
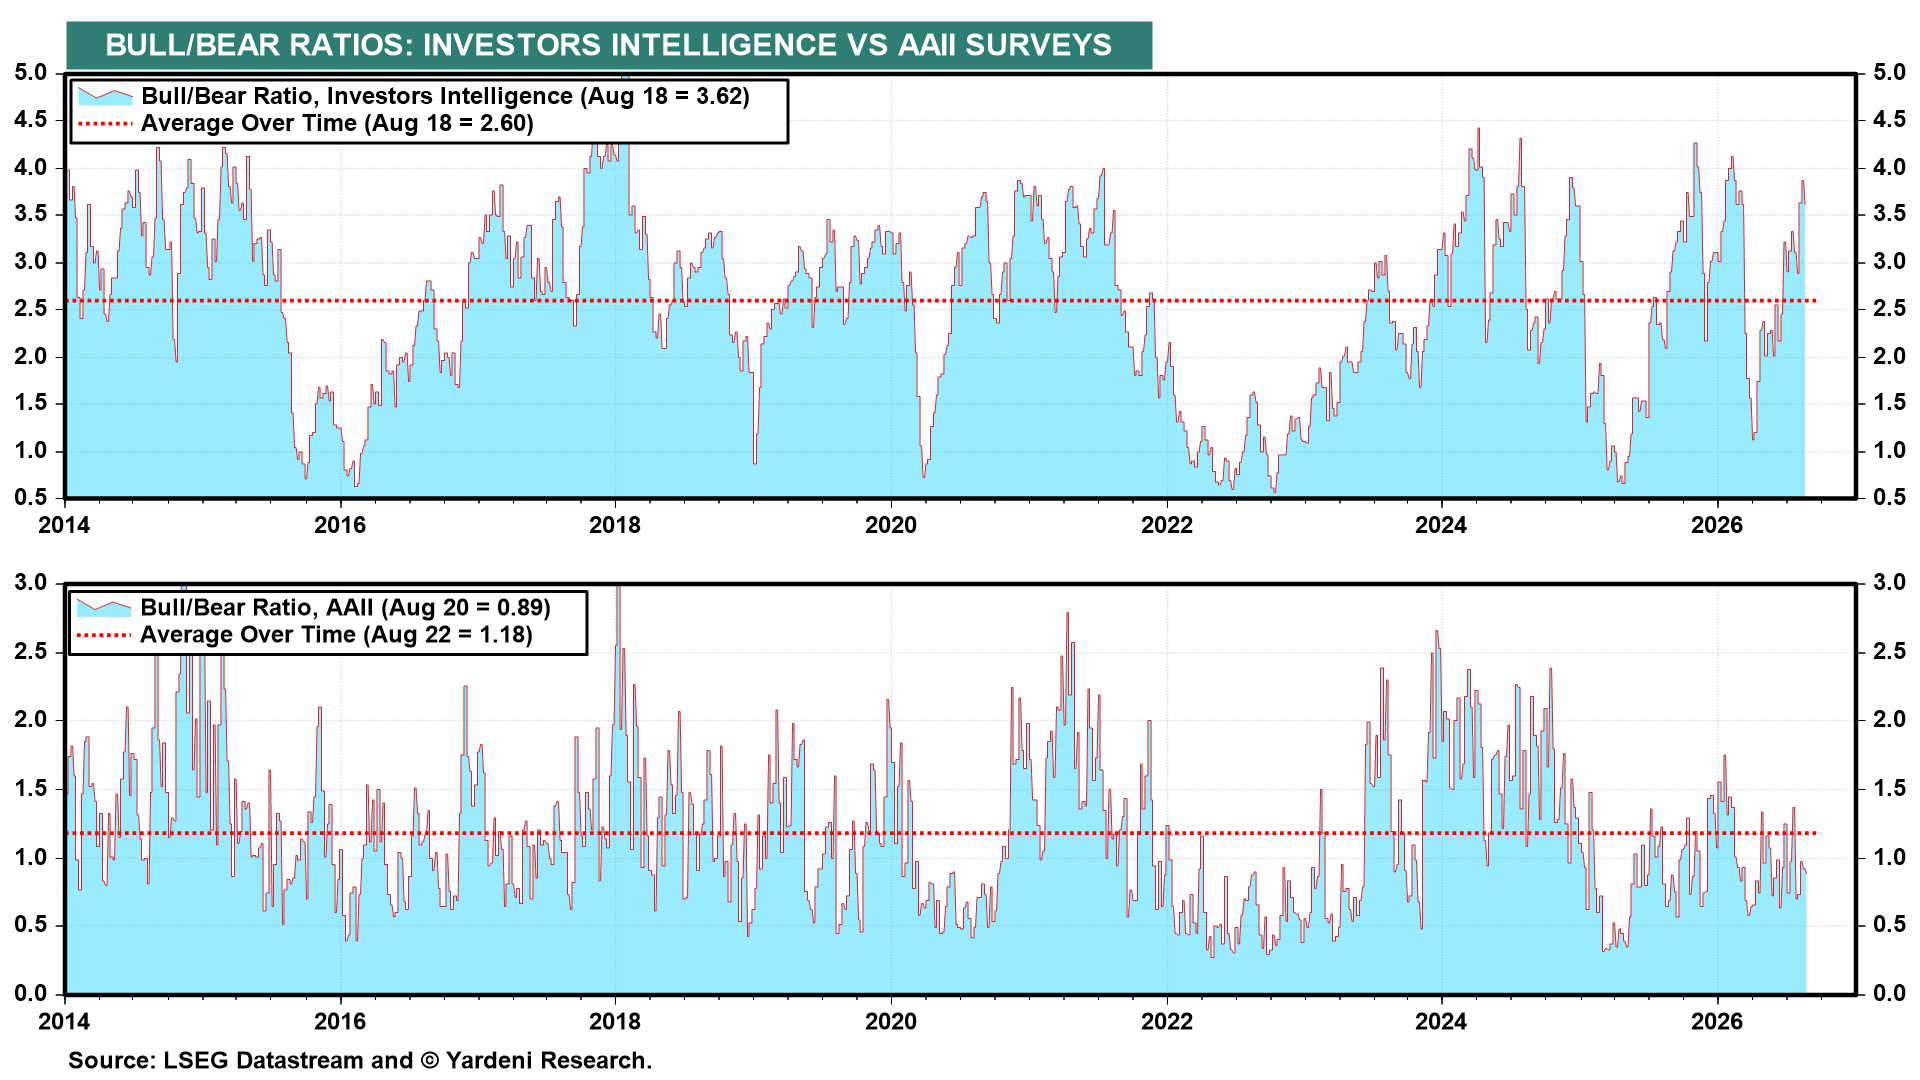
V. Sentiment. The Investors Intelligence bull/bear ratio is 3.62 against its 2.60 average, while the AAII ratio is 0.89 against its 1.18 average (chart). Institutional investors are bullish, while retail investors—scared out of the stock market earlier this year—haven’t ventured back.
VI. Nvidia. We asked our colleague Joe Abbott to look at what effects Mag-7 stock Nvidia has on Q2 S&P 500 earnings ahead of its report this week. Excluding
mark-to-market (MTM) accounting effects, S&P 500 Q2 earnings growth is 28.3% y/y including Nvidia and 22.4% without it. Nvidia accounts for 15.1% of the ex-MTM y/y change in total Q2 earnings, a close second to Micron’s 16.3%. Nvidia’s share of annual S&P 500 earnings rose from 0.3% in 2019 to 4.9% last year, and analysts expect it to be 7.2% this year.
How much Nvidia’s earnings beat analysts’ expectations is likely to determine the stock market’s reaction to the report. Across a sample of 21 AI-exposed companies we track, those beating earnings estimates by more than 10% rose 4.2% on average on the day of the earnings report and rose 7.2% over five days. Those beating by less than 10% fell 1.2% and 3.0%, respectively. The bar companies need to clear to earn big share price reactions has been raised from simply beating the consensus forecast to beating it by a wide margin.
💡
Join the discussion with Ed below! To leave comments or questions, log in to the Yardeni QuickTakes website and post them at the end of the QuickTakes article. Paid members’ contributions may be featured in our segment, “Ed Answers Your Questions”.


