
Box B: Households’ Investment Property Exposures: Insights from Tax Data | Financial Stability Review – October 2017

The strong growth of investor borrowing for property in recent years has potential
implications for financial and macroeconomic stability. The characteristics
and risk profile of households’ investment property exposures differ in
important ways from those of owner-occupiers. This box uses the most recent
data from the Australian Taxation Office (ATO) that cover 13 million individual
tax returns to provide insights into households’ property
investments.
Several features of households’ property investment point to areas of potential
risk. Many investors are lower-to-middle-income earners with a substantial
share of households in lower-income occupations experiencing losses on their
rental properties. There is also some evidence that changes over time may
be increasing risks, namely the rise in the share of households with multiple
investment properties and in the share of investors over the age of 60 with
mortgage debt, as well as investment across state borders where the investors’
knowledge of the property market can be lower.
Investor Lending Risks
There are reasons to expect that the risk attributes of investor housing lending
differ from those of owner-occupier lending. Some characteristics suggest
that investor loans might have lower risk for the lender. Investor loans tend
to have lower loan-to-valuation ratios (LVRs) at origination than owner-occupier
loans. Some institutions require lower LVRs for investor loans and investors
may choose an investment property such that their equity exceeds 20 per cent
of the price in order to avoid the cost of lenders’ mortgage insurance.
In addition, the most indebted investors tend to have higher income and/or
wealth and so may be more able to absorb income falls or interest rate rises,
and the lender is less likely to suffer a loss given the investor’s greater
net
wealth.
There are, however, other features of investor lending that suggest that the
risks of investor lending may exceed those of owner-occupier lending, at least
for the economy if not also for the lender.
-
Credit risk to lenders. Because interest expenses on investment
properties are tax deductible, investors have less incentive than owner-occupiers
to pay down their debt. Many take out interest-only loans so that their debt
does not decline over
time.
With many investor loan balances not declining as rapidly as those of owner-occupiers,
it is more likely that an investor’s loan will exceed the property value
should housing prices fall, increasing the risk to the lender. -
Macrofinancial risks. Investors could amplify cycles in
borrowing and housing prices contributing to economic risks. Investors might
be more likely to sell their property if they expect prices to fall because
it is an investment rather than their home. Conversely, periods of rapidly
rising prices might create the expectation of further price rises, drawing
more investors into the market as capital gains can be a larger part of their
decision to purchase. -
Housing supply imbalances. Investors purchase more off-the-plan
dwellings than owner-occupiers, so they might contribute to larger upswings
in construction with the risk of future oversupply for some types of properties
or in some locations. Conversely, they could amplify any subsequent downswing,
increasing risks to the broader housing market and household sector.
Investor Characteristics
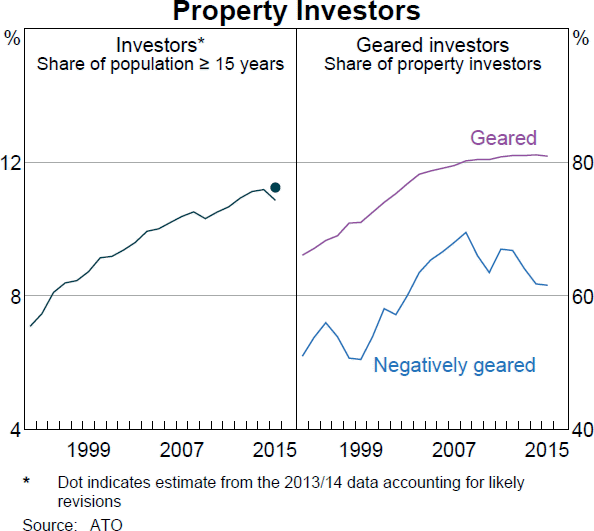
The share of taxpayers who are property investors has increased steadily over the
past few decades (Graph
B1).
In 2014/15, 11 per cent of the adult population, or just over 2 million people,
had one or more investment properties. The share of these with mortgage debt
has remained around 80 per cent since 2008. In recent years the share of negatively
geared investors has declined in line with interest rates, but remains over
60 per cent of total investors. With many not earning positive income from
their property, prospective capital gains are more likely the primary rationale
for investing.
Graph B1
Number of properties
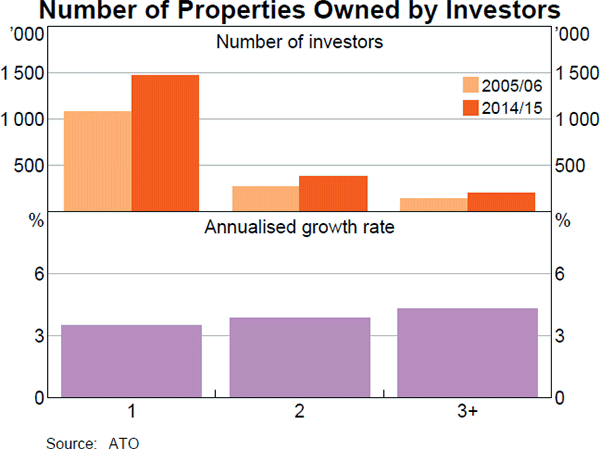
Around 70 per cent of investors own just one property. However, around half of investment
properties are owned by investors with multiple properties; 20 per cent of
investors own two properties and 10 per cent own three or more. The number
of investors with multiple properties has grown relative to those with a single
property, particularly between 2013/14 and 2014/15 (Graph B2). Indeed, the
number of investors with five properties grew by 7½ per cent in that
one year, compared with average growth of 4½ per cent over the previous
nine years. The data do not provide information on the characteristics of
investors with multiple properties and so they cannot shed light on the risks
associated with these holders of multiple properties. However, given the strong
growth in investor housing credit and riskier types of borrowing over this
period, investors with multiple properties have likely contributed to higher
risk.
Graph B2
Income
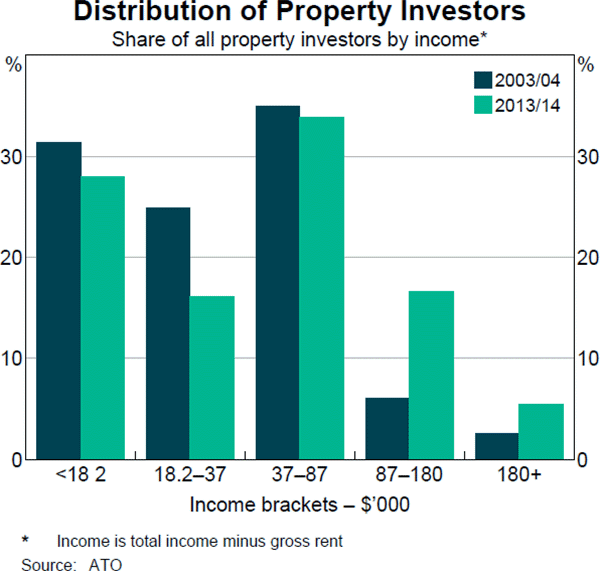
Higher-income taxpayers are more likely to own investment properties than those on
lower incomes. About 11 per cent of taxpayers earning under $50,000 have investment
properties compared with around 30 per cent of taxpayers earning between $100,000
and $500,000. (The definition of income used here includes gross rent before
deductions but excludes non-taxable sources of income such as drawdowns from
superannuation.) However, while lower and middle-income households are less
likely to own investment properties, they make up a larger share of property
investors because there are more of these types of households (Graph B3).
Lower-income households are just as likely as higher-income households to
be negatively geared, with interest payments and other property expenses exceeding
rental receipts. Indeed, the majority of investors with a mortgage are negatively
geared.
Graph B3
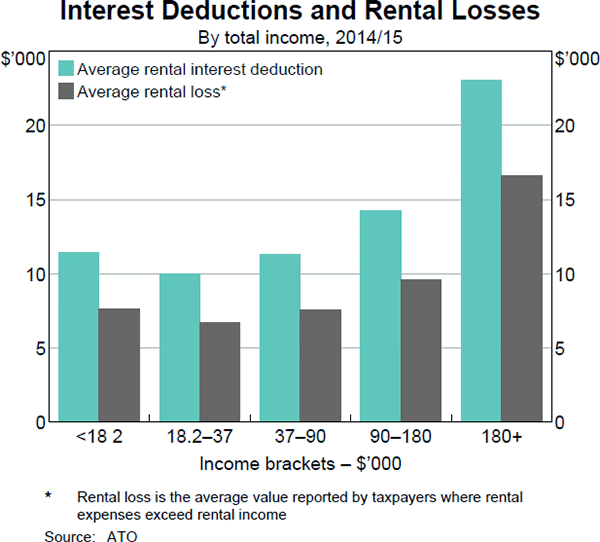
The absolute size of rental loss is largest for higher-income taxpayers (Graph
B4).
Relative to total income, however, the rental loss is largest for the lowest
income bracket and gets progressively smaller for higher income brackets.
This suggests that lower-income taxpayers may be more vulnerable to increases
in debt repayment obligations or reductions in income. They might also be
more reliant on rental income to meet their repayments. About 35 per cent
of individuals in the lowest income bracket are over the age of 60 and the
majority of this income group did not have any salary income (though they
may have superannuation or other non-taxable income not included in this classification).
This suggests that this group could include people who are retired or temporarily
out of the workforce. About 70 per cent of investors in this group also indicated
that they have a partner; for these households, partner income might provide
another source to service investor loans.
Graph B4
Profession
Professionals, for example teachers, lawyers and doctors, account for the largest
share of property investors, reflecting their large share as taxpayers and
their greater propensity to be investors; they account for 17 per cent of
taxpayers and 22 per cent of investors (Table B1). Managers and professionals
together account for over one-third of property investors, likely due to their
relatively high median income. In contrast, lower-income occupations exhibit
a lower propensity to invest in property; in general, they account for a smaller
share of property investors than of their share as taxpayers. Even among some
lower-income occupations, however, large proportions of investors are negatively
geared. For example, 72 per cent of community and personal service worker
investors and 67 per cent of sales worker investors are negatively geared
compared with an average of 62 per cent across all occupations. These investors
could be particularly vulnerable to an income shock affecting their ability
to meet mortgage repayments.
| Occupation | Median salary income ($) | Share of all taxpayers (%) | Share of all investors (%) | Share of investors in occupation (%) | Share of occupation’s investors that are negatively geared (%) |
|---|---|---|---|---|---|
| Managers | 65,784 | 10 | 15 | 23 | 71 |
| Professionals | 65,755 | 17 | 22 | 21 | 70 |
| Machinery operators & drivers | 55,542 | 5 | 3 | 11 | 74 |
| Technicians & trade workers | 54,256 | 9 | 8 | 14 | 73 |
| Clerical & administrative workers | 42,926 | 12 | 12 | 16 | 68 |
| Labourers | 32,396 | 8 | 3 | 7 | 66 |
| Community & personal service workers | 31,790 | 8 | 5 | 10 | 72 |
| Sales workers | 27,788 | 7 | 4 | 8 | 67 |
| Other(a) | 32,594 | 25 | 28 | 18 | 39 |
| Total(b) | 46,428 | 100 | 100 | 16 | 62 |
|
(a) About 80 per cent of the ‘other’ category is individuals Source: ATO |
|||||
Age
There has been a marked increase in the age of property investors since the mid 2000s.
Over the decade to 2014/15, the share of property investors who were aged
60 years and over almost doubled (Graph B5). This shift reflected both the
increase in the share of the population aged over 60 and an increase in the
extent of investment property ownership within this age group. Overall, around
20 per cent of taxpayers aged over 40 are property investors compared with
less than 10 per cent of those under 40.
Graph B5
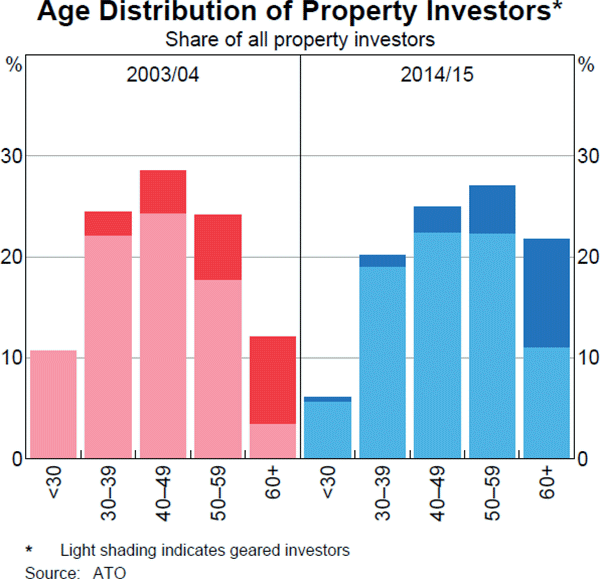
There has also been a significant increase in the share of geared investors aged
over 60. While this seemingly could increase risks, there are some mitigating
factors. Although this age group is more indebted, the average retirement
age has increased over time, so older investors are more likely to be working,
increasing their capacity to withstand shortfalls in rental income or higher
interest rates. In 2004, just under 50 per cent of indebted investors over
the age of 60 received salary income, but this had increased to 60 per cent
in 2015. Older investors may also have greater accumulated wealth that could
enable them to withstand lower rental income or higher mortgage interest.
They might also have lower personal expenses.
Overall, however, borrowing has remained far more prevalent among younger investors,
with almost all investors below the age of 40 years being indebted. While
these investors generally have stable wage and salary income, they also have
relatively high personal expenses that can reduce their ability to cushion
changes in rental income and interest rates.
State
In most states, the share of the Australian population who own an investment property
is similar to the overall share of investment properties located in that state.
Queensland is a notable exception – around 25 per cent of all rental
properties are in Queensland but less than 20 per cent of investors
are from Queensland. This suggests a sizeable share of investment properties
in Queensland are owned by investors with multiple properties or people not
residing in the state, who are possibly less informed about the local property
and rental market. This could increase the likelihood of many investors selling
in a sharp downturn. Information from liaison suggests there was strong investor
demand due to dwelling price and yield differentials with other states and
the active role of property marketers, particularly in areas of Queensland
exposed to the resources boom.


